Global Environment Outlook (GEO-4): Chapter 6
all regions is unfairly shifting burdens onto
future generations, and contradicts the
principle of intergenerational equity.
Contents
- 1 Chapter 6: Sustaining a Common Future (Global Environment Outlook (GEO-4): Chapter 6)
- 2 Africa
- 2.1 Drivers of Change
- 2.2 Selected Issue: Land Degradation
- 2.3 Asia and the Pacific
- 2.4 Selected Issues
- 2.5 Transport and Urban Air Quality
- 2.6 Freshwater Stress
- 2.7 Valuable Ecosystems
- 2.8 Agricultural Land Use
- 2.9 Waste Management
- 3 Europe
- 3.1 Drivers of Change
- 3.2 Selected Issues
- 3.3 Climate Change and Energy
- 3.4 Freshwater Stress
- 3.5 Latin America and the Carribean
- 3.6 Selected Issues
- 3.7 Degraded Coasts and Polluted Seas
- 3.8 Regional Vulnerability to Climate Change
- 3.9 North America
- 3.10 Selected Issues
- 3.11 Energy and Climate Change
- 3.12 Sprawl and the Urban-Rural Interface
- 3.13 Freshwater
- 3.14 West Asia
- 3.15 Polar Regions
- 3.16 Increasing Development and Commercial Activity
- 3.17 Regional Environmental Challenges
- 3.18 ContributorsCoordinating lead authors: Jane Barr and Clever MafutaLead authors:Africa: Clever MafutaAsia and the Pacific: Murari Lal and Huang YiEurope: David StannersLatin America and the Caribbean: Álvaro Fernández-González, Irene Pisanty-Baruch, and Salvador Sánchez-ColónNorth America: Jane BarrWest Asia: Waleed K. Al-Zubari and Ahmed Fares AsfaryPolar Regions: Joan Eamer and Michelle Rogan-FinnemoreContributing authors:Africa: Washington Ochola, Ahmed Abdelrehim, Charles Sebukeera, and Munyaradzi ChenjeAsia and the Pacific: Jinhua Zhang, Tunnie Srisakulchairak Sithimolada, Sansana Malaiarisoon, and Peter KouwenhovenEurope: Gulaiym Ashakeeva, Peter Bosch, Barbara Clark, Francois Dejean, Nikolay Dronin, Jaroslav Fiala, Anna Rita Gentile, Adriana Gheorghe, Ivonne Higuero, Ybele Hoogeveen, Dorota Jarosinska, Peder Jensen, Andre Jol, Jan Karlsson, Pawel Kazmierczyk, Peter Kristensen, Tor-Björn Larsson, Ruben Mnatsakanian, Nicolas Perritaz, Gabriele Schöning, Rania Spyropoulou, Daniel Puig, Louise Rickard, Gunnar Sander, Martin Schäfer, Mirjam Schomaker, Jerome Simpson, Anastasiya Timoshyna, and Edina VadovicsLatin America and the Caribbean: Paola M. García-Meneses, Elsa Patricia Galarza Contreras, Sherry Heilemann, Thelma Krug, Ana Rosa Moreno, Bárbara Garea, José Gerhartz Muro, Stella Navone, Joana Kamiche-Zegarra, and Farahnaz SolomonNorth America: Bruce Pengra and Marc SydnorWest Asia: Asma Ali Abahussain, Mohammed Abido, Rami Zurayk, Abdullah Al-Droubi, Ibrahim Abdul Gelil Al-Said, Saeed Abdulla Mohamed, Sabah Al-Jenaid, Mustafa Babiker, Maha Yahya, Hratch Kouyoumjian, Anwar Shaikheldin Abdo, Dhari Al-Amji, Samira Asem Omar, Asadullah Al-Ajmi, Yousef Meslmani, Gilani Abdelgawad, Sami Sabry, Mohamed Ait Belaid, Sahar Al-Barari, Fatima Haj Mousa, Ahlam Al-Marzouqi, Elham Tomeh, Omar Jouzdan, Said Jalala, Mohammed Eila, and Nahida ButaybanPolar Regions: Alan Hemmings, Christoph Zöckler, and Christian NellemannChapter review editors: Rudi Pretorius and Fabrice RenaudChapter coordinator: Ron Witt (Global Environment Outlook (GEO-4): Chapter 6)
Chapter 6: Sustaining a Common Future (Global Environment Outlook (GEO-4): Chapter 6)
Main messages
Multi-stakeholder consultations organized in the seven GEO regions as part of the GEO-4 assessment show that the regions share common concerns about a number of critical environmental and sustainability issues as well as face tremendous differences in their environmental challenges. The assessment highlights strong interdependencies reinforced by globalization and trade, with growing demand on resources in and across the regions. Some of the main common messages arising out of regional analyses include the following:
Population and economic growth are major factors fuelling increased demand on resources, and contributing to global environmental change in terms of the atmosphere, land, water and biodiversity. Four of the regions identified climate change as a key priority issue (Europe, Latin America and the Caribbean, North America, and the Polar Regions). The other regions have also highlighted climate change as a major issue. Developed regions have higher per capita emissions of greenhouse gases, while climate change impacts will have greater effects on the poor and other vulnerable people and countries.
There has been an encouraging decoupling of environmental pressures from economic growth in some areas. However, globalization has contributed to the achievement of environmental progress in some developed regions at the expense of developing countries through the outsourcing of energy, food and industrial production, and the subsequent relocation of related environmental and social impacts. Disparities in ecological impacts prevail, and environmental inequities continue to grow. Gender inequities continue in many regions where women often have limited access to natural resources, and are exposed to the health risks of indoor air pollution.
There are examples of good environmental governance and investments in new technologies that provide models for other regions. Economic, political and social integration, combined with good governance, is making Europe a leader in transboundary environmental decision making. North America is a model in providing access to superior quality environmental information, and investments in research and development. Africa, Asia and the Pacific, Latin America and the Caribbean and West Asia have also made great strides in tackling some of their environment and development challenges. Integrated watershed management is increasing in many regions, helping to protect and restore ecosystems.
Unique regional concerns emphasize the diversity of environmental issues across the globe. The variety of the main regional environmental messages is reflected in the following:
In Africa, land degradation is the overarching environmental issue of concern, affecting some 5 million square kilometers of land by 1990 and contributing to loss of livelihoods. Poverty is both a cause and a consequence of land degradation: poor people are forced to put immediate needs before the long-term quality of the land, while degraded farmland and poor yields contribute to food and income insecurity. Per capita food production in Africa has declined by 12 per cent since 1981. Drought and climate change and variability exacerbate land degradation. In addition to threatening the livelihoods of the rural poor, land degradation has widespread effects on Africa’s river catchments, forests, the expansion of deserts, and it diminishes ecosystem services. Regional efforts to stop land degradation include integrated crop and land management programmes that also seek to improve yields. Policy shortcomings in addressing the issue still exist, as do unfair agricultural subsidies in developed regions.
In Asia and the Pacific, rapid population growth, higher incomes, and burgeoning industrial and urban development are causing a number of environmental problems that have implications for human health and well-being. The priority issues are urban air quality, stress on freshwater, degraded ecosystems, agricultural land use and increased waste. A number of factors have led to an increase in urban air pollution: a highly urbanized population; poorly planned municipal development; a lack of affordable and clean mass transport services; the massive increase in motorized vehicles, with the use of passenger cars in the region increasing about 2.5 times over the last two decades; and haze pollution from forest fires in South East Asia. Air pollution causes the premature deaths of about 500,000 people annually in Asia. Excessive withdrawals from surface waters and aquifers, industrial pollution, inefficient use, climate change and variability, and natural disasters are major causes of water stress, threatening human well-being and ecological health. There has been remarkable progress in the provision of improved drinking water over the last decade, but some 655 million people in the region (17.6 per cent) still lack access to safe water. Valuable ecosystems continue to be degraded. Except for Central Asia, most sub-regions have applied sufficient counter measures to successfully overcome the impacts of land degradation on agricultural production. Rapid economic growth, together with new lifestyles associated with greater affluence, have led to rapid changes in consumption patterns. This has contributed to the generation of large quantities of waste, and changes in waste composition. The illegal traffic in electronic and hazardous waste and their effects on human health and the environment pose new and growing challenges. Most countries have developed extensive domestic laws, regulations and standards related to the environment, and participate in global action through multilateral and bilateral agreements.
In Europe, rising incomes and growing numbers of households contribute to unsustainable production and consumption, increased energy use and emissions of greenhouse gases, poor urban air quality and transportation challenges. Biodiversity loss, land-use change and freshwater stresses are the other priority issues. The region has made progress in decoupling economic growth from resource use and environmental pressures, although per capita household consumption is steadily increasing. Since 1987, greenhouse gas (GHG) emissions from the energy sector have been reduced in Western Europe, but have increased since the end of the 1990s across the whole region, partly because increasing natural gas prices have re-established coal as a key energy source. Recently, growing public awareness, underpinned by rising energy prices, has given a new political momentum to climate change policies. Despite much progress, poor water and urban air quality still cause substantial problems in parts of the region, affecting the health and quality of life of many people. However, in most parts of the region, water quality has improved since 1990 due to reductions in contaminant loads from wastewater treatment and industries, as well as a decline in industrial and agricultural activity. Emissions of air pollutants are largely driven by the demand for greater mobility. The EU has been imposing progressively stricter pollution controls on vehicles. Farming in marginal areas is under pressure, and is subject to both land abandonment and intensification, both of which have impacts on biodiversity. With its many action plans and legal instruments at different levels, the region has a unique experience of environmental cooperation.
In Latin America and the Caribbean, the priority environmental issues are growing cities, threats to biodiversity and ecosystems, degraded coasts and polluted seas, and regional vulnerability to climate change. Regionalization and globalization have triggered an increase in oil and gas extraction, expanded the use of arable land for monoculture exports and intensified tourism. As a result, decreased access to rural livelihoods has helped fuel the continued unplanned growth of urban areas. The region is the most urbanized in the developing world, with 77 per cent of the total population living in cities. The quality of fuels (both gasoline and diesel) has gradually improved throughout the region, but urban air pollution and associated health impacts are high and increasing. Untreated domestic and industrial wastewaters are on the rise, affecting coastal areas, where 50 per cent of the people live. Domestic waste is generally insufficiently treated. Land use change has had impacts on biodiversity and cultural diversity. The conversion of forest land to pastures, monoculture planted forests, infrastructure and urban areas is causing habitat loss and fragmentation, as well as the loss of indigenous knowledge and cultures. Other pressures are from wood harvesting, forest fires and the extraction of fossil fuels. Integrated prevention and control programmes are helping to decrease annual deforestation rates in the Amazon. Land degradation affects 15.7 per cent of the region, due to deforestation, overgrazing and inappropriate irrigation. Protected areas now cover 11 per cent of the land base, and new efforts are being made to conserve corridors and the Amazon, but more efforts are needed to protect hot spots. Declining water quality, climate change and algal blooms have contributed to the rise in waterborne diseases in coastal regions. To address the pressures, integrated marine and coastal areas management is increasing. Extreme climatic events have increased over the past 20 years, and the region is subject to climate change impacts, such as retreating glaciers.
In North America, energy use, urban sprawl and freshwater stresses can all be related to climate change, an issue the region is struggling to address. With only 5.1 per cent of world population, North America consumes just over 24 per cent of global primary energy. The consumption of energy is responsible for much of the region’s high and increasing GHG emissions that contribute to climate change. Canada signed the Kyoto Protocol, and has produced a plan to become more energy efficient, while some US (Energy profile of the United States) states are showing impressive action to reduce energy use and emissions in the absence of mandatory federal caps. Further gains in energy efficiency have been hampered by increased use of larger and less fuel-efficient vehicles, low fuel economy standards, and increases in distances travelled and the number of cars. Sprawling suburbs and a growing trend towards exurban settlement patterns are fragmenting ecosystems, increasing the urban-wildlife interface and paving over prime agricultural land. Although there are policies to contain sprawl, suburban life is deeply imbedded in the culture and landscape. The past 20 years have seen important regional water shortages, and climate change is expected to exacerbate water deficits. Agriculture is the major water user, and irrigation continues to increase, competing with urban centres for limited supplies. In response, water restrictions and conservation strategies have become widespread. The human health impacts of environmental change are an emerging issue, as it becomes more evident that air pollution is linked to respiratory diseases, and there are significant economic costs.
In West Asia, freshwater stresses, land degradation, coastal and marine ecosystems degradation, urban management, and peace and security are the priority issues. The region’s environment is predominantly dryland, with great variability in rainfall within and between seasons, and frequent spells of drought. West Asia is one of the most water-stressed regions in the world. Reflecting rapid population growth and socio-economic development, overall per capita freshwater availability has fallen, while consumption has risen. Agriculture uses 80 per cent of the region’s available water. Aided by subsidies, irrigated agriculture has expanded to achieve food security, but inefficient methods and poor planning have put immense pressure on the limited resource. Desalination of seawater provides the bulk of municipal water in the GCC countries, but sustainability is hampered by a lack of demand management and price-signalling mechanisms. The level of sewage treatment is low, so shallow aquifers are polluted, and have high levels of nitrates, a health hazard. In the Mashriq sub-region, water-borne diseases are a major concern. Since more than 60 per cent of surface water resources originate from outside the region, the sharing of international water resources is another major challenge. With increased urbanization and growing economies, the number of vehicles has risen enormously. Although unleaded gasoline has been introduced in most of the countries, continued use of leaded (Lead) gas contributes to air pollution, and poor human health and economic performance. In some countries, growing economic disparities, rising rural-urban migration and/or military conflicts have led to the expansion of slum areas, and increased human suffering, often related to deteriorating environmental conditions. Land degradation is a key issue, especially since fragile drylands constitute about 64 per cent of the total area. A number of factors have led to the deterioration of marine and coastal areas, including fisheries (Fisheries and aquaculture), mangroves and coral reefs. They include rapid development of urban and tourism infrastructure, and of refineries, petrochemical complexes, power and desalination plants, as well as oil spills from ship ballast. Vast areas of terrestrial and marine ecosystems have been severely affected by wars, which led to the discharge of millions of barrels of crude oil into coastal waters. They have also been harmed by the infiltration of oil and seawater into aquifers, and by hazardous waste disposal. Environmental impact assessment requirements were introduced recently. Other responses include programmes to conserve biodiversity, manage coastal zones and develop marine protected areas.
The Polar Regions influence major environmental processes, and have direct impacts on global biodiversity and human well-being. The priority issues are climate change, persistent pollutants, the depletion of the ozone layer, and commercial activity. Even though their GHG emissions are negligible, the Polar Regions are part of a cycle of global climate change impacts, such as altered ocean currents and rising sea levels. Evidence shows that circulation of the deep, cold water of the North Atlantic conveyor belt may have slowed. Its breakdown could precipitate an abrupt change in global climate regimes. As a result of climate change, the Arctic is warming twice as fast as the world average, causing shrinking sea ice, melting glaciers and changes in vegetation. The Greenland and Antarctic ice sheets are the largest contributors to the sea level rise from melting land ice. Observed climate change has wide-ranging impacts on plants, animals and human well-being in the Arctic. Although the manufacture and use of many persistent organic pollutants (POPs) have been banned in most industrialized countries, they persist in the environment and accumulate in cold regions where they enter marine and terrestrial ecosystems, and build up in food chains. Mercury from industrial emissions is also increasing in the environment. These toxic substances pose a threat to the integrity of the traditional food system and the health of indigenous peoples. Action by scientists and northern indigenous peoples resulted in several important treaties to address toxic chemicals. Stratospheric ozone depletion in the Polar Regions has resulted in seasonal increase in ultraviolet radiation, with impacts on ecosystems and increased human health risks. Despite the success of the Montreal Protocol, recovery of the stratospheric ozone layer is expected to take another half century, or more.
Regional Developments
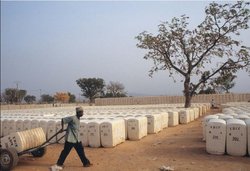 Cotton bales ready for export from Cameroon. Farmers in developing regions face many challenges due to unfair global markets. (Credit: Mark Edwards/Still Pictures)
 Since the World Commission on Environment and Development (Brundtland Commission), international and national environmental policies have invoked sustainable development to address the impacts of economic growth, ensure a clean environment today and in the future, and reduce the cumulative effects of poverty. The 2005 United Nations Summit was one of the largest gatherings of world leaders in history. It emphasized the urgency and relevance of achieving more sustainable development. According to the World Business Council for Sustainable Development, “the planet seems at least as unsustainable as in 1987” [63]. Sustainable development is particularly critical in a world where pressures on the environment are increasing, with a wide range of ensuing impacts on the environment and human health. Some of the impacts, such as climate change, long-range air pollution and upstream-to-downstream water pollution can have far-reaching effects.
Economic trends
Economic trends over the past two decades have played a significant role in shaping the state of the world’s environment (see Chapter 1). In 1987, many developing countries were in an economic downturn, characterized by falling prices for their exports, which consist mainly of raw materials, such as mineral ores and agricultural products. The prices of such commodities have often not increased significantly since the 1980s, and the current economic order has been worsened by growing loan repayment burdens. Africa, for example, enjoys only 5 per cent of the developing world’s income, but it carries about two-thirds of the global debt[64], with sub-Saharan Africa spending US$14.5 billion yearly on debt repayments[65]. Despite some recent efforts towards debt relief, developing countries in Africa and other regions are still forced to exploit the limited capital tied up in their natural resources.
The Brundtland Commission highlighted poverty alleviation as one of the key responses needed to address the world’s environmental problems, and this is still valid today. Poverty and environmental degradation have a cause-and-effect relationship, and can fall into a cycle that is difficult to reverse[66]. Some argue that the past two decades have seen too modest and uneven economic growth rates (see Figure 6.1 and Figure 1.7 in Chapter 1, which shows 20-year averages at a country level) to have influenced a significant positive effect on the state of the environment. However, a contrary argument is that economic growth is the cause of current environmental degradation. The conundrum is illustrated by the case of nutrient loading, which was highlighted in GEO-3 as a priority environmental issue[67]. Large-scale fertilizer applications boost yields of hybrid crops, which the Brundtland Commission projected would increase food production through a green revolution. While fertilizers have made a positive contribution to growth of the agricultural sector, and ultimately to the economy, excessive nutrients from agricultural inputs have also contributed to soil degradation, and affected freshwater quality and marine ecosystems, endangering the ecosystem services that are the basis of long-term economic prosperity[68].
Livelihood conditions
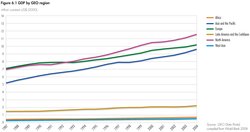 Fig 6.1 GDP by GEO region.[1]
 Across the world, there is a clear trend of increasing food production to keep pace with growing populations and rising incomes. The world’s population (Human population explosion) is currently estimated at 6.7 billion, having grown by some 1.7 billion since 1987[69]. The Brundtland Commission warned against attributing environmental problems to population growth alone, since global environmental problems can also be accounted for by inequalities in access to resources and their unsustainable use. Prior to 1987, developed countries, with one-quarter of the world’s population, consumed about 80 per cent of commercial energy and metals, 85 per cent of paper, and more than half of the fat contained in food[70]. The situation virtually remains the same today, with North America, for example, consuming over 24 per cent of the total global primary energy despite having only 5.1 per cent of the world’s population[71].
The world continues to undergo regional and national economic changes that have global consequences. These include trade and subsidies. For example, the World Trade Organization (WTO) relies on regional trade agreements to settle disputes between member countries. While many of these disputes deal exclusively with trade issues, some focus on the use of environmental or social measures taken by countries that allegedly affect foreign competition. Examples include efforts by the United States to protect dolphins and sea turtles from harmful fishing, efforts that have been challenged under the General Agreement on Tariffs and Trade and the WTO. These were called the tuna-dolphin and shrimp-turtle disputes. Other well-known cases include beef and hormones (United States vs. European Community), gasoline and air quality (Venezuela and Brazil vs. United States), softwood lumber (Canada vs. United States), asbestos (Canada vs. France and the European Community), and most recently, genetically modified organisms (United States vs. European Community)[72].
In the United States and Europe, food surpluses are partly a result of subsidies and other incentives that stimulate production, even where there is little or no demand. In the 10-year period from 1995 to 2004, the US government provided some US$143.8 billion in subsidies to its farmers[73]. Although this averages about half the annual cost of food aid in 1986, which stood at US$25.8 billion[74], the impact on developing countries is significant. Many of them find it cheaper to import food than to produce their own, and are forced to focus on producing export crops such as cotton, tobacco, tea and coffee. This reduces agricultural opportunities for smallholder subsistence farmers, leading to food insecurity, particularly in rural areas, or unsustainable urban growth as a result of rural to urban migration.
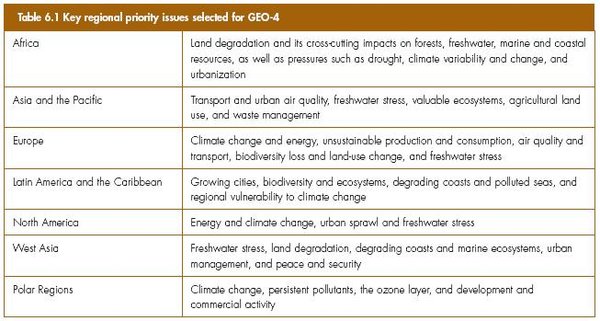 Table 6.1 Key regional priority issues selected for GEO-4.
 In theory, global natural resources have the capacity to produce enough food, medicine, shelter and other life-supporting services for an even larger population (see Box 6.1). In reality, this is not the case, due to the uneven distribution of such resources, including fertile and well-watered land, forests, wetlands and genetic resources. The capacity of these natural resources to support life is diminished by land degradation, air and water pollution, climate variability and change, deforestation, and loss of habitats and biodiversity. As a result of the uneven access to, and unbalanced production levels of natural resources, the world continues to suffer disparities in food production levels, with both food surpluses in some regions and widespread food shortages in others.
|
Box 6.1 Increasing demand – diminishing global natural resources[75] |
|
Global environmental problems are more evident today than they were two decades ago. For example, by 2003 global CO2 emissions had increased by 17 per cent compared to 1990 levels. The rapidly-expanding economies of China and India are contributing significantly to this increase. China is already the second largest CO2 emitter after the United States. 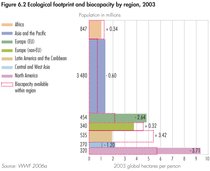 Fig 6.2 Ecological footprint and biocapacity by region, 2003.[2] Fig 6.2 Ecological footprint and biocapacity by region, 2003.[2] Most of these emissions come from energy generation. The resulting air pollution has a significant impact not only on local File:Air quality and human health, but also on the global climate (see Chapter2 (Global Environment Outlook (GEO-4): Chapter 6)). Despite the Brundtland Commission’s recommendation for the introduction of fuel-efficient modern technologies, and the commitment by the World Summit on Sustainable Development in 2002 to diversify energy supply and substantially increase the global share of renewable energy sources, it is projected that fossil fuels will remain the dominant energy source to 2025, accounting for over 80 per cent of the energy demand. Therefore, the world continues to be locked into unsustainable energy patterns that are associated with climate change and other environmental and human health threats. This situation is compounded by disparities in regional energy consumption patterns (see Figure 1.8 in Chapter (Global Environment Outlook (GEO-4): Chapter 6)1). It is projected that over 70 per cent of the increase in energy demand up to 2025 will come from developing countries, with China alone accounting for 30 per cent, implying that both developed and developing regions will have major impacts on both air quality and global climate change. The unsustainability of the way the Earth’s natural resources are being used is increasingly evident. As a result of the growing competition and demand for global resources, the world’s population has reached a stage where the amount of resources needed to sustain it exceeds what is available. An example of ecological overshoot is seen in attempts to increase food production that result in increased levels of environmental degradation, such as deforestation of marginal lands, including wetlands, upper [[watershed]s] and protected areas that have been converted to farmlands. According to the 2005 Footprint of Nations report, humanity’s footprint is 21.9 ha/person, while the Earth’s biological capacity is, on average, only 15.7 ha/person, with the ultimate result that there is net environmental degradation and loss. On a regional level, the differences in footprint are profound, as illustrated in the Living Planet Report 2006 (see Figure 6.2) |
Selected environmental issues
The following sections of this chapter examine the most significant environmental issues in the seven UNEP regions: Africa, Asia and the Pacific, Europe, Latin America and the Caribbean, North America, West Asia, and the Polar Regions (see the regional maps in the introductory section of this report). Regional overlaps exist across some of the regions, due to historical links and biophysical ties, which make it difficult to strictly disaggregate data. Examples of overlaps among regions include the case of Africa, Europe and West Asia, where the Mediterranean provides a quasi border (see Box 6.46), and that of Latin America and Caribbean and the North American regions, with their overlaps.
Each region held consultations to identify its regional issues of global significance. From these consultations, between one and five key environmental priority issues were selected for focused analyses in each regional section (see Table 6.1).
All regions report progress over the past 20 years in making environmental matters part of mainstream politics. In most regions, sustainable development strategies have been formulated, and are being integrated into national policies. The public, including indigenous peoples, participates to a much greater degree in environmental decision making (see the Polar section).
A more holistic approach to environmental management is being taken, with ecosystem approaches becoming common. For example, promising new integrated management strategies that involve public participation are being introduced in both freshwater (Freshwater biomes) and marine systems to protect valuable resources and livelihoods. The economic value of ecosystem services is now recognized, and some payment schemes are emerging. In many regions, proposed projects now require environmental impact assessments. Recycling and other waste management strategies are evolving in many areas, and sustainable consumption (Consumption and well-being) is increasingly promoted. In recognition of the transboundary nature of environmental pressures and impacts, better models of managing shared environments have emerged, such as regional seas.
Africa
Drivers of Change
Socio-economic trends
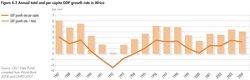 Fig 6.3 Annual total and per capita GDP growth rate in Africa.[3]
 Africa’s social and economic performance has improved in recent years. Between 1995 and 2004, African economies have grown (Figure 6.3). In 2004, the economic growth rate in terms of purchasing power was 5.8 per cent, up from 4 per cent in 2003[76]. Sub-Saharan Africa’s economies must grow at an average annual rate of 7 per cent to reduce income poverty by half by 2015[77]. Improved economic growth since the mid- 1990s has increased the region’s chances to meet key MDG targets, and this may have a positive effect on the environment[78]. However, the demand on the region’s resources is growing as a result of the increasing human population (see Figure 6.4) and economic activities.
Environmental governance
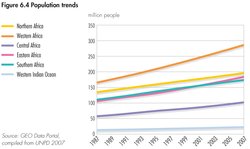 Fig 6.4 Population trends.[4]
 Since 1987, several major regional developments have resulted in significant changes in the way environmental issues are managed in Africa. They include political reforms, institution building and new policy measures that reinforce the Brundtland Commission’s messages, and seek to promote sustainable development.
Among key political reforms since 1987 was the transformation of the Organization of African Unity (OAU) to the African Union (AU) in 2002 to focus greater attention on accelerated regional political and socio-economic development. In this context, African leaders launched a major regional socioeconomic and development plan in 2003, the New Partnership for Africa’s Development (NEPAD).
The UN General Assembly adopted NEPAD as the framework for Africa’s development, under which the 2003 Action Plan of the Environment Initiative (EAP), Africa’s most recent regional environmental policy, was developed. The EAP seeks to address Africa’s environmental challenges, while combating poverty and promoting socio-economic development. Prepared under the leadership of the African Ministerial Conference on the Environment (AMCEN), a pan-African forum for environment ministers established in 1985, it strengthens cooperation in halting the degradation of Africa’s environment, and in satisfying the region’s food and energy needs[79]. AMCEN has since matured into a forum that provides a framework for environmental policy orientation while defending Africa’s stake and interests on the international stage.
Although still weak, there have been a number of policy initiatives since the Brundtland Commission, including landmark multilateral agreements, such as the 1991 Bamako Convention on the Ban of the Import into Africa and the Control of Transboundary Movement and Management of Hazardous Wastes Within Africa, and the 1994 Lusaka Agreement on Co-operative Enforcement Operations Directed at Illegal Trade in Wild Fauna and Flora.
Some policies were already in place before 1987. These include the African Convention on the Conservation of Nature and Natural Resources (Algiers Convention), the first Africa-wide environmental convention for the conservation, use and development of soil, water, flora and fauna in accordance with scientific principles, and with due regard to the best interests of the people. The treaty has been revised and was adopted by the AU Assembly in July 2003. The new text makes the convention comprehensive and modern, and the first regional treaty to deal with a wide spectrum of sustainable development issues[80]. Other earlier regional conventions include the 1981 Convention for Cooperation in the Protection and Development of the Marine and Coastal Environment of the West and Central African Region (Abidjan Convention), and the 1985 Nairobi Convention for the Protection, Management and Development of the Marine and Coastal Environment of the Eastern African Region.
People in Africa recognize that land use and degradation have cross-cutting impacts on other resources, including forests, freshwater (Freshwater biomes), marine and coastal resources. Similarly, issues such as drought, climate variability and change, and urbanization act as pressures that exacerbate land degradation.
Selected Issue: Land Degradation
Land resources: endowments and opportunities
Africa’s 53 countries have a total land area of about 30 million square kilometres, comprised of a variety of ecosystems, including forests and woodlands, drylands, grasslands, wetlands, arable lands, coastal zones, freshwater (Freshwater biomes), mountain and urban areas. The 8.7 million km2 of Africa’s land that is considered suitable for agricultural production has the potential to support the majority of the region’s people[81]. Forest land covers 6.4 million km2, representing 16 per cent of the global forest cover[82]. The Congo River basin has Africa’s largest forest reserve, and is the second largest contiguous block of tropical rain forest in the world after the Amazon[83].
Covering about 1 per cent of Africa’s total land area, wetlands are found in virtually all countries, and are a key land feature[84]. Some of the more prominent wetlands include the Congo Swamps, the Chad Basin, the Okavango Delta, the Bangweulu swamps, Lake George, the floodplains and deltas of the Niger and Zambezi rivers, and South Africa’s Greater St Lucia Park wetlands.
About 43 per cent of Africa’s land is “susceptible” dryland[85] (see Chapter3 (Global Environment Outlook (GEO-4): Chapter 6)). This figure excludes hyper-arid areas, such as about two-thirds of the Sahara in Northern Africa, which, at over 9 million km2, is the largest desert in the world[86]. Together with Namibia’s Skeleton Coast, the Kgalagadi (Kalahari) desert in Southern Africa (mainly arid land) is the world’s largest body of sand[87].
Mountains are also important land features in Africa, especially for smaller countries, including Swaziland, Lesotho and Rwanda, which rank among the world’s top 20 mountainous countries[88]. Kilimanjaro (Tanzania), Mount Kenya and Ruwenzori (Uganda and the Democratic Republic of Congo) are Africa’s three highest mountains[89].
Rolling grasslands dotted with trees, often called savannah, are extensive in Africa. Savannah grasslands occur in areas where rainfall is sufficient to prevent the establishment of desert vegetation but too low to support rain forests. They are held between these two extremes by climate, grazing and fire. Savannahs are among the most spectacular biomes from both landscape and wildlife perspectives. Savannah grasslands mainly cover parts of most sub-Saharan countries (Maya 2003).
 Fig 6.5 Major land-use categories in Africa, 2002.[5]
 Clearly, land is an environmental, social and economic good that is critical to the realization of opportunities for the people of Africa. Figure 6.5 shows the share of Africa’s main land uses, including pastures, cropland, forests and woodlands. Agriculture is the dominant land use in Africa, and the biggest employer, although trends since 1996 show a small decline in its importance relative to other employment sectors (see Figure 6.6). Other economic activities that African people depend on include fisheries (Fisheries and aquaculture), forestry, mining and tourism.
Some of the world’s major tea, coffee and cocoa-producing countries are in Africa. For example, Kenya is the fourth largest tea producer in the world with 324,600 tonnes in 2004, up from 236,290 tonnes in 2000[90].
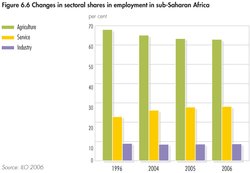 Fig 6.6 Changes in sectoral shares in employment in sub-Saharan Africa.[6]
 Horticulture, which accounts for 20 per cent of global agricultural trade, and is the fastest-growing agricultural sector, has significant potential in Africa. According to the Africa Environment Outlook 2 report[91], horticultural exports in sub-Saharan Africa exceed US$2 billion/year. Africa could benefit more if it were to fully utilize its irrigation potential: a mere 7 per cent of all arable land in Africa is under irrigation[92].
In addition to agriculture, African peoples rely on fisheries to provide some of their food needs. Nearly 10 million people depend on fishing, fish farming, and fish processing and trade. Africa produces 7.3 million tonnes of fish/year, 90 per cent of which is caught by small-scale fishers. In 2005, the region’s fish exports were worth US$2.7 billion[93].
Electricity, mainly hydropower, is critical to the growth of the economy. Africa’s hydropower potential is not fully used; only five per cent of the economically feasible hydropower potential of 1 million gigawatt hours/year is utilized[94].
|
Box 6.2 Nature-based tourism[95] |
 Nature-based tourism is a major growth industry. (Credit: Ngoma Photos) Nature-based tourism is a major growth industry. (Credit: Ngoma Photos) Nature-based tourism is one of the fastest growing tourism sectors worldwide, representing 7 per cent of the total worldwide export of goods-and-services. Nature-based tourism depends on the conservation of natural landscapes and wildlife, and using ecosystems in this way promotes both human well-being and biodiversity conservation (see Chapter7 (Global Environment Outlook (GEO-4): Chapter 6)). |
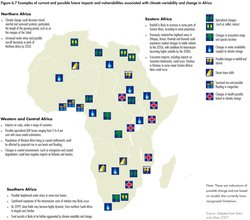 Fig 6.7 Examples of current and possible future impacts and vulnerabilities associated with climate variability and change in Africa.[7]
 Resources such as forests and woodlands provide a wide range of goods-and-services, including firewood and construction timber. Although less evident, they also provide ecosystem functions, such as protecting the soil from erosion, protecting [[watershed]s] and regulating water flows. Through habitat provision, land resources are vital to the growth of wildlife-based tourism in Africa (see Box 6.2). Africa is also endowed with different minerals, including 70 per cent of the world diamonds, 55 per cent of its gold and at least 25 per cent of chromites[96]. Many minerals have yet to be exploited.
Land pressures
Africa’s land is under pressure from increased resource demand due to a growing population, natural disasters, climate change and extreme weather events such as drought and floods, and the inappropriate use of technology and chemicals. Drought can exacerbate land degradation in the drylands (see Chapter 3 and Box 6.3). Land is also degraded through poorly planned and managed activities related to agriculture, forestry and industry, as well as from the impacts of urban slums and infrastructure development (see [[Chapter3 (Global Environment Outlook (GEO-4): Chapter 6)]2]).
|
Box 6.3 Drought frequency and extent[97] |
|
Drought occurs in some parts of sub-Saharan Africa virtually every year. Some of the major droughts in the past two decades include those of 1990–92 and 2004–05. Widespread drying was observed in Western and Southern Africa between the 1970s and early 2000s. Poor rains were the main factor behind the expansion of dry [[soil]s] in Africa’s Sahel region and in Southern Africa, where El Niño-related episodes have become more frequent since the 1970s (see Figure 4.5 in Chapter4 (Global Environment Outlook (GEO-4): Chapter 6), showing global precipitation trends in the 20th century). The 2004–2005 drought was the most widespread in Africa in recent times. It was not limited to the Sahel and Southern Africa, but extended up the eastern coast, where many countries were subject to a multi-year drought that caused food shortages from Tanzania in the south to Ethiopia, Kenya and Eritrea in the north. In the Horn of Africa (Somalia, Ethiopia, Eritrea and Djibouti), it was the sixth consecutive year of severe drought. |
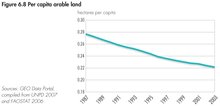 Fig 6.8 Per capita arable land.[8]
 Africa is one of the most vulnerable regions to climate variability and change because of multiple stresses and low adaptive capacity, according to some new studies (see Figure 6.7). Some adaptation to current climate variability is taking place, however, this may be insufficient for future changes in climate[98].
With a growing population, Africa faces declining per capita access to arable land (Figure 6.8) even as the region struggles to increase food production per unit area. Per capita agricultural production declined by 0.4 per cent between 2000 and 2004[99]. Land degradation exacerbates poor food production, increasing food insecurity.
Forest conversion
Africa has the highest deforestation rate of the world’s regions. The region loses an estimated 40,000 km2, or 0.62 per cent of its forests annually, compared to the global average deforestation rate of 0.18 per cent[100]. Africa’s pristine natural forests are being replaced by extensive areas of secondary forests, grasslands and degraded lands. Variation within the region is large. Reported net losses are most significant in those countries with the greatest extent of forests, such as Angola, Tanzania and Zambia in Eastern and Southern Africa, but the rate of loss has shown signs of declining slightly since 2000[101].
Land tenure
The communal land tenure system, in which property is collectively owned, is often cited as the reason for overexploitation of land, contributing to land degradation and deforestation. Under such a system, the costs of impacts such as land degradation, siltation and water pollution are borne by the community as a whole, while potential benefits accrue to the individual. Poor land tenure regimes that precipitate ineffective land-use planning and management can only lead to overexploitation of the resource, contributing to increased land degradation, salinization, pollution, soil erosion and conversion of fragile lands[102].
Urbanization
Although by far the least urbanized region of the world (see Chapter1 (Global Environment Outlook (GEO-4): Chapter 6), Figure 1.6), at 3.3 per cent annual growth between 2000 and 2005, Africa has the world’s highest rate of urbanization, with the urban population doubling every 20 years, and an estimated 347 million people (38 per cent of Africans) living in urban settlements by 2005[103]. While urban areas are centres of economic activity, innovation and development, the rapidly expanding urban centres are encroaching on rural and agriculturally productive land. In addition some of Africa’s urban centres are increasingly characterized by rising poverty levels. Over 72 per cent of the urban population in sub-Saharan Africa lives in slums, without adequate housing, drinking water and sanitation facilities[104]. Informal settlements pose a threat to environmental integrity through practices such as illegal and uncontrolled waste disposal. Poverty is forcing urban dwellers to adopt alternative livelihood strategies such as urban agriculture, which supplements food needs and generates household income.
Land degradation trends
Land degradation is a serious problem in Africa, especially in drylands (see [[Chapter3 (Global Environment Outlook (GEO-4): Chapter 6)]3]). By 1990, land degradation affected an estimated 5 million km2 of the continent[105]. In 1993, 65 per cent of agricultural land was degraded, including 3.2 million km2 (25 per cent) of Africa’s susceptible drylands (arid, semi-arid and dry sub-humid areas)[106]. [[Chapter3 (Global Environment Outlook (GEO-4): Chapter 6)]4] presents a recent assessment of land degradation, based on the last 25-year trend in biomass production (from satellite measurements) per unit of rainfall (see Figure 3.6 in Chapter 3). The most common processes of land degradation in Africa are soil erosion, soil nutrient depletion, contamination of [[soil]s] and salinization.
Soil erosion
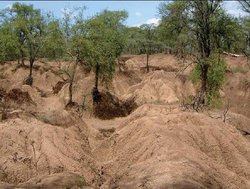 Soil erosion is now widespread in Africa, affecting food production and food security. (Credit: Christian Lambrechts)
 The Brundtland Commission warned that 5.4 million km2 of fertile land would be affected by soil erosion in Africa and Asia unless adequate conservation measures were taken[107]. Soil erosion is now widespread in Africa (see Chapter 3). For example, half of Rwanda’s farmland is moderately to severely eroded, with two-thirds of the soil classified as acidic and exhausted[108].
Despite the reduced productivity of eroded soil, many African farmers are forced to continuously use the same land because of factors such as population pressure, inequitable land ownership and poor land-use planning. There is a strong relationship between population density and soil erosion. The estimated per capita productive land available in Central and Eastern Africa varies from a low of 0.69 ha in the Democratic Republic of Congo, to 0.75 ha in Burundi, 0.85 in Ethiopia, 0.88 in Uganda, 0.89 in Cameroon, 0.90 in Rwanda, 1.12 ha in the Central African Republic, 1.15 in Congo and 2.06 in Gabon[109].
Coastal erosion, resulting from beachfront developments, and the mining of sand, coral and lime, is also worsening, with erosion rates as high as 30 metres/year in Western Africa, mainly in Togo and Benin[110].
Salinization
While irrigation could provide some of the impetus towards a Green Revolution in Africa, inefficient application could lead to land degradation due to salinization. About 647,000 km2, or 2.7 per cent of Africa’s total land area is affected by salinization, representing over 26 per cent of the world’s salinized land area (see Table 6.2)[111].
Desertification
At present, almost half of Africa’s land area is vulnerable to desertification. Africa’s drylands are unevenly distributed across the region, and some are even found in the usually wet tropical zones of Central and Eastern Africa (see Chapter 3). Across Africa, drylands occupy 43 per cent of the region[112]. Areas most affected by desertification (defined as land degradation in susceptible drylands) are located in the Sudano-Sahelian region and Southern Africa. The area along the desert margins, which occupies about 5 per cent of Africa’s land, is at the highest risk of desertification[113]. Areas particularly at risk include the Sahel, a band of semi-arid lands stretching along the southern margin of the Sahara Desert, and some nations that consist entirely of drylands, such as Botswana and Eritrea.
Land degradation impacts
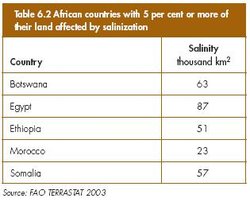 Table 6.2 African countries with 5 percent of more of their land affected by salinization.[9]
 Land degradation is the biggest threat to realizing the region’s full potential from land. It undermines soil fertility, and, especially in the drylands, it can cause productivity losses of as much as 50 per cent[114]. The decline in land quality causes economic stresses, and affects biodiversity through impacts on terrestrial and aquatic ecosystems, and on fishery resources. The degradation also reduces water availability and quality, and can alter the flows of rivers, all leading to serious downstream consequences. The process is closely linked to poverty, which is both a cause and a consequence of land degradation. Poor people are forced to put immediate needs before the long-term quality of the land. The ensuing social, economic and political tensions can create conflicts, more impoverishment and increased land degradation, and force people to seek new homes and livelihoods[115]. Also dust storms are considered by some as an impact of land degradation, while in fact such storms are mainly natural processes that build up in desert areas (see Box 6.4).
|
Box 6.4 Deserts and dust |
 Sandstorm in Gao, Mali. (Credit: BIOS Crocetta Tony/Still Pictires) Sandstorm in Gao, Mali. (Credit: BIOS Crocetta Tony/Still Pictires) Storms can transport fine sand and dust over large areas, having both positive (fertilizer) and negative (small particles) impacts on ecosystems and human health regionally and globally. As described in [[Chapter3 (Global Environment Outlook (GEO-4): Chapter 6)]5], some 90 per cent of such dust originates from natural processes in true deserts in Africa and Asia. |
Food security and poverty
In Africa, the proportion of people living below the poverty line increased from 47.6 per cent in 1985 to 59 per cent in 2000[116]. Some 313 million Africans lived on less than US$1 per day in 2005[117]. As a result of poverty, more people in Africa have limited access not only to food, but also to potable water, minimum health care and education. Poverty is exacerbated by extensive use of degraded land, or [[soil]s] of poor fertility. Unless the land is rehabilitated, both degradation and poverty deepen.
Food insecurity and reduced caloric intake are the major socio-economic impacts of land degradation. Declining soil fertility causes average yield losses of as much as 8 per cent[118]. With the relatively high share of the agricultural sector in Africa’s GDP, as much as 34 per cent in Eastern Africa, it is estimated that land degradation can lead to an annual loss of 3 per cent of agriculture’s contribution to GDP in sub-Saharan Africa. In Ethiopia alone, GDP loss from reduced agricultural productivity is estimated at US$130 million/year[119]. While global per capita food production has risen by over 20 per cent since 1960, it has been falling steadily in Africa, declining by 12 per cent since 1981[120].
The region’s food insecurity is due to a number of factors, including unfavourable weather, land degradation, poverty, conflict and civil strife, HIV/AIDS, low soil fertility, and pests. The proportion of undernourished individuals in sub-Saharan Africa has, on average, fallen from 35 per cent in 1990 to 32 per cent in 2003, but the absolute number of undernourished people increased, from about 120 million around 1980 to some 180 million around 1990 to 206 million in 2003[121]. As such, Africa is the only region in the world where the need for food aid is increasing (see Figure 6.9). In 2004, 40 countries in sub-Saharan Africa received almost 3.9 million tonnes of food aid (52 per cent of global aid)[122], compared to an annual average of just over 2 million tonnes received during the period 1995–1997[123] (see Box 6.5).
|
Box 6.5 Food aid |
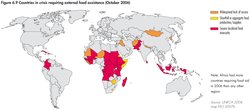 Fig 6.9 Countries in crisis requiring external food assistance (October 2006).[10] Fig 6.9 Countries in crisis requiring external food assistance (October 2006).[10] As a result of inadequate food production, Africa spends US$15–20 billion on food imports annually, in addition to receiving US$2 billion/year in food aid. The World Food Programme, which accounts for 40 per cent of international food aid, has spent US$12.5 billion, 45 per cent of its total investment since its establishment, in Africa. These are vast amounts of money, which could be used to revitalize agriculture through measures such as the provision of agricultural inputs and the rehabilitation of degraded land. |
Genetic modification (GM) technology has the potential to improve the yields and quality of food crops, as well as to create resistance to diseases, such as the damaging cassava virus in Western Africa. However, GM technology is controversial, since genetically modified organisms (GMOs) have not been fully tested for environmental or health effects. Many African countries have been declining GM food aid because of such concerns, despite the fact that many of them experience food shortages. The region has 810,000 km2 under GMOs[124], mainly in South Africa.
Agricultural production in many African countries is projected to be severely compromised due to climate variability and change. The area suitable for agriculture, the length of growing seasons and yield potential, particularly along the margins of semi-arid and arid areas, are expected to decrease. This would further adversely affect food security and exacerbate malnutrition in the region. In some countries, yields from rain-fed agriculture could be reduced by up to 50 per cent by 2020[125].
Environmental impacts
Land degradation threatens tropical forests, rangelands and other ecosystems. For example, the drylands of Eastern and Southern Africa are particularly vulnerable to vegetation loss, and savannahs are at a very high risk of land degradation. The impacts include loss of biodiversity, rapid loss of land cover, and depletion of water availability through destruction of catchments and aquifers. Increased siltation fills up dams, and leads to flooding in rivers and estuaries. In Sudan, for example, the total capacity of the Roseires reservoir, which generates 80 per cent of the country’s electricity, fell by 40 per cent in 30 years, due to siltation of the Blue Nile[126].
As a result of habitat loss due to land degradation, four antelope species in Lesotho and Swaziland, the blue wildebeest in Malawi, the Tssessebe in Mozambique, the blue buck from the southwestern Cape in South Africa and the kob in Tanzania are threatened with extinction. In Mauritania, an estimated 23 per cent of the mammals are at risk of extinction[127]. In Western and Central Africa, endangered timber trees and plants include the rock elm (Milicia excelsa), prickly ash bark (Zanthoxylum americanum) and African oil palm (Brucea guineensis). Endangered mammals include the chimpanzee (Pan troglodytes), Senegal hartebeest (Alcelaphus bucelaphus), elephants (Loxodanta africana) and one of the three manatee species (Trichechus senegalensis). In Eritrea alone, 22 plant species are reportedly threatened with extinction[128].
Land degradation affects important ecosystems, such as wetlands, causing loss of habitat for birds (see Box 6.6). Wetland degradation also reduces ecosystem functions, such as flood regulation. Wetland loss in Africa is significant and critical but not well documented; 90 per cent of wetlands in the Tugela Basin in South Africa have reportedly been lost, while in the Mfolozi catchment, also in South Africa, 58 per cent (502 km2) of the wetland area has been degraded. In Tunisia’s Medjerdah catchment, 84 per cent of the wetland area has vanished[129].
|
Box 6.6 Wetland conversion and the endangered wattled crane[130] |
 (Credit: BIOS Courteau Christophe (B)/Still Pictures) (Credit: BIOS Courteau Christophe (B)/Still Pictures) Degradation and loss of wetland habitats constitute the most significant threat to the endangered wattled crane, which is endemic to Africa, and ranges across 11 countries, from Ethiopia to South Africa. It is the most wetland-dependent of Africa’s cranes, occurring in the extensive floodplain systems of Southern Africa’s large river basins, especially the Zambezi and Okavango. Intensified agriculture, overgrazing, industrialization and other pressures on wetlands have contributed to its decline, especially in South Africa and Zimbabwe. |
Land degradation is also rampant along Africa’s 40,000 km [[coast]line][131]. Mining of sand, gravel and limestone from estuaries, beaches or the nearshore continental shelf is common in Africa’s coastal states and islands. Sand and gravel mining in coastal rivers and estuaries in particular tends to diminish the amount of fluvial sediment input to the coastline, accelerating shoreline retreat. Dredging of sand from the inner continental shelf is an obvious cause of beach erosion in Africa. This problem has been documented in Benin, Liberia, Sierra Leone, Cote d’Ivoire, Ghana, Nigeria, Mauritius, Tanzania, Togo, Kenya, the Seychelles and Mozambique[132]. Coastal erosion is also influenced by the modification of stream flows through river impoundments, which, in turn, cause habitat change in estuaries (See Box 6.7).
|
Box 6.7 Stream-flow modifications in the Zambezi River[133] |
|
The Zambezi River, which is the most widely shared river basin in Southern Africa, has an annual discharge of about 106 cubic kilometres. Under natural conditions, the Zambezi is torrential, with high flows during the wet season, from November to March, and relatively low flows in the dry season, from April to October. Historically, it discharged an average of 60–80 per cent of its mean annual flow during wet season months, but because of about 30 dams, including two large hydroelectric dams, the Kariba and the Cahora Bassa, the wet season run-off declined by about 40 per cent, whereas dry season run-off increased by about 60 per cent. This has changed the state of the Zambezi delta, with significant negative impacts on mangroves and associated marine resources, such as fish. The degradation of a catchment area’s environment results in the decline of springs, streams and rivers, with catastrophic consequences for human welfare and environmental integrity. |
Land degradation in coastal zones is associated with the development of coastal settlements. Coastal towns are by far the most developed of Africa’s urban areas and, by implication, the concentration of residential, industrial, commercial, agricultural, educational and military facilities in coastal zones is high. Major coastal cities include Abidjan, Accra, Alexandria, Algiers, Cape Town, Casablanca, Dakar, Dar es Salaam, Djibouti, Durban, Freetown, Lagos, Libreville, Lome, Luanda, Maputo, Mombasa, Port Louis and Tunis.
Changes in a variety of ecosystems are already being detected at a faster rate than anticipated due to climate change. This is particularly the case in Southern Africa. Climate change, interacting with human drivers such as deforestation and forest fires are a threat to Africa’s ecosystems. It is estimated that, by the 2080s, the proportion of arid and semi-arid lands in Africa is likely to increase by 5-8 per cent[134]. Climate change will also aggravate the water stress currently faced by some countries, while some that currently do not experience water stress will be at greater risk of water stress.
Conflict
Land degradation in Africa is also linked to civil conflicts, such as in the Darfur region of Sudan, where the clearing of tree cover around water points has degraded the land since 1986[135]. In Darfur, rainfall has declined steadily over the last 30 years, with negative impacts on farming communities and pastoralists. The resultant land degradation has forced many to migrate southwards, leading to conflict with farming communities where they settle[136]. In countries that recently emerged from wars, such as Angola, land mines prevent the use of land for productive purposes, such as agriculture.
Addressing land degradation
Addressing the issue of land degradation is key to helping Africa reduce poverty, and achieve some of its targets as set out under the Millennium Development Goals. Although policy shortcomings still exist, Box 6.8 lists some of the promising regional policy initiatives that address land degradation.
|
Box 6.8 Environment action plans[137] |
|
Regional policy initiatives include the NEPAD Action Plan of the Environment Initiative (EAP), which is organized in clusters, programmatic and project activities to be implemented over an initial period of 10 years. The programme areas include:
The plan builds upon related policy initiatives covering pollution, forests, plant genetic resources, wetlands, invasive alien species, coastal and marine resources, capacity building, and technology transfer. Such policy initiatives include the 1994 UN Convention to Combat Desertification (UNCCD), and the UN General Assembly’s declaration of 2006 as the International Year of Deserts and Desertification. All 53 African countries have ratified the UNCCD and are at various stages of implementing its provisions through local, national and sub-regional action plans. The UNCCD is partly successful through institution building and funding mechanisms. For example, in Southern Africa, the UNCCD is implemented through the SADC Regional Action Plan. Its implementation is supported by national and local initiatives, such as national and district environmental action plans. |
Efforts to stop land degradation include integrated crop and land management programmes that seek to provide tangible, short-term benefits to farmers, such as increased yields and reduced risks. Efforts, though localized, include water harvesting, agroforestry, and a variety of new and traditional grazing strategies. There are opportunities to expand these methods, which focus not only on increasing yields, but also on building healthy [[soil]s], maintaining crop diversity and avoiding the use of expensive chemical [[fertilizer]s] and pesticides that pollute water sources, and are a human health risk (see the sections on soil erosion and desertification in Chapter 3). These strategies are particularly adapted to ecological constraints faced by poor farmers on marginal or less favoured lands, because they address problems of soil fertility and water availability that biotechnology or more conventional means for the intensification of production cannot readily overcome[138].
NEPAD’s Comprehensive Agricultural Development Programme seeks to promote irrigated agriculture[139] through extending the area under sustainable land management and reliable water control systems. This would include rapidly increasing the area under irrigation, especially smallholder irrigation, improving rural infrastructure and trade-related capacities for markets, and increasing food supplies. All this would help in reducing hunger.
Land degradation is partly blamed on the failures of the “Western” land administration system of land title, which has often not benefited the poor. More attention is now being given to the inclusion of customary tenure in national land administration laws to protect people’s customary land rights. Innovative tools to both improve tenure security for the poor as well as to address land degradation problems include occupancy licences, customary leases and certificates. However, such tools also present problems. For example, in Zambia, registration of customary land often leads to denial of other customary rights, while in Uganda the pace of issuing certificates has been slow, with no certificates issued since 1998. In Mozambique, certificates are successfully issued, although it is unclear if the innovative tools have been fully embedded in society[140].
Asia and the Pacific
Drivers of Change
Socio-economic trends
The Asia and the Pacific region is comprised of 43 countries and a number of territories, and is, for the purposes of this report, divided into six sub-regions. It is endowed with a rich diversity of natural, social and economic resources. The length of its coastline is two-thirds of the global total, and it has the world’s largest mountain chain. The region includes some of the poorest nations in the world, several highly advanced economies, and a number of rapidly growing ones, notably China and India. From 1987 to 2007, the population increased from almost 3 billion to almost 4 billion people, and the region is now home of 60 per cent of the world’s people[141], representing a wide range of different ethnicities, cultures and languages.
In most nations, central governments have played a key role in economic planning to achieve development goals, and have been instrumental in formulating environmental policies. For the region as a whole, GDP (purchasing power parity, in constant 2000 US dollars) increased from US$7.5 trillion in 1987 to US$18.8 trillion in 2004[142].
|
Box 6.9 Progress towards the Millennium Development Goals[143] |
|
Remarkable progress has been made in overall poverty reduction in this region. Between 1990 and 2001, the number of people living on less than US$1/day dropped by nearly 250 million. Sustained growth in China and the acceleration of India’s economy contributed to such progress. Efforts at reducing malnutrition, however, have been less successful. The most severe problems are evident in South Asia, where nearly half the children five years old and under are malnourished. The region has also made progress towards MDG 7 on the environment. Environmental protection is considered to be a fundamental element in achieving several [[MDG]s], and is a powerful engine for economic growth and poverty eradication. South Asia made the most impressive achievements in providing safe sources of drinking water, and India contributed substantially to the positive trend. Another encouraging sign is the significant progress in improving energy efficiency, and in providing access to clean technology and fuels in eastern and southern Asia. However, energy efficiency continues to decline in South East Asia. |
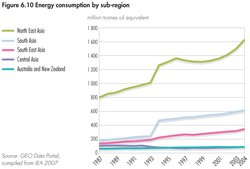 Fig 6.10 Energy consumption by sub-region.[11]
 Many countries have made considerable progress towards attaining the [[Millennium Development Goals] (MDGs)], although achievements are marked by wide disparities and stark contrasts (see Box 6.9). Since several countries have already achieved many of the MDG targets, they have raised their targets, setting new goals, called MDG Plus.
Since 2000, Asia and the Pacific’s GDP growth has surpassed the 5 per cent rate suggested by the Brundtland Commission in 1987[144], but ecosystems and human health continue to deteriorate. Population increases and fast economic development have driven significant environmental degradation and natural capital losses during the last two decades. In turn, deteriorating environmental conditions are threatening and diminishing the quality of life for millions of people.
 Fig 6.11 Total carbon dioxide emissions.[12]
 Rapid population growth, fast economic development and urbanization have led to increased energy needs. Between 1987 and 2004 energy use in this region increased by 88 per cent, compared to a global average rise of 36 per cent[145]. Presently, Asia and the Pacific is responsible for only about 34 per cent of total global energy consumption, and per capita energy consumption is much lower than the world average (see Chapter 2). There are strong signs that regional energy demands will continue to increase[146] (see Figure 6.10). Asia and the Pacific’s share of global CO2 emissions increased from 31 per cent 1990 to 36 per cent in 2003, with considerable variation within the region (see Figure 6.11). These energy and related CO2 emission trends are part of a pattern of global increases that are contributing to climate change (see [[Chapter2 (Global Environment Outlook (GEO-4): Chapter 6)]2]).
|
Box 6.10 Water pollution and human health in South Asia and South East Asia[147] |
|
High natural concentrations of arsenic and fluoride in water have resulted in acute health problems in parts of India and Bangladesh. More than 7,000 wells in West Bengal have high levels of dissolved arsenic, reaching over 50 mg/litre, five times the WHO guideline. Water-borne diseases are associated with degraded water quality, and in developing countries they cause 80 per cent of all illnesses. With two-thirds of the South Asian population lacking adequate sanitation, water-borne diseases are prevalent, including diarrhoea, which kills 500,000 children each year. There have been attempts to reform the water and sanitation sector in South Asia and South East Asia, including large-scale subsidization of water for the poor. For example, under its National Growth and Poverty Eradication Strategy (NGPES), Laos is developing the infrastructure to ensure greater access to safe water and sanitation, especially for the rural population. Singapore is recycling wastewater, bringing it up to drinking quality standards by using a new filtration technology. |
Environmental governance
These problems are not new, although many are intractable, and some are getting worse. Most countries in Asia and the Pacific have developed extensive domestic laws, regulations and standards related to the environment, and participate in global action through multilateral and bilateral agreements. However, the implementation of laws and agreements has been hampered by a wide variety of factors. They include: inadequate implementation, enforcement and monitoring; a lack of capacity, expertise, know-how and coordination among different government agencies; and insufficient public participation, environmental awareness and education. Most importantly, the lack of integration of environmental and economic policies has been the major constraint in establishing an effective system of environmental management. All of these factors undermine efforts to alleviate pressure on environmental quality and ecosystem health.
Furthermore, the region is highly vulnerable to natural hazards. Notable examples include the 2004 Indian Ocean Tsunami and the 2005 earthquake in Pakistan. Evidence exists of significant increases in the intensity and/or frequency of extreme weather events, such as heat waves, tropical cyclones, prolonged dry spells, intense rainfall, tornadoes, snow avalanches, thunderstorms and severe dust storms since the 1990s[148]. Impacts of such disasters range from hunger and susceptibility to disease, to loss of income and livelihoods, affecting the survival and human wellbeing of both present and future generations.
Clearly, the region still faces some formidable environmental governance challenges to protect valuable natural resources and the environment while alleviating poverty and improving living standards with limited natural resources.
Selected Issues
 Fig 6.12 Trend in use of passenger cars.[13]
 Increases in consumption (Consumer society) and associated waste have contributed to the exponential growth in existing environmental problems, including deteriorating water and air quality. Land and ecosystems are being degraded, threatening to undermine food security. Climate change is likely to affect the region with thermal stress, and more severe droughts and floods, as well as soil degradation, coastal inundation and salt water intrusion due to sea-level rise[149]. Agricultural productivity is likely to decline substantially, due to projected warmer temperatures and shifts in rainfall patterns in most countries. Major trends and responses are described for five such environmental issues that are key priorities in the region: transport and urban air quality, freshwater stress, valuable ecosystems, agricultural land use and waste management.
Transport and Urban Air Quality
Air pollution
The growing energy needs and the associated increase in resource mixes and fuel types have resulted in the intensification of urban air pollution and the serious degradation of air quality in many Asian cities. This has been further complicated by the region’s relatively poor energy intensity and fuel efficiency. Increased energy consumption has also led to a rise in greenhouse gas emissions, contributing to climate change (see Box 6.11 and Figure 6.11), which has major impacts on ecosystems and human well-being.
|
Box 6.11 Climate change and its potential impacts |
|
A progressive and accelerated long-term warming trend has been reported for Asia for the period 1860–2004. Australia is suffering severe drought in recent years and had its warmest year on record, as well as its hottest April, in 2005. Both ecosystems and human well-being are very vulnerable to climate change. Coasts and rapidly growing coastal settlements and infrastructure in countries such as Bangladesh, China, India, Myanmar and Thailand are at risk from any increase in coastal flooding and erosion due to sea-level rise and meteorological changes. South Pacific island states are extremely vulnerable to global climate change and global sea-level rise. In a number of islands, vital infrastructure and major concentrations of settlements are very likely to be at risk. In some extreme cases, migration and resettlement outside national boundaries might have to be considered. In addition, climate change is projected to exacerbate health problems, such as heat-related illness, cholera, dengue fever and biotoxin poisoning, placing additional stress on the already overextended health systems of most small island states (see [[Chapter2 (Global Environment Outlook (GEO-4): Chapter 6)]3]).  Boy runs to catch the school boat in Pramukha island of Kepulaun Seribou (thousand islands) north of Jakarta, Indonesia. (Credit: Greenpeace/Shailendra Yashwant) Boy runs to catch the school boat in Pramukha island of Kepulaun Seribou (thousand islands) north of Jakarta, Indonesia. (Credit: Greenpeace/Shailendra Yashwant)  Children play at the wooden quay of Panggang island of Kepulaun Seribou. It is believed that about 2,000 islands are threatened with coastal flooding in this archipelagic nationa due to climate change-induced sea level rise. (Credit: Greenpeace/Shailendra Yashwant) Children play at the wooden quay of Panggang island of Kepulaun Seribou. It is believed that about 2,000 islands are threatened with coastal flooding in this archipelagic nationa due to climate change-induced sea level rise. (Credit: Greenpeace/Shailendra Yashwant) |
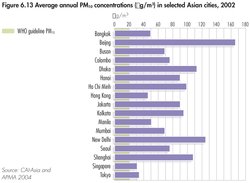 Fig 6.13 Average annual PM10 concentrations in selected Asian cities, 2002.[14]
 The exploding growth in motorized vehicles (see Figure 6.12) is the key factor in both traffic congestion and the levels of urban air pollution in many cities. Between 1987 and 2003, the use of passenger cars has increased about 2.5 times[150]. During the 1990s, the number of cars and two-wheeled motorcycles in China and India rose by more than 10 per cent/year[151]. China had some 27.5 million passenger cars and 79 million motorcycles in use by 2004[152]. In India, passenger car ownership nearly tripled from 2.5 per 1 000 people in 1987 to 7.2 per 1 000 people in 2002[153]. Other factors contribute to a sharp deterioration in urban air quality. There is a higher concentration of people living in large cities than in other regions. With the exception of a few cities, municipal development is poorly planned. There is a lack of affordable and clean mass transit services. In addition, there is haze pollution caused by forest fires in South East Asia.
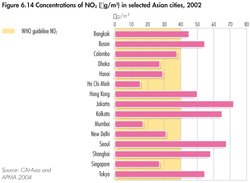 Fig 6.14 Concentrations of NO2 in selected Asian cities, 2002.[15]
 The most common urban air pollutants are nitrogen oxides, sulphur dioxide, particulate matter, lead and ozone. Levels of PM10 (particulate matter less than 10? in diameter) remain high in many Asian cities, far exceeding standards prescribed by the World Health Organization (see Figure 6.13) (see Chapter 2). In particular, South Asian cities continue to record the highest levels of outdoor particulate pollution worldwide[154]. While there are indications that the concentrations of sulphur dioxide in selected Asian cities have declined in recent years, large and growing motor vehicle fleets in mega-cities continue to contribute to high nitrogen dioxide levels (see Figure 6.14). Recent assessments suggest that outdoor and indoor urban air pollution, especially from particulates, has considerable impacts on public health. A WHO study estimates that more than 1 billion people in Asian countries are exposed to outdoor air pollutant levels exceeding WHO guidelines[155], and this causes the premature death of about 500,000 people annually in Asia[156]. The region has the world’s highest burden of disease attributable to indoor air pollution (see Chapter 2). In addition, air pollution leads to substantial financial and economic costs to households, industry and governments in Asia. Limited studies have been done, but some show the health and economic costs of particulates (PM10) in selected cities and groups of cities in Asia (see Table 6.3).
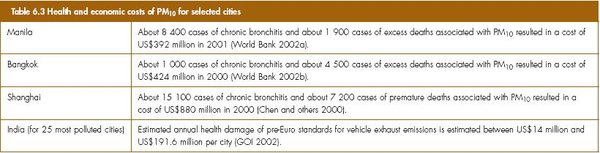 Table 6.3 Health and economic costs of PM10 for selected cities.
 Addressing urban air pollution
Most countries in Asia and the Pacific have established a legislative and policy framework to address air pollution, and there are a number of institutional arrangements at national and city levels. Most countries have phased out leaded fuels[157]. Many cities, including Bangkok, Beijing, Jakarta, Manila, New Delhi and Singapore, are noteworthy for their recent implementation of such actions. To address haze pollution, members of the Association of Southeast Asian Nations (ASEAN) agreed to a regional plan of action, and created a Haze Fund to implement the ASEAN Agreement on Transboundary Haze Pollution[158]. Monitoring air pollutants is a key tool for informed policy making, regulation and enforcement, and for assessing impacts, but only some cities conduct regular monitoring. The region needs to accelerate the switch from fossil fuels to cleaner and renewable forms of energy. It also needs to promote a reduction in private vehicle use, as well as drastically improve the efficiency and availability of mass transit systems, with approaches such as those envisaged under the Regional Environmentally Sustainable Transport (EST) Forum, launched in 2005 in the North East and South East Asian sub-regions[159]. Sustainable city planning is another long-term measure that should be undertaken.
Freshwater Stress
Water quantity and quality
Of all freshwater-related issues, adequate water supply is the major challenge to all the Asia and the Pacific nations. The region has 32 per cent of the world’s [[freshwater (Freshwater biomes)] resources][160], but is home to about 58 per cent of the world population. The South Pacific (along with many African countries) has the lowest per capita freshwater availability in the world.
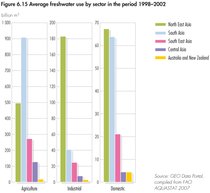 Fig 6.15 Average freshwater use by sector in the period 1998-2002.[16]
 Since Asian economies depend heavily on agriculture and irrigation, agriculture puts the greatest demands on water resources (see Figure 6.15). Excessive withdrawals from surface waters and underground aquifers, pollution of freshwater resources by industrial sectors, and inefficient use of freshwater are major causes of water stress[161]. Climate change has the potential to exacerbate water resource stress in many countries of Asia and the Pacific[162]. There are reports of unprecedented glacier retreats in the Himalayan Highlands over the past decade[163]. Furthermore, climatic variability and natural disasters have threatened watershed quality in recent years, causing damage to sanitation facilities and the contamination of groundwater[164] (see [[Chapter4 (Global Environment Outlook (GEO-4): Chapter 6)]2]).
Human activities, such as land-use change, water storage, interbasin transfers, and irrigation and drainage, influence the hydrological cycle in many river basins (see Chapter 4)[165]. Changes in recent years in continuity and withdrawal patterns in the summer monsoon have led to considerable spatial and temporal variations in rainwater availability[166]. Southwest Bangladesh suffers from extreme water shortages as well as acute moisture stress during the dry months, adversely affecting both ecological functions and agricultural production. Floods during the monsoon season inundate an average of 20.5 per cent of Bangladesh, and can flood as much as 70 per cent of the country during an extreme flood event[167]. Furthermore, the influx of saline water is a major hazard in South Asia and South East Asia, and in the atoll islands of the Pacific.
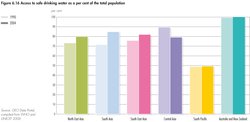 Fig 6.16 Access to safe drinking water as a percent of the total population.[17]
 Although remarkable progress in the provision of improved drinking water has been made over the last decade (see Figure 6.16), especially in South Asia, some 655 million people in the entire region (or 17.6 per cent) still lack access to safe water[168]. While South Pacific states have not made any progress, conditions in Central Asian countries actually deteriorated. In many mega-cities, up to 70 per cent of citizens live in slums, and generally lack access to improved water and sanitation.
Water pollution and inadequate access to improved drinking water are severe threats to human wellbeing and ecological health. The expansion of agriculture, with increased use of agrochemicals, will cause more serious water pollution, as chemicals get into rivers and coastal waters. An increase in the volume of domestic wastewater is also degrading water quality in urban areas. Although discharges of organic water pollutants have declined in a number of Asian countries in recent years[169], the cumulative amount of discharges is greater than natural recovery capacity, and this continues to degrade water quality. Human health is threatened by unsafe water (see Box 6.10).
Balancing freshwater supply and quality with increasing demand
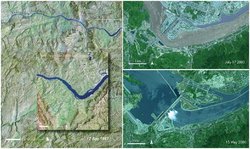 The Three Gorges Dam in China: the 1987 image on the left shows the river and surrounding landscape (overview and detail) before the dam was constructed; the 2000 image (top right) shows the dam under construction and in the 2006 image (bottom right) the dam is operational. (Credit: Landsat and ASTER images from NASA/USGS compiled by UNEP/GRID–Sioux Falls)
 Nations in the region are taking numerous steps to address the high demand for safe water. North East Asia relies on command-and-control policies, specifically the "polluter-pays-principle,” to target individual polluting sources. These measures have achieved significant water quality improvements. They now show diminishing returns, however, due to continued population growth and rapid urbanization. China introduced a series of policy measures promoting small-scale projects, and invested more than US$2.5 billion between 2000 and 2004, increasing the number of people with access to safe drinking water by 60 million[170]. The Three Gorges Dam in China is expected to provide a source of water, renewable energy (annual generation of electricity up to some 85 billion kWh) and flood control (upgrading the flood control standard from 10-year floods to 100-year floods), but is also expected to have social and environmental impacts such as loss of livelihoods in areas that will be submerged and loss of some biodiversity and ecosystem functioning. The scale and magnitude of these impacts, however, will have to be further investigated[171]. Mongolia and China adopted demand side management and watershed management policies to complement existing supply side management. Efforts are also underway in some Central Asian countries to use water and wastewater more efficiently, especially in agriculture.
Improvements in water use efficiency, especially in the irrigation sector, will have immediate positive impacts on water availability. Cooperation among governments, industries and public utility services would lead to a better appreciation for the need to use market-based instruments (MBIs) to lower some of the implementation costs in designing and applying such changes.
Valuable Ecosystems
Biodiversity at risk
Over the last two decades, as Asia and the Pacific has become the world’s fastest developing region, enormous pressures have been put on its ecosystems to support the ever-growing demand for natural resources and energy.
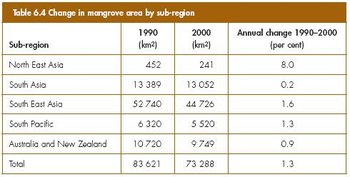 Table 6.4 Change in mangrove area by sub-region.[18]
 Coastal ecosystems, the locus of land-ocean interaction, play an important role. The region has an extremely long coastline, and more than half of its inhabitants live on or near the sea. They depend directly on coastal resources, such as mangroves and coral reefs, for part of their livelihoods[172]. Due to large-scale exploitation of natural resources, most of the inland ecosystems in Central Asia have been severely depleted. Factors that threaten biodiversity and ecosystem functions include rapid changes in land use, extensive but poorly managed irrigation, more intensive use of rangelands, medicinal and food plant collection, construction of dams and fuelwood collection.
Asia and the Pacific has about 50 per cent of the world’s remaining mangrove forests, although they have been extensively damaged or destroyed by industrial and infrastructure development (see Table 6.4)[173]. The most significant degradation of mangroves in South East Asia can be attributed to extensive coastal development. In addition, the mangroves are affected by sedimentation and pollutants from inland sources. Mangroves are vital to coastal ecosystems. They fulfil important functions in providing wood and non-wood forest products, coastal protection, habitat, spawning grounds and nutrients for a variety of fish and shellfish species. They are important for biodiversity conservation.
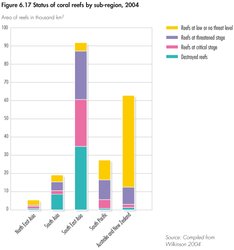 Fig 6.17 Status of coral reefs by sub-region, 2004.[19]
 Coral reefs are fragile ecosystems, sensitive to climate change, human activities, such as tourism, and natural threats and disasters. Asia and the Pacific has some 206,000 km2 of coral reefs, 72.5 per cent of the world’s total[174]. Heavy reliance on marine resources across the region has resulted in the degradation of many coral reefs, particularly those near major population centres. Moreover, higher sea surface temperatures have led to severe bleaching of the corals in coastal regions. About 60 per cent of the region’s coral reefs are estimated to be at risk, with mining and destructive fishing the greatest threats (see Figure 6.17)[175]. The ultimate impacts are habitat degradation and destruction, which threaten important and valuable species, and increase the loss of biodiversity (see Table 6.5).
The destruction and reduction of ecosystem services and functions in turn reduce their contribution to human well-being. Deforestation, for example, has caused the rapid reduction of timber production, especially of the valuable timber only found in natural forests, affecting the livelihoods of people who depend on those forests[176]. However, well conserved and managed valuable ecosystems continue to support human well-being. For example, large mangrove forests in the north and south of Phang Nga, the most tsunami-affected region in Thailand, significantly mitigated the impact of the 2004 Indian Ocean Tsunami[177].
Alleviating pressures on ecosystems
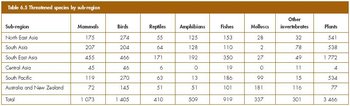 Table 6.5 Threatened species by sub-region.[20]
 The common policy response to ecosystem destruction is the establishment of protected areas. South East Asia, where coastal ecosystems are abundant, set aside 14.8 per cent of its land for protection, a higher proportion than the 2003 world average of 12 per cent. In the other Asia and the Pacific sub-regions, less than 10 per cent of their land is protected[178]. Countries cooperate in protecting marine and coastal ecosystems through four Regional Seas Action Plans: East Asian Seas, North-West Pacific, South Asian Seas and the Pacific Plan[179]. However, a recent study reveals that East Asia and South Asia discharge 89 per cent and 85 per cent respectively of their untreated wastewater directly into the sea[180]. This indicates that concrete measures are needed to achieve action plan goals.
In the South Pacific, as well as in Indonesia and the Philippines, local communities or land-owning groups, together with local governments and/or other partners, collaboratively manage 244 designated coastal areas, which include 276 smaller protected areas. Many are truly locally-managed marine areas (LMMA), a rapidly expanding approach, using traditional knowledge-based practices (see Chapters 1 and 7 (Global Environment Outlook (GEO-4): Chapter 6))[181]. The LMMA strategy offers an alternative approach to more central systems managed by formal government institutions.
Along with sound policies and legislation, the nations of Asia and the Pacific need to raise public awareness of biodiversity and ecosystem service values, and to reduce human demands on ecosystems in order to alleviate pressures on them.
Agricultural Land Use
Land quality
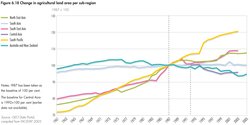 Fig 6.18 Change in agricultural land area per sub-region.[21]
 Human activities can have a negative impact on the quality of land. Poor land management can cause soil erosion, overgrazing can result in degradation of grasslands, overuse of [[fertilizer]s] and pesticides reduces soil quality, and, in some areas, landfills, industrial activities and military activities cause contamination (see [[Chapter (Global Environment Outlook (GEO-4): Chapter 6)]2]).
Agricultural land use is expanding in all countries and sub-regions, except for Australia and New Zealand, and Central Asia. In these sub-regions, agricultural land represents about 60 per cent of total land. The agricultural area in the six sub-regions of Asia and the Pacific, comparing changes over time, is illustrated in Figure 6.18.
Systematic data are lacking, but experts agree that land is being degraded in all sub-regions[182]. This degradation can have serious consequences for agriculture and ecosystem integrity, threatening food security and human well-being.
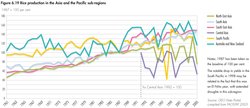 Fig 6.19 Rice production in the Asia and the Pacific sub-regions.[22]
 As food security has a very high priority in the region, land degradation is being tackled by countermeasures, such as substituting new arable land for degraded land. Although these shifts do not register in national figures of agricultural area, local people living in degraded areas feel the effect in terms of their well-being.
From the 1960s to 1987, most parts of this region achieved remarkable increases in rice production, the dominant food crop, and most sub-regions were able to prolong this trend (see Figure 6.19). Declines in fertility were more than compensated for by such factors as the use of additional [[fertilizer]s] and pesticides, increasing yields.
It appears that most countries applied sufficient countermeasures to successfully overcome the impacts of land degradation on agricultural production[183]. The five Central Asian countries are the exception, with deepening declines after the collapse of the Soviet Union in 1991. Land degradation in the form of salinization from poor irrigation practices continued, especially since energy supply was insufficient to allow for pumping to drain accumulated salty water. At the same time, the use of costly fertilizers and pesticides dropped sharply.
Towards more sustainable land management
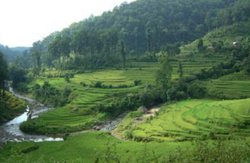 Poor land management can cause soil erosion. Terracing is one countermeasure that overcomes the impacts of land degradation. (Credit: Christian Lambrechts)
 Since agriculture is the main land use in Asia and the Pacific, land conservation as a tool of sustainable agriculture has been heavily emphasized. Sustainable agriculture can promote rural development, as well as increase food security and ecosystem vitality. Immediate responses include reforestation, redefining protected areas and using integrated approaches, such as integrated pest management, organic farming and integrated watershed management. Proper management of [[fertilizer]s] and pesticides in agricultural activities is also crucial to protecting human health. Good governance is the basic foundation of any land conservation and management strategy. Besides providing appropriate legal and policy mechanisms for administering land ownership, it can foster the active participation of civil society in land reform efforts, and ensure the equitable distribution of agrarian development benefits.
Many farmers in South Asia and South East Asia are women, but their contribution tends to go unnoticed because they lack access to resources; men are inclined to have better access to land for farming or forestry. Land management and conservation schemes should recognize and protect the rights of female participants in agriculture, and they should share the benefits[184].
Waste Management
Consumption and waste generation
The industrial model of development has driven the region’s economy into a stage of rapid growth, accompanied by increased environmental pollution. This pattern follows the general trend in early economic growth described by the environmental Kuznets Curve[185]. This development model, together with new lifestyles associated with greater affluence, has led to rapid changes in consumption patterns, the generation of large quantities of waste and changes in waste composition. These are the drivers behind exponentially growing waste management problems in Asia and the Pacific.
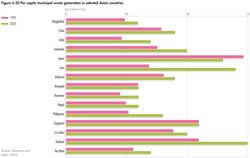 Fig 6.20 Per capita municipal waste generation in selected Asian countries.[23]
 The region currently generates 0.5–1.4 kilogrammes of municipal waste per person daily[186]. This trend shows no sign of abating, as illustrated in Figure 6.20, which extends the trend until 2025. Compostable wastes, such as vegetable and fruit peels and other leftover foodstuffs, represent 50–60 per cent of the waste stream[187].
The use of unsanitary landfills is becoming problematic, because they contaminate land and groundwater. Poor people, especially those who depend on local resources for their food supply, or who earn their livelihoods from recycling, are highly vulnerable to such impacts. The Japan Environmental Council[188] found that in the Philippines, people who collect recyclable materials from landfills frequently give birth to deformed children. The illegal traffic in electronic and hazardous waste, and the effects on human health and the environment pose new and growing challenges for Asia and the Pacific (see Box 6.12).
|
Box 6.12 Electronic waste – a growing human and environmental health hazard[189] |
|
There has been a rapid increase in the global domestic consumption of a wide range of electronic goods and advanced technologies. Often it is cheaper to buy a new product than to upgrade an old one, helping to push a 3–5 per cent annual increase in electronic waste (e-waste). More than 90 per cent of the 20–50 million tonnes of the e-waste generated every year in the world ends up in Bangladesh, China, India, Myanmar and Pakistan. Seventy per cent of e-waste collected at recycling units in New Delhi (India) was exported from or dumped by other countries. E-waste has become an important health and environmental issue. Recycling electronic goods involves exposure to dangerous metals, such as lead, mercury and cadmium, which can be toxic to humans and ecosystems if they are improperly handled or disposed of. A study of land and water contamination near dumps close to Guiyu Town in Guangdong province, southern China, and in the suburbs of New Delhi found toxic chemicals, including heavy metals, in the soil and local rivers around scrapyards where electronic waste is recycled. It is said that Asian workers are “using 19th century techniques to process 21st century wastes.” |
Although most countries in Asia and the Pacific have ratified the Basel Convention on the Control of Transboundary Movements of Hazardous Wastes and their Disposal, the region as a whole lacks a common approach to the import of hazardous wastes.
Sustainable waste management
Recently, several countries have initiated a variety of policy responses to address the growing waste problem. For example, Dhaka has been implementing community-based solid waste management and composting projects. They benefit the municipality by saving transport and collection costs, and reducing the amount of land needed for landfills. They also contribute to progress in achieving some [[Millennium Development Goals] (MDGs)], including reducing poverty, as well as unemployment, pollution, soil degradation, hunger and illness[190]. The proper reuse and recycling of waste (its collection, sorting and processing) is labour intensive, and can provide employment for the poor and unskilled. Substantial numbers of people in developing countries earn their living through well-organized systems of waste collection, such as rag picking and recycling. In India alone, more than 1 million people find livelihood opportunities dealing with waste[191]. Although there are examples of policies and strategies to tackle waste problems, effective waste management strategies and systems are still lacking or inadequate in many countries, posing a serious threat to human health and the environmental.
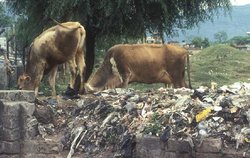 Effective waste management strategies are lacking or are inadequate in many countries. (Credit: Ngoma Photos)
 Many countries are starting to implement cleaner production policies and practices. Market-based tools, such as eco-labelling, have gained ground in the Philippines, Thailand, Singapore and Indonesia. For example, in cooperation with the government, business and other stakeholders, the Thailand Business Council for Sustainable Development launched its Green Label project in 1994. By August 2006, 31 companies had submitted applications to use the label for 148 brands or models in 39 product categories[192]. The Thai Green Label, recognized by both companies and environmentally aware consumers, is gradually becoming a trademark for environmentally friendly products[193].
Several countries, such as Japan and South Korea, are adopting the “reduce, reuse and recycle” (3R) approach (see Chapter10 (Global Environment Outlook (GEO-4): Chapter 6)), and governments are integrating policies aimed at more efficient natural resource use into their agendas. The goal is to move towards a Sound Material-Cycle Society, characterized by preventing waste generation in the first place through lower input of natural resources, smarter product design, more efficient manufacturing and more sustainable consumption. It also involves reuse, recycling and proper treatment of materials that would otherwise enter the waste stream. In the Pacific, Fiji introduced in 2007 new measures to integrate air pollution, and solid and liquid waste management into a National Waste Management Strategy. Some countries lag behind. Mongolia has not developed comprehensive waste management laws, and South Asian countries have not yet instituted policy measures to promote more sustainable consumption.
Europe
Drivers of Change
Socio-economic and consumption trends
The past two decades have seen substantial changes across the European Region. Within this broader region, the European Union (EU) has gradually expanded to include 27 countries, while 32 European countries now participate in the activities of the European Environment Agency (EEA) and its information network, Eionet (see Box 6.13).
|
Box 6.13 Country groupings for Europe often referred to in this chapter |
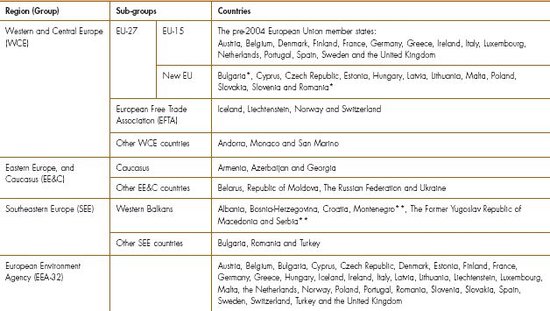 * Bulgaria and Romania joined the EU on 1 January 2007; data are not always integrated yet. In such cases the text refers to EU-25. * Bulgaria and Romania joined the EU on 1 January 2007; data are not always integrated yet. In such cases the text refers to EU-25. ** Montenegro and Serbia were proclaimed independent republics on 3 and 5 June 2006, respectively: data are still shown for Serbia and Montenegro together. The European Region comprises the countries of Eastern, Central and Western Europe. The country groupings in this report are different from the divisions used in earlier GEO reports, to better describe groupings based on various socio-political characteristics (for a full list of countries in the European Region, refer to the introductory section of this report). Even though Central Asia is also considered as part of the wider European region, its environmental issues are analysed under the Asia and the Pacific region to avoid overlap. |
About 830 million people (less than one-sixth of the world’s population) live in the European Region, of which over half (489 million) live in the EU-27[194]. The diversity of the European Region can be seen in the various countries’ socio-economic systems, environmental governance and the priority given to environmental issues on their policy agendas. The nature of environmental challenges in Europe has been changing. While industrial pollution is still a major problem in many non-EU countries, environmental problems now also include more complex problems related to lifestyle issues.
Rising standards of wealth (leading to rising consumption of energy, transport and consumer goods) and growing numbers of households are driving greenhouse gas emissions from human activities (see Figure 6.22). A reliable and affordable energy supply and an effective transport system are preconditions for economic growth, but are also major sources of greenhouse gas emissions, and other environmental pressures.
Environmental governance: an evolution of ideas
At the time of the report of the Brundtland Commission in 1987, the region was just waking up to the potential transnational consequences of its industrial activities. Today, Europe, particularly the European Union, recognizes responsibility for its contribution to global environmental problems. The European region, and the EU consumer society in particular, leave an “ecological footprint” on other parts of the world. Shrinking the footprint, and tackling environmental issues will, at least in the case of the European Union, require managing and stabilizing demand, as rising consumption (Consumer society) may offset even the best technological and efficiency improvements.
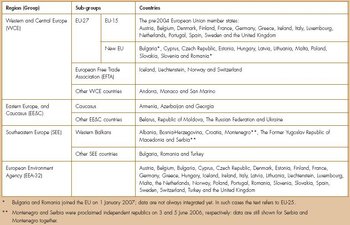 Country groupings for Europe often referred to in this chapter.
 The Brundtland Commission report, Our Common Future, was a milestone in integrating the objectives of sustainable and equitable environmental development into the heart of European policy. In the two decades since then, substantial progress in environmental protection has been achieved across Europe, especially in the EU member states.
The Brundtland messages resonated in a Europe scarred by two serious environmental accidents during the previous year. An incident at the Chernobyl nuclear power plant in Ukraine led to radioactive fallout in many parts of Europe, and the Sandoz chemical fire in Basel sent toxic materials into the Rhine. Both of these industrial accidents led to severe, transnational, long-term human and environmental repercussions, some of which are still felt today. The accidents perhaps helped to set the scene for the broad acceptance of the Brundtland Commission report, by focusing public attention on the need for increased international action and cooperation to protect human life, and to safeguard the environment for future generations.
The European Union is developing as a global leader in environmental governance, and the whole European region has a unique experience of environmental cooperation, with its many action plans and legal instruments acting at a variety of levels. The prospect of EU accession has been, and remains, the main driver of change in environmental policy in the candidate and pre-candidate countries. The focus of EU environmental policy moved from the use of remedial measures in the 1970s to end-of-pipe pollution reduction solutions in the 1980s, then to integrated pollution prevention and control, using best available techniques, in the 1990s. Today, policies are moving beyond these technical solutions to also address the patterns and drivers of unsustainable demand and consumption (Consumer society), and towards an integrated approach of the issues focusing on prevention. Policy changes in the New EU countries are following a similar broad sequence, but they have some opportunities for “leapfrogging,” based on EU experience, which should result in cost savings and improved effectiveness.
There are many opportunities for further improving cooperation at all levels in Europe, for example, in establishing sustainable systems of energy, transport and agriculture. Air quality is an area where environmental policy has been effective, but where much still needs to be done. Some issues faced by the European Union in the 1980s are now, more than 20 years later, being tackled in Eastern Europe. More could be done to maximize the learning experience from the Western European countries, and to disseminate it elsewhere.
To complement its relatively good domestic environmental progress, Europe also has responsibility for sustainable resource management outside its borders. This is the next step towards the equitable and sustainable environmental future envisaged by the Brundtland Commission in 1987.
Selected Issues
Despite much progress, poor water and urban air quality still cause substantial problems in parts of the European region, affecting the health and quality of life of many people. Emissions of air pollutants are largely driven by the demand for greater mobility. Water pollution and scarcity problems are caused by the impacts of industrial and agricultural activities, poor management of water as a resource, and the disposal of sewage wastes, all also threatening biodiversity. Changing climatic conditions further compound these issues.
Climate Change and Energy
The climate on Earth is changing, and in Europe the average temperature has increased by about 1.4°C compared to pre-industrial levels. Annual mean deviations in Europe tend to be larger than global deviations (see Figure 6.21 and Figure 2.18). In the Arctic regions of Russia, it has increased by up to 3°C over the past 90 years[195]. The European mean temperature is projected to increase by 2.1–4.4°C by 2080. Sea levels are rising and glacier melting is accelerating; during the 20th century the global mean sea-level rise was 1.7 mm/year and is projected to rise by 0.18– 0.59 metres by 2100[196].
Energy emission and efficiency trends
Since 1987, greenhouse gas emissions from the energy sector have been reduced in Western Europe, but since the end of the 1990s, these emissions have increased across the European region, partly because increasing natural gas prices have re-established coal as a key fuel (see Figure 6.22). While energy use grew at a slightly lower pace than economic activity over the past 15 years, Europe as a whole has not succeeded in stabilizing its energy consumption levels. There is a clear energy efficiency gap between the EU- 15 and the New EU, due to both technological and structural issues (see Box 6.14).
|
Box 6.14 Energy efficiency and industrial restructuring in Central and Eastern Europe[197] |
|
Energy intensity in non-OECD Europe is expected to decline at an annual rate of 2.5 per cent between 2003 and 2030. The energy efficiency gap between Eastern and Western Europe is due to both technological and structural aspects, with the latter playing a more crucial role than is often acknowledged. Energy-intensive industries make up an increasing share of the industrial fabric in Eastern Europe, while the reverse is true for Western Europe. Sector-specific statistics show that the energy efficiency of energy-intensive industries in Western Europe has not improved dramatically over the past few years. |
Emissions for the New EU are projected to remain well below their 1990 levels, even allowing for a doubling of economic output. This is not so for Israel, which has no obligations under the Kyoto Protocol, but forecasts significant increases compared to its 1996 levels. Current trends and prospects for the EU-15 are worrying. With existing domestic policies and measures, total EU-15 greenhouse gas emissions will only be 0.6 per cent below base year levels in 2010. Taking into account additional domestic policies and measures being planned by member states, a total EU-15 emissions reduction of 4.6 per cent is projected. This relies on the assumption that several member states will cut emissions by more than is required to meet their national targets. The projected use of Kyoto mechanisms by 10 member states will reduce emissions by 2010 by a further 2.6 per cent. Finally, the use of carbon sinks, under Articles 3.3 and 3.4 of the Kyoto Protocol, would contribute an additional 0.8 per cent[198].
Towards a more sustainable energy system
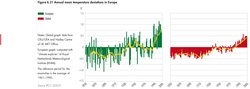 Fig 6.21 Annual mean temperature deviations in Europe.[24]
 A number of pan-regional plans have been initiated to develop common energy policy objectives, promote more sustainable energy production and consumption, and ensure stability of supply. For example, in November 2006, the European Union and the countries of the Black Sea and Caspian Sea regions agreed on a common energy strategy, based on four areas: converging energy markets, enhancing energy security, supporting sustainable energy development, and attracting investment for common projects[199]. In March 2007, the European Union agreed on an integrated climate change and energy action plan[200], based on a comprehensive package of proposals from the European Commission[201]. Figure 6.23 illustrates some of the impacts of CO2 reduction initiatives. The charts show the estimated contributions of various factors that have affected emissions from public electricity and heat production.
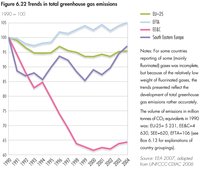 Fig 6.22 Trends in total greenhouse gas emissions.[25]
 The capital investment needed to meet forecast energy growth is an important incentive for energy savings and energy efficiency measures, as well as for changes in fuel mixes. There is a particular need for investment in energy infrastructure in some Southeastern European countries. Harnessing renewable energy sources would also make a major contribution to a more sustainable energy system[202]. In this respect, the use of the Clean Development Mechanism may offer win-win situations by helping industrialized countries to meet their Kyoto targets, and simultaneously offering investment in new technologies for developing countries.
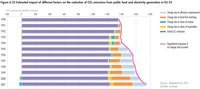 Fig 6.23 Estimated impact of different factors on the reduction of carbon dioxide emissions from public hear and electricity generation in EU-25.[26]
 The Kyoto targets are only a first step towards the more substantial global emission reductions that will be needed to reach the long-term objective of the UN Framework Convention on Climate Change (UNFCCC). No agreement has yet been reached on new UNFCCC targets for industrialized countries, or on possible new emission reduction strategies for other countries. Growing public awareness, underpinned by rising energy prices, has given a new political momentum to climate change policies in Europe. This has been stimulated by extreme weather conditions, although those are not necessarily a consequence of climate change. To limit the impacts of climate change to a manageable level, the European Union has proposed that the global temperature should not exceed an average of 2°C above pre-industrial temperatures. To achieve this target, worldwide greenhouse gas emissions will need to peak before 2025, and by 2050 they should fall by up to 50 per cent, compared to 1990 levels. This implies emission reductions of 60–80 per cent by 2050 in developed countries. If developing countries accept emissions reduction commitments, they will need to significantly reduce their emissions[203].
Sustainable Consumption and Production
Unsustainable resource use
European consumption and production contribute to the high (and often unsustainable) use of resources, increasing environmental degradation, depletion of natural resources and growing amounts of waste inside as well as outside Europe. The wealthier the society, the more resources it tends to use and the more waste it generates. Household consumption expenditure is steadily increasing throughout Europe (see Figure 6.24), with Western European households having some of the highest consumption levels in the world. At the same time, patterns of consumption are changing, with the food component decreasing and the shares for transport, communication, housing, recreation and health on the rise.
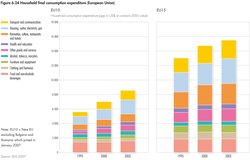 Fig 6.24 Household final consumption expenditure (European Union).[27]
 The goods-and-services that cause the highest environmental impacts through their life cycles have been identified as housing, food and mobility[204]. The dominant stage with respect to impacts differs significantly between different goods-and-services. For food and beverages, the majority of environmental impacts are related to agricultural or industrial production activities, while for personal transport the majority of the impacts are in the use phase, when driving the car or flying in an airplane.
Decoupling resource use from economic growth
The European Union has made important progress in decoupling resource use from economic growth, as has the wider European region, albeit at a slower pace (see Box 6.15). However, absolute reduction in resource use has not been achieved. Improvements have also been made in eco-efficiency, but attempts to change consumption patterns have had limited success. Over the past four decades productivity in the use of raw materials and energy has increased by 100 per cent and 20 per cent respectively, but there is still much room for improvement in how Europeans use energy and resources.
|
Box 6.15 Sustainable Consumption and Production (SCP) and the environmental policy agenda[205] |
|
The United Nations Conference on Environment and Development (UNCED), Rio de Janeiro, BrazilUN Conference on Environment and Development (UNCED) in Rio de Janeiro in 1992 highlighted the problem of unsustainable consumption. Ten years later, the World Summit on Sustainable Development (WSSD) in Johannesburg resulted in the agreement to develop “a framework of programmes on sustainable consumption and production.” The global Marrakech process on sustainable consumption and production, including its seven task forces led by countries, was established after the Johannesburg summit, and aims to prepare a framework of programmes for the UN Commission on Sustainable Development (CSD) in 2010–2011. In the European region, sustainable consumption and production, decoupling of environmental impacts from economic growth, increasing eco-efficiency, and sustainable management of resources are now increasingly visible on the policy agenda. The EU thematic strategies on sustainable use of natural resources, and on prevention and File:Recycling of waste, and the renewed EU Sustainable Development Strategy specifically refer to tackling unsustainable consumption and production. An EU Action Plan on Sustainable Consumption and Production is being prepared by the Commission. National strategies related to sustainable consumption and production have been prepared in, for example, the Czech Republic, Finland, Sweden and the United Kingdom. In some regions of Europe, including in the EE&C and the Balkan countries, work on those issues remains at an early stage. |
In the new EU member states, a number of factors have contributed to stabilization or even a decrease in use of natural resources over the past few years[206]. They include changes in the structure of the economy and production, particularly a reduction in the level of industrial production and agricultural intensity, together with the modernization of technologies and improvements in efficiency. In Western Europe, achieving an absolute decoupling of environmental impacts, material use and waste generation from economic growth remains a challenge.
Products are being redesigned to meet this challenge, but it remains to be seen if this will eventually lead to absolute decoupling. Voluntary measures have also been introduced to stimulate sustainable production and consumption, including eco-labelling, corporate social responsibility, the European Union’s Eco-Management and Audit Scheme (EMAS) and voluntary agreements with various industries.
Nevertheless, increasing consumption and production, coupled with a lack of prevention, often outstrip efficiency gains (see Box 6.16). To make consumption and production patterns more sustainable, economic instruments that reflect the real environmental and social costs of materials and energy are needed, and should be combined with legal instruments, information-based and other instruments.
|
Box 6.16 Rising transport demand outstrips technical improvements[207] |
|
Catalytic converters, required since 1993, contribute to improved air quality in Western Europe (EEA 2006c), but the gains have been partly offset by increased road traffic, and higher numbers of diesel cars. In Central and Eastern Europe, the public transport systems have been deteriorating since the early 1990s, and car ownership has risen (see Figure 6.26). In Western and Central Europe, car ownership in 2003 ranged from 252 per 1000 people (Slovakia) to 641 (Luxembourg). The number for Belarus is from 1998, and assuming that continued growth since then would put that country’s car ownership at Russian levels. The number for Armenia is from 1997, and its fleet size was stable between 1993 and 1997. In Central and Eastern Europe, total emissions from vehicles are lower than those in Western and Central Europe, but emissions per vehicle are much higher because of the poorer quality of roads and vehicles, and the lack of effective traffic management, which contribute to higher fuel consumption. In addition, there is poorer quality fuel in some parts of Central and Eastern Europe. In Western and Central Europe, road freight transport continues to grow faster than the economy, driven by EU expansion and the growing internationalization of markets. In Central and Eastern Europe, freight transport has been increasing since the early 1990s. In addition, ebusiness and the comparatively low costs of road transport – resulting from the lack of liability for costs to infrastructure and environmental externalities – are changing the freight sector through processes such as outsourcing, low-storage production, decentralized distribution and “just in time” delivery. |
While for Western Europe the challenge is to achieve decoupling, in some sub-regions of Europe, lack of efficient waste collection and safe disposal remains a major problem, as it causes contamination of land and groundwater[208]. Some EE&C countries face yet another threat – accumulated hazardous waste generated during the Soviet era. It includes mainly radioactive, military and mining wastes, but there are also large stockpiles of obsolete pesticides containing persistent organic pollutants (POPs). The lack of funds for proper disposal makes them a large risk to the environment[209].
Air Quality and Transport
Air pollutants
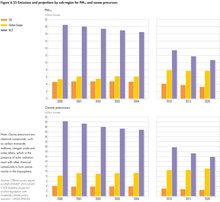 Fig 6.25 Emissions and projections by sub-region for PM10 and ozone precursors.[28]
 Despite progress in reducing emissions, air pollution still poses risks for both human health and the environment. The main public health impact is caused by small airborne particles (particulate matter), their toxic constituents, such as heavy metals and polyaromatic hydrocarbons, as well as by tropospheric ozone. Growth in the number of motor vehicles, along with emissions from industry, power production and households all contribute to air pollution (see Box 6.16).
Emissions of air pollutants in Western Europe have declined by 2 per cent/year since 2000, as a result of the effective implementation of EU air quality policies, a trend that is expected to continue to 2020 (see Figure 6.25). In Southeastern Europe, emissions stabilized between 2000 and 2004, and reductions of some 25 per cent are expected by about 2020. In Eastern Europe, economic recovery since 1999 has led to a 10 per cent increase in air emissions, and projections to 2020 are for further emission increases, except for sulphur dioxide[210]. Stronger efforts will be needed to achieve safer levels of air quality. In Western Europe and Southeastern Europe, the expected reduction in emissions will reduce impacts on public health and ecosystems significantly by 2020, but not enough to reach safe levels.
In the year 2000, exposure to particulate matter was estimated to reduce average statistical life expectancy by approximately nine months in the EU-25. This is comparable to the impacts of traffic accidents[211].
Sulphur deposition, the main acidifying factor, has fallen over the past 20 years[212]. In 2000, acidifying deposition was still above critical loads in parts of Western Europe, but the percentage of EU-25 forest areas affected is projected to decrease from 23 per cent in 2000 to 13 per cent in 2020. Ammonia is projected to be the dominant source of acidification in the future.
Reducing air pollution
Between 1990 and 2004, there has been progress in reducing air pollution. Most of the reductions of particulates came from the energy supply sector and industry, and emissions are expected to decrease further as cleaner vehicle engine technologies are adopted, and stationary fuel combustion emissions are controlled through abatement or use of low-sulphur fuels, such as natural gas or unleaded gasoline (see Box 6.17). From 1993 through 2007, the European Union has been imposing progressively stricter pollution controls on vehicles. This has controlled such pollutants as CO, HC, NOx and PM10, using technologies such as catalytic converters and better engine controls. A Euro 5 norm will come into place in 2009, and will further reduce the emissions of regulated pollutants.
|
Box 6.17 Lead – a success story?[213] |
|
Lead affects the intellectual development of children, even at low exposures. Reliable information on blood lead levels from many parts of Europe is lacking but studies from Bulgaria, Romania, Russia and the Former Yugoslav Republic of Macedonia (FYROM) suggest that average exposure levels in children may be high. The shift to unleaded gasoline has been clearly shown to result in decreasing blood lead levels, and a reduction in associated health risks, but in 2003, some countries surveyed in Central and Eastern Europe were still selling leaded as well as unleaded gasoline. Industrial emissions also remain important sources of lead exposure in some parts of Europe. In the FYROM, high mean blood lead levels (over 160 ?g/L) in children living near a lead and zinc smelter fell by more than half after the plant stopped its activity. |
Eastern and Southeastern Europe have their own car industries, which have not automatically adopted Western European vehicle technologies such as catalytic converters. However, the technologies are widely available in Western Europe at low cost, so the introduction of emission regulation may be a cost-effective means of reducing pollutant emissions from transport in Eastern Europe. The adoption of EURO vehicle emission norms (Table 6.6) by Russia and Ukraine, for example, would affect a majority of the population of the entire EE&C region, and an even larger share of the economy and vehicle fleet. It would also have an impact in countries that have not introduced the standards because most manufacturers would meet the new standards.
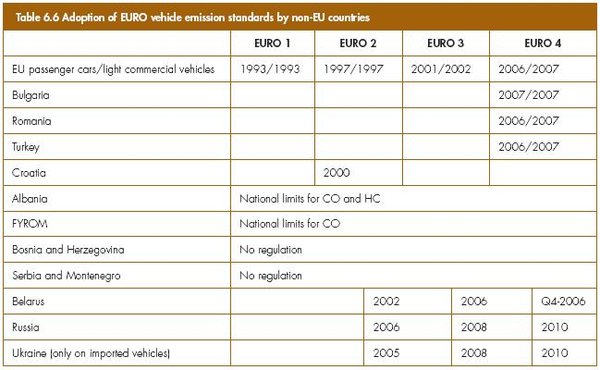 Table 6.6 Adoption of EURO vehicle emission standards by non-EU countries. (Notes: Belarus: unclear if information indicates an obligatory norm or simply availability of vehicles conforming to the norm. Russia: unconfirmed press reports indicate that introduction of norms may be delayed. The recent EURO 5 norm is not included, as non-EU countries have not yet started to implement it. Years indicate when norms are/will be introduced: passenger cars/light commercial vehicles.[29]
 These are all promising developments, but people are still exposed to levels of air pollution that exceed the air quality standards set by the European Union and the World Health Organization (WHO). In the period 1997–2004, 23–45 per cent of the urban population was still potentially exposed to ambient air concentrations of particulate matter (PM10) in excess of the EU limit value set to protect human health. There was no discernible trend over the period (see Figure 6.27). For ozone, there is considerable variation from year to year. Over the period, 20–25 per cent of the urban population was exposed to concentrations above the ozone target value. In 2003, a year with extremely high ozone concentrations due to high temperatures related to meteorological conditions[214], this increased to about 60 per cent.
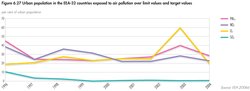 Fig 6.27 Urban population in the EEA-32 countries exposed to air pollution over limit values and target values.[30]
 The situation for NO2 is improving, but about 25 per cent of the European urban population is still potentially exposed to concentrations above the limit value. The share of urban population exposed to SO2 concentrations above the short-term limit value decreased to less than 1 per cent, and the EU limit value is close to being met.
The level of air pollution in the largest cities of Russia, Ukraine and Moldova has increased over the last years, and frequently exceeds WHO air quality standards. This increase is mainly caused by an increase in particulates, nitrogen dioxide and benzo(a)pyrene. In Russia, the number of cities with concentrations of benzo(a)pyrene over maximum allowable concentration has increased in the last five years, reaching 47 per cent in 2004.
 Table 6.7 Anticipated benefits of the EU Thematic Strategy on Air Pollution. Notes: Ecosystem benefits have not been monetized, but are expected to be significant. Ecosystem benefits for the strategy scenario have been interpolated from existing analyses.[31]
 The EU 6th Environmental Action Programme (6EAP) has the objective of achieving levels of air quality that do not give rise to significant negative impacts on and risks to human health and the environment. The Thematic Strategy on Air Pollution[215] was adopted in September 2005, and sets air quality goals in the European Union up to 2020. Table 6.7 summarizes the anticipated benefits of the strategy, compared to the 2000 situation.
Land-Use Change and Biodiversity Loss
Land-use threats
Agriculture in Europe has two trends that threaten biodiversity: intensification and abandonment. In socioeconomic terms, farming in marginal areas is under pressure, and is subject to both land abandonment and intensification[216]. Urban sprawl, infrastructure development, illegal logging and human-induced fires are other increasingly significant problems for biodiversity in the European region.
The most intensive farm systems result in highly-productive monocultures, with very low biodiversity. At the other end of the scale are the species-rich traditional farming systems that have shaped the European landscape and created habitats rich in species. They have low stocking densities, little or no chemical inputs and labour-intensive management, such as shepherding. Their ecosystems include semi-natural pastures, such as steppes, dehesas (grasslands with scattered oaks, typical of Portugal and Spain) and mountain pastures. Conservation of these habitats requires the continuation of traditional land management practices.
The agricultural sector suffers from a lack of follow-through in the liberalization process, and in the building of market institutions to support the development of competitive food markets. As a result, subsistence agriculture is now spreading in Eastern Europe. Socio-economic conditions in rural areas with small-scale farming are generally unfavourable, leading to low incomes, difficult working conditions and a lack of social services, all of which makes farming an unattractive option for young people. The result is population loss from rural areas and land abandonment. Over 200,000 km2 of arable land have already been deserted in European Russia for example, and this trend is expected to continue[217] (see Box 6.18). With such abandonment traditional management practices also disappear due to which high-nature value farmlands are degraded, for example, through encroachment when sheep and controlled winter fires no longer keep grasses short. Lack of good farm management, involving improper drainage, overgrazing and irrigation, contribute to land degradation in the form of falling organic soil carbon content, increased erosion rates, salinization, lowered productivity and vegetation loss.
|
Box 6.18 Marginalization of rural areas[218] |
|
Areas at risk of marginalization can be identified by their low profitability, and a high percentage of farmers close to retirement age. Marginalization in Western Europe occurs in parts of France, Ireland, Italy, PortugalSpain, and increased in some of these areas during the 1990s. and In many districts in the north and northeast of European Russia, more than half the crop area was abandoned during the 1990s. The severity of the climate and the depopulation rate are both key drivers of this trend. About 40 per cent of rural settlements are “dying villages,” with populations of fewer than 10. The highest rate of marginalization of rural areas occurs in Eastern Siberia and the Far East. |
Forestry in Europe is sustainable, but regional problems exist, notably illegal logging in Eastern Europe and human-induced forest fires. In recent years, the magnitude and frequency of forest fires has increased[219]. The Balkan Region, Croatia, Turkey, the FYROM and Bulgaria had a strong peak in the year 2000[220], while the summer of 2003 saw one of the most severe fire seasons in recent decades in Southeastern Europe, France and Portugal[221]. Currently, the forest area of Europe is 10.3 million km2 (79 per cent in Russia). About one-quarter is primary forest, with no clearly visible indications of human activities, 50 per cent is modified natural forest with little human influence and the rest is heavily modified.
Climate change is an overarching pressure that is expected to become the main driver of biodiversity loss in the future, affecting productivity, the growth cycle of plants and animals and species distribution[222]. Table 6.8 summarizes the main threats to biodiversity in Europe.
Managing biodiversity
The wider countryside covers a large part of the European and global terrestrial landscape, and a considerable part of biodiversity depends on the adequate management of the wider countryside. The goal for the wider countryside must be to maintain or restore robust functional ecosystems as a basis for sustainable development, securing long-term ecologically favourable conditions. Only then can the loss of biodiversity be halted and the social, economic, and cultural value for people living in and depending on the wider countryside be secured.
The EU target to halt biodiversity loss by 2010[223], is more stringent than the global-level CBD target, which aims to significantly reduce the current rate of biodiversity loss. Although much has been achieved, the target will not be reached for all ecosystems, species and habitats in Europe.
The Pan-European Ecological Network (PEEN) is a nonbinding framework that aims to enhance ecological connectivity across Europe by promoting synergy between policies, land-use planning and rural and urban development at all scales[224]. The establishment of the PEEN is supported by legal provisions and instruments under various conventions and international agreements.
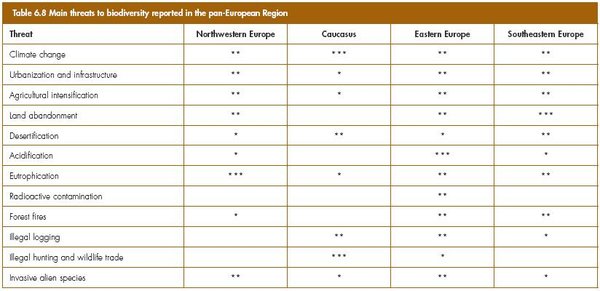 Table 6.8 Main threats to biodiversity reported in the pan-European Region. * minor threat ** moderate threat *** serious threat[32]
 The European Commission Communication on a European Biodiversity Strategy[225] calls for EU countries to reinforce coherence and connectivity of the NATURA 2000 network. It also highlights the need to restore biodiversity and ecosystem services in non-protected rural areas of the European Union. Compliance with these objectives by EU countries is key to the implementation of the PEEN. The main instrument for nature conservation is the Habitat and Birds Directives, with a network of Natura 2000 areas that covers 16 per cent of the European Union.
In 1987, the Brundtland Commission report recommended removing subsidies for intensive agriculture, and decoupling production from subsidies. In 2003, the EU Common Agricultural Policy (CAP) was reformed, with more attention given to rural development. Intensive agriculture still receives a larger share of agricultural subsidies under the CAP, but the range of agri-environment policy tools has been widened.
Agri-environmental schemes include support for the conservation of high nature-value farmland. These areas comprise the “hot spots” of biodiversity in rural areas[226]. Subsidies are also offered to farmers who comply with good agricultural practices, such as reducing erosion and nitrate leaching. New EU countries have been slow to implement some of these environmental instruments.
Freshwater Stress
Water quality and quantity
Although most people in the European region are well served, some still do not have access to improved drinking water, and even more have no access to sanitation. WHO estimates that for the European region unsafe water, sanitation and hygiene annually results in 18,000 premature deaths, 736,000 disability adjusted life years (DALYs), and the loss of 1.18 million years of life.
Generally, the population in Western Europe has continuous access to good quality drinking water. However, in the Balkan countries and some areas of Central Europe, water supplies are often intermittent, and of poor quality (see Box 6.19). Where users receive water intermittently, there is more risk that pollutants will contaminate the network, and there is increased infrastructure deterioration. Leakage losses from distribution networks are often high, and it is not unusual for more than one-third of the water to be lost before delivery in many Central and Eastern European countries (see Figure 6.28).
|
Box 6.19 Water supply and sanitation in Armenia |
|
Sections of Armenia’s oversized and inefficient water supply and sanitation infrastructure are in disrepair, and occasionally even non-existent. The wastewater network collects sewage from 60–80 per cent of urban areas, but raw sewage is mainly discharged directly to receiving waters, as only a few of the 20 treatment plants constructed before 1990 are still in operation. About 63 per cent of all wastewater collectors were built about 40–45 years ago, and are now in a state of decay. The water supply network has also seriously deteriorated with general losses of water over 60 per cent. Consumers often receive water that is below microbiological health standards. The proportion of non-compliant water pipelines increased from 21 per cent in 1990, to 57 per cent in 2000. There was a significant increase in water-borne diseases between 1992 and 2001, and the graph below shows a large increase in water losses from water networks between 1998 and 2002, although the rate is clearly slowing.  Fig 6.28 Unaccounted for water in Armenia.[33] Fig 6.28 Unaccounted for water in Armenia.[33] |
In most parts of the region, water quality has improved since 1990, due to reductions in contaminant loads from wastewater treatment and industries, as well as a decline in industrial and agricultural activity (see Figure 6.29)[227]. Some large rivers, such as the Kura and the Volga, are still heavily polluted[228].
Agriculture is the main contributor to water pollution in Western Europe. Most nitrate pollution, which also causes eutrophication, is due to farm fertilizer and manure run-off. In the New EU, the financial crisis of the 1990s in the farming sector led to a sharp decline in fertilizer use and cattle numbers, but these are now increasing.
There is a high nitrogen surplus in [[soil]s] in many countries, and concentrations remain highest where agriculture is most intensive[229]. Together with the use of agricultural pesticides, this threatens groundwater sources, and many groundwater bodies now exceed limits for nitrate and other contaminants[230].
Decreasing inputs of oxygen consuming substances, such as ammonia and phosphorus, from urban wastewater to surface waters have led to improved oxygen and nutrient conditions in rivers and lakes. For nitrogen coming mainly from agriculture, there has been little or no improvement.
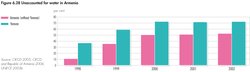 Fig 6.28 Unaccounted for water in Armenia.[34]
 Agriculture is not only responsible for a large share of water pollution, but also for about one-third of the water use across Europe, especially in the south. The proportion of water used for agriculture varies from none to 80 per cent of the total water demand, depending on the country.
Industrial water use declined through the 1980s and 1990s, because of water recycling, the closure of industries and a decline in industrial production[231]. Household water use also decreased in Western Europe, as a result of higher prices.
Managing water and sanitation
A number of conventions set out responses to Europe’s water quality problems. The EU Water Framework Directive, introduced in 2000, takes an integrated water resource management approach, with the goal that all water bodies attain good ecological status by 2015.
Partnerships for water management have a long tradition in the European Union, and there are many international agreements, such as the Danube Commission and the International Commission for the Protection of the Rhine. There has, however, been a significant decline in the level of water quality monitoring in parts of Central and Eastern Europe in the 1990s. Since then, improvements have been observed, but in several countries monitoring is still insufficient to obtain a clear picture of water quality[232].
The EU focus has shifted from point sources of water pollution to diffuse or non-point sources of contaminants, such as agricultural run-off[233]. Non-point sources are difficult to measure or estimate, and thus are hard to manage[234].
Modernizing water networks would improve water availability, and tackling leaks would prevent the loss of substantial amounts of piped water in some New EU countries[235]. Water metering and appropriate pricing would create an incentive to conserve water, and could lead to estimated savings of 10–20 per cent[236], but care must be taken to ensure that prices are not prohibitive. The EU Water Framework Directive stipulates that water users should contribute adequately to the full cost of the water supply.
Water demand management can be applied in the agriculture sector, for example through the substitution of crops with plants that have a lower water demand[237], and more water-efficient irrigation technology. Water recycling is also a good means of using water more sustainably.
Latin America and the Carribean
Drivers of Change
Socio-economic trends
Latin American and the Caribbean region (LAC) comprises 33 countries, and can be sub-divided into three sub-regions: the Caribbean, Meso-America (Mexico and Central America) and South America. Over 560 million people, representing over 8 per cent of the world’s population, live in the region, with over half of them concentrated in Brazil and Mexico. Between the release of the Brundtland Commission report in 1987 and 2005, the region’s population grew by almost 34 per cent. While the annual population growth rate for the region fell from 1.93 to 1.42 per cent, growth rates are still well above 2 per cent in several Central American countries. Over the same period, regional life expectancy increased from about 66 to 71 years[238].
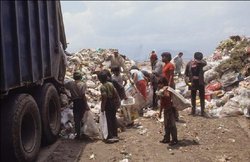 Children and their parents work all day sifting through rubbish for scraps to sell. (Credit: Mark Edwards/Still Pictures)
 For the region as a whole, human development, as measured by the UNDP Human Development Index (HDI), is at an intermediate level. Compared to 1985, all nations in the region have climbed in the ranking, indicating that, on average, people have become healthier, better educated and less impoverished[239]. However, only 33 per cent of the region’s population lives in countries with a high level of human development. Haiti was ranked 154th among 177 countries on the HDI in 2004.
Poverty and inequality persist as serious challenges. While the proportion of poor people fell from 48.3 per cent in 1990 to 43.5 per cent in 1997, it was still 42.9 per cent (222 million people) in 2004, of which 96 million lived in extreme poverty[240]. Of the world’s regions, Latin America and the Caribbean has the worst income inequality. The poorest 20 per cent of households get between 2.2 per cent of national income in Bolivia, and 8.8 per cent in Uruguay. The wealthiest 20 per cent of households enjoy 41.8 per cent of national income in Uruguay, and 62.4 per cent in Brazil[241].
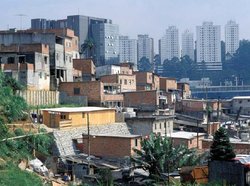 This photo shows the disparity between the rich and the poor. (Credit: and Ron Giling/LINEAIR/Still Pictures)
 After the “lost decade” of the 1980s, when per capita GDP decreased by 3.1 per cent/year mainly due to a general economic crisis, GDP grew by some 53 per cent between 1990 and 2004, or 2.9 per cent/year on average[242]. However, this rate is noticeably lower than that experienced by other developing sub-regions (particularly South East Asia), and well below the 4.3 per cent needed to meet the Millennium Development Goal to reduce extreme poverty[243]. Regionalization and globalization have triggered an increase in oil and gas extraction, expanded the use of arable land for monoculture exports and intensified tourism in the Caribbean[244].
Energy consumption
Energy consumption is still low, and its use relatively inefficient (see Box 6.20). Anthropogenic carbon dioxide (CO2) emissions from Latin America and the Caribbean, which are closely related to energy use, increased by some 24 per cent from 1990 to 2003. However, at 2.4 tonnes/person/year they are still well below those in developed countries (19.8 tonnes/person/year in North America and 8.3 in Europe for 2003). In fact, the region as a whole today only contributes just over 5 per cent of global anthropogenic CO2 emissions[245].
|
Box 6.20 Energy supply and consumption patterns[246] |
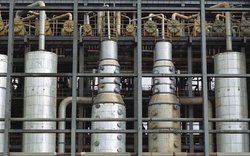 Brazil is the world's foremost producer of biofuels. Above is a distillery in Brazil for sugar and ethanol production. (Credit: Joerg Boethling/Still Pictures) Brazil is the world's foremost producer of biofuels. Above is a distillery in Brazil for sugar and ethanol production. (Credit: Joerg Boethling/Still Pictures) Uneven access to energy, as well as inefficiency in energy use are still challenging sustainable development. Latin America and the Caribbean holds 22 per cent of the world’s hydropower potential, 14 per cent of the capacity of the geothermal power systems installed worldwide, 11 per cent of global petroleum reserves, 6 per cent of natural gas and 1.6 per cent of coal. Countries like Argentina, Chile, Ecuador, Mexico and Venezuela depend mostly on fossil fuels, while Costa Rica and Paraguay use more renewable energy, Brazil is the world’s foremost producer of biofuels (from sugar cane and soy). Despite this abundance of energy sources, annual per capita energy consumption, at 0.88 tonnes of oil equivalent, increased only slightly over the 1987–2004 period. It is still below the world average (1.2 tonnes), and much lower than in developed regions (2. 4 tonnes in Europe and 5.5 in North America). Transportation and industry are the major energy consumers. The former accounted for 37 per cent of total energy consumption, followed by 34 per cent for the industrial sector during the 1980–2004 period. Fuelwood is still an important energy source, especially in the domestic sector, although its use decreased between 1990 and 2000. |
Between 1980 and 2004, energy intensity (energy consumption per unit of GDP) stagnated in Latin America and the Caribbean[247], with associated negative economic and environmental impacts. In industrialized countries, it fell by 24 per cent. This lack of progress in energy intensity in Latin America and the Caribbean can be explained by a lack of more efficient technologies, outdated industries, subsidized fuel prices (with respect to international market prices) and the transport sector’s high and inefficient use of energy (see [[Chapter2 (Global Environment Outlook (GEO-4): Chapter 6)]4]).
Science and technology
Latin America and the Caribbean has traditionally lacked competitiveness in scientific development and technological innovation[248]. But countries have taken a variety of steps towards investing in environmental science and technology relevant to the promotion of sustainability[249]. However, very few countries in the region have reached the international goal of investing at least one per cent of GDP in science and technology[250]. In addition, there is a significant emigration of highly educated people, creating a “brain drain” to industrialized countries[251].
Governance
Environmental governance is a complicated issue, since the environment has not yet been given the high-priority status it requires[252]. Regional participation in global multilateral environmental agreements (MEAs) is generally high (see Box 6.21), and governmental institutions formally devoted to environmental matters were created in most countries over the last 15 years. However, the profile and budgets of environmental institutions are often lower than those of other ministries or departments, which have so far failed to mainstream environmental criteria. Current environmental challenges in Latin America and the Caribbean, as well as environmental policies in many of its countries, point clearly to the fact that good governance, and land-use planning in particular, are crucial, cross-cutting issues for the 21st century.
|
Box 6.21 Regional participation in global multilateral environmental agreements (MEAs)[253] |
|
Over 90 per cent of the countries in Latin America and the Caribbean have signed MEAs, such as Ramsar, World Heritage, CITES, UNCLOS, the Montreal and the Kyoto protocols and the Basel Convention. MEAs related to biological diversity and desertification had even higher levels of participation. By contrast, participation in MEAs (signatories), such as the Cartagena Protocol, and the Rotterdam and Stockholm conventions, was considerably lower, at 76, 45 and 64 per cent, respectively. Ensuring compliance with MEAs continues to be a major challenge, as enforcement depends on national (and sometimes sub-regional) action in which governmental capacities are critical. Since demands for monitoring originate from the public, local empowerment of civil society is crucial. The 1987 [[Montreal] Protocol on Substances that Deplete the Ozone Layer] and its amendments are an example. With little social pressure for compliance, all 33 countries ratified the agreement, but only 7 have achieved the targets. |
The region has emphasized manufactured and human capital as the basis for development, disregarding natural capital (both natural resources and environmental services) as the physical basis of economic and social activities. This has led to poor urban and rural development planning, an increasing rural to urban influx, the development of social and spatial inequities, and limited institutional capacities to enforce environmental policies and regulations.
Despite these difficulties, governmental, academic and social institutions increasingly ensure that environmental issues are taken into account. Governments increasingly recognize that environmental management is closely related to issues of poverty and inequity, and that good governance should include a stable economy as an instrument for sustainable development, and not only as a goal in itself[254].
Free access to environmental information, and widespread provision of environmental education could foster the necessary impetus and political will for improved environmental policies. Research on the environmental, social and economic dimensions of sustainability is urgently needed to support the design of policies that focus on the sustainable management of land assets, both natural and social. This is perhaps the greatest challenge facing the region.
Selected Issues
Latin America and the Caribbean represents about 15 per cent of the world’s total land area, yet it holds the largest variety of WWF defined ecoregions, harbouring examples of all biomes, except tundra and taiga (although alpine tundra occurs in isolated spots). It also has the largest species diversity of the world’s regions, and many of its species are endemic and hosts several of the world’s greatest river basins, including the Amazon, Orinoco, Paraná, Tocantins, São Francisco and Grijalva-Usumacinta[255].
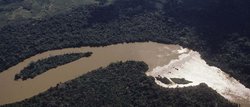 The Tocantins River hosts a diversity of species, many of which are endemic. (Credit: Mark Edwards/Still Pictures)
 With nearly 28,000 cubic metres/person/year, per capita freshwater availability is much higher than the world average, but freshwater resources are unevenly distributed. Brazil alone has nearly 40 per cent, and areas such as the Colombian chocó receive over 9,000 mm of rainfall/year. On the other hand, almost 6 per cent of the region’s land is desert, and, in some places, such as the Chihuahua or Atacama deserts, there is no appreciable precipitation. Increasing water demand and contamination, especially in and around the growing urban areas, along with inefficient water use, have progressively diminished water availability and quality. For the first time in the last 30 years, water availability has become a limiting factor for the socioeconomic development of some Latin America and the Caribbean areas, particularly in the Caribbean[256].
Extensive, unplanned urbanization, threats to terrestrial biodiversity and ecosystems, coastal degradation and marine pollution, and regional vulnerability to climate change are key priorities among the major environmental issues in the region. These four selected issues are crucial to both regional and global environmental sustainability.
Growing Cities
Urbanization
Latin America and the Caribbean is the most urbanized region in the developing world, with an urbanization level similar to that of developed regions. Between 1987 and 2005, the urban population increased from 69 to 77 per cent of the total population (see Figure 6.30). In Guyana and St. Lucia, the urban population represents less than 28 per cent of the total, while in Argentina, Puerto Rico and Uruguay, it is over 90 per cent. The growth rate of the urban population in the region slowed from 2.8 per cent annually between 1985 and 1990 to 1.9 per cent between 2000 and 2005,[257]. The mega-cities of Mexico City, Sao Paulo and Buenos Aires have about 20, 18 and 13 million inhabitants respectively. Between 1980 and 2000, they had annual [[population growth] rates] of 2, 4 and 1 per cent, respectively[258].
Rural to urban migration
Population growth and rural to urban migration, driven by impoverishment of rural areas and lack of jobs, have transformed the settlement pattern from rural to predominantly urban in less than 50 years[259]. Migration has occurred at varying rates in different countries. Argentina, Chile and Venezuela urbanized relatively quickly, while the rate has been slowest in Paraguay, Ecuador and Bolivia. Today, these least-urbanized countries show the highest urbanization rates (3.3–3.5 per cent)[260]. The growth rate of many major metropolitan areas, such as Mexico City, Monterrey and Guadalajara in Mexico, has declined, but intermediate-size cities are still growing, especially those with tourism and manufacturing industries[261]. In Peru, for example, Cuzco, Juliaca, Ayacucho and Abancay have higher growth rates than Lima[262]. In Brazil, more than half of the Amazon’s urban dwellers do not live in the bigger cities of Manaos and Belem[263]. In some cases, migration from rural areas has prompted the recovery of natural forest ecosystems, a process known as forest transition[264].
Urban air pollution
Urban air pollution, mainly caused by intensive fossil fuel use in the transport and industrial sectors, remains an issue (see Chapter 2). Only one-third of the region’s countries have established air quality standards or emission limits. It is being monitored and better managed in some of the region’s biggest cities, such as Mexico City[265] and Sao Paulo, where conditions had long been the worst. Mexico City has completely eliminated atmospheric lead pollution, but still faces serious problems with tropospheric ozone, sulphur compounds and particulates[266]. The quality of fuels (both gasoline and diesel) has gradually improved throughout the region; unleaded gasoline and diesel with lower sulphur levels are used increasingly[267]. Bogota has reduced pollution from motor vehicles, but it still struggles to control emissions from industries in urban areas. However, air pollution is increasing in medium and smaller cities, where resources and control technologies are less available, and where urban growth management is still inadequate[268]. Indoor air pollution, mainly affecting poor people who use traditional biomass for cooking and heating, has a lower profile on the urban environmental agenda.
Water, sanitation and waste collection services
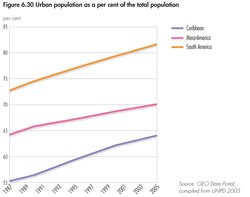 Fig 6.30 Urban population as a percent of the total population.[35]
 Production and consumption are centralized in urban areas, affecting their surroundings through deforestation, land degradation, loss of biodiversity, soil, air and water contamination, and extraction of building materials. The generally better supply of services (such as water, energy and sewage) in urban areas contrasts with the undersupply of health, education and other social services that many (particularly poor) urban dwellers face, increasing the toll on their well-being. Urban poverty is a key issue: 39 per cent of urban families live below the poverty line, and 54 per cent of the extremely poor are urban[269].
Over the course of the 20th century, water extraction (see [[Chapter4 (Global Environment Outlook (GEO-4): Chapter 6)]3]) has increased by a factor of 10, and now amounts to some 263 cubic kilometers per year, with Mexico and Brazil together accounting for 51 per cent[270]. Between 1998 and 2002, 71 per cent of the region’s water use was for agriculture[271]. The region’s population with access to improved drinking water increased from 82.5 per cent in 1990 to 91 per cent in 2004. In the same period, access to safe water in urban areas increased from 93 to 96 per cent, and in rural areas from 60 per cent to 73 per cent. However, by 2005 nearly 50 million inhabitants of the region still lacked access to improved drinking water[272], with 34 million of them in rural areas[273]. The cost of water supply is rising, due to increasing demand and decreasing accessibility. In Mexico City, water imported from the Cutzamala watershed must be pumped upto 1 100 metre to reach the high altitude Basin of Mexico[274].
Provision of sanitation services (see [[Chapter4 (Global Environment Outlook (GEO-4): Chapter 6)]4]) increased from 67.9 per cent of the region’s population in 1990 to 77.2 per cent in 2004 (85.7 and 32.3 per cent in urban and rural areas, respectively). However, only 14 per cent of the sewage is adequately treated[275] , and in 2004 some 127 million people still lacked access to sanitation services[276]. Surface- and groundwater resources are frequently polluted with a variety of substances, including nitrates and heavy metals, but the region still lacks adequate systematic monitoring and protection of water sources. Water pollution has significant impacts on coastal areas, where some 50 per cent of the population is located[277].
Urbanization has prompted a rapid increase in solid waste generation in the region. Municipal solid waste production increased from an estimated 0.77 kilogrammes/person/day in 1995 to 0.91 kg/person/day in 2001. On average, municipal waste still contains a high level of organic (putrescible) residues (about 56 per cent) and a moderate amount (about 25 per cent) of such materials as paper, plastics, fabric, leather and wood[278]. Formal recycling efforts are still incipient. Although 81 per cent of all municipal solid waste generated is collected, only 23 per cent is adequately disposed of. The rest is discarded in an uncontrolled manner at unofficial dump sites, in watercourses and along roadsides or is burned, polluting land, air, and waterbodies[279].
Improving urban planning and management
During the past decade, an emerging policy response to environmental issues combines command-and-control approaches, such as regulations and standards, with economic instruments, such as those implementing the polluter-pays-principle and payment for environmental services. Several recent examples have shown, however, that privatization is not by definition the best approach to introduce such concepts as payment for water services, as it does not necessarily lead to a more sustainable and equitable use of the resource[280]. The potential for these policies to improve ecosystem and human well-being should be carefully evaluated. Payment schemes have no power to reverse the damage if careful urban planning is neglected.
 The integrated public transportation system in Curitiba, Brazil. (Credit: Ron Giling/Still Pictures)
 The chaotic growth of cities, their demand for resources, and the pressure created by current production and consumption patterns should give way to a sustainable use of the resource base so as to improve people’s quality of life, and meet long-sought development goals. To achieve this, the use of economic instruments and effective compliance with environmental law need to be coupled with participatory and [[ecological]ly] oriented urban planning as the strategic basis for sustainability.
Several successful examples clearly demonstrate the feasibility of developing and implementing policies that address at least some of these pressing environmental problems in cities, such as urban air pollution. All are based on sounder urban environmental planning and management. For example, the integrated public transport systems developed in Curitiba (Brazil) and Bogota (Colombia) have become a model for other large cities in the region (Mexico City, Sao Paulo and Santiago de Chile) and in Europe[281], as has the integrated programmes for air quality management implemented in major Mexican cities since the 1990s[282]. Other examples include the urban agriculture and restoration of the waterfront of Havana (a UNESCO World Heritage City), water law reforms in Chile that have improved water efficiency and wastewater treatment[283], and the community-based solid waste management scheme adopted in Curitiba[284].
Terrestrial Biodiversity
Damage to biodiversity
Latin America and the Caribbean is characterized by an extremely high biological diversity, at ecosystem, species and genetic levels. Amazonia alone is considered to have about 50 per cent of the world’s biodiversity[285]. Six of its countries (Brazil, Colombia, Ecuador, Mexico, Peru and Venezuela) are considered mega-diverse. Each of these countries has more species of plants, vertebrates and invertebrates than most of the nations on the planet together[286]. The ecoregions together form a huge terrestrial corridor of 20 million square kilometers[287].
This immense biodiversity is under threat due to habitat loss, land degradation, land-use change, deforestation and marine pollution[288]. Eleven per cent of the region is currently under formal protection[289]. Of 178 ecoregions recognized in the region by the World Wide Fund for Nature (WWF)[290], only eight are relatively intact, 27 are relatively stable, 31 are critically endangered, 51 are endangered, 55 are vulnerable, and the remaining six are unclassified. Around one-sixth of the world’s endemic plants and vertebrates are threatened by habitat loss in seven regional “hot spots.” Forty-one per cent of the threatened endemic plants are in the tropical Andes, some 30 per cent are in Meso-America (including the Chocó-Darién-Esmeraldas area between Panama and Colombia) and the Caribbean, and 26 per cent are in the Brazilian Atlantic Forest and Cerrado (savannah)[291].
High ecological diversity is accompanied by rich cultural diversity (see Chapter5 (Global Environment Outlook (GEO-4): Chapter 6)). Over 400 different indigenous groups are estimated to live in the region – roughly 10 per cent of the total population. Frequently, they live on society’s margins, and have no role in decision making at the national level. Many indigenous cultures have already disappeared, and others are on their way to extinction[292]. As economics turn towards market homogeneity, cultural heterogeneity and traditional management knowledge is increasingly threatened (see [[Chapter5 (Global Environment Outlook (GEO-4): Chapter 6)]2]) (see Box 6.22).
|
Box 6.22 Cultural diversity, traditional knowledge and trade[293] |
 Indigenous people in Brazil, collecting medicinal plants. Traditional knowledge has proven to be enormously valuable in supporting livelihoods. (Credit: Mark Edwards/Still Pictures) Indigenous people in Brazil, collecting medicinal plants. Traditional knowledge has proven to be enormously valuable in supporting livelihoods. (Credit: Mark Edwards/Still Pictures) Indigenous and campesino communities have a long history of environmental management, developed in close relationship with the huge biodiversity of the region. This has led to both successes and failures in protecting environmental resources. Common property is a widespread land tenure system that offers both challenges and opportunities. In many cases, the domestication and diversification of resources that are currently highly valued originated in indigenous communities. This knowledge is transmitted orally from one generation to the next, but as indigenous groups tend to be marginalized by migration and landuse change, it is being progressively lost. Traditional knowledge has proven to be enormously valuable, as, for example, in bioprospecting and biotechnology in recent times. Many modern drugs derive from traditional uses of plants by indigenous groups. In some cases, traditional knowledge has led to what is now recognized as sustainable environmental management. A deep understanding of this type of knowledge, and an adequate system of intellectual property rights is badly needed in the region. |
The region contains 23.4 per cent of the world’s forest cover, but is losing it rapidly. Trade, unplanned urbanization and lack of land-use planning are driving the conversion of forests to pastures for livestock production, and monoculture planted forests for crops such as corn, wheat, rice, coca and soy, for export and to produce biofuel. Forests are also cleared for infrastructure, such as roads and large dams, and the growth of urban areas. Other pressures include land speculation, wood harvesting, timber demand and forest fires[294].
Some 66 per cent of the global forest cover loss from 2000 to 2005 occurred in Latin America (see Figure 6.31), while the region contains over 23 per cent of the world’s forest cover[295]. South America suffered the largest net loss (almost 43,000 km2/ year), of which 73 per cent occurred in Brazil[296]. Deforestation can reduce the quantity and quality of water resources, result in increased soil erosion and sedimentation of water bodies, and cause severe degradation or loss of biodiversity[297]. It is also an important cause of greenhouse gas emissions. Deforestation in the region is responsible for an estimated 48.3 per cent of the total global CO2 emissions from land-use change (see [[Chapter2 (Global Environment Outlook (GEO-4): Chapter 6)]5]), with nearly half of this coming from deforestation in Brazil, particularly in the Amazon Basin. New efforts are being made to ameliorate this devastation. As a result of integrated prevention and control programmes, annual deforestation in the Amazon decreased from some 26,100 km2 in 2004, to 13,100 km2 in 2006[298]. The so-called “Zero Deforestation Law” passed in 2004 by the Paraguayan Congress has helped to reduce the deforestation rate in Paraguay’s Eastern Region by 85 per cent. Until 2004, Paraguay had one of the highest deforestation rates in the world[299].
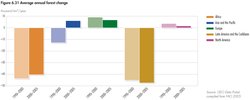 Fig 6.31 Average annual forest change.[36]
 Land degradation is another major environmental issue in this region (also see [[Chapter3 (Global Environment Outlook (GEO-4): Chapter 6)]6]). Some 3.1 million km2, or 15.7 per cent, is degraded land. The problem is more severe in Meso-America, where it affects 26 per cent of the territory, while 14 per cent of South America is affected[300]. Water erosion is the main cause of land degradation, while wind erosion is significant in some locations, such as the area bordering Bolivia, Chile and Argentina[301]. The mountain regions of Meso-America and the Andes are among the most seriously eroded areas in the world[302].
Desertification affects 25 per cent of the territory due to deforestation, overgrazing and inadequate irrigation (see Chapter 3)[303]. Salinization of agricultural [[soil]s] due to irrigation is particularly significant in Argentina, Cuba, Mexico and Peru, which have extensive dryland areas that are often subject to inappropriate use or protracted droughts[304]. Furthermore, the agricultural intensification is causing nutrient depletion (see Box 6.23).
|
Box 6.23 Agricultural intensification in Latin America and the Caribbean[305] |
|
In South America, an estimated 682,000 km2 are affected by nutrient loss, with about 450,000 km2 affected to a moderate or severe degree. Fertility is decreasing in northeastern Brazil and northern Argentina, while other critical areas are found in Mexico, Colombia, Bolivia and Paraguay. Only 12.4 per cent of the region’s agricultural land has no fertility limitations; 40 per cent of the territory has low potassium, and nearly one-third has aluminium toxicity, a condition found especially in the tropics. In 2002, the region consumed approximately 5 million tonnes of nitrogen [[fertilizer]s], equivalent to 5.9 per cent of global consumption, of which 68 per cent was consumed by Argentina, Brazil and Mexico alone. The major environmental impact of excessive use of such fertilizers is increased nitrification of waterbodies and soil (see [[Chapter3 (Global Environment Outlook (GEO-4): Chapter 6)]7]), which also affects coastal zones (see section below), drinking water supplies (see [[Chapter4 (Global Environment Outlook (GEO-4): Chapter 6)]5]) and biodiversity (see [[Chapter5 (Global Environment Outlook (GEO-4): Chapter 6)]3]). |
Protecting terrestrial biodiversity
The area under protection (both marine and terrestrial IUCN Categories I-VI) almost doubled from 1985 to 2006, and now shields 10.5 per cent of total territory, with greater relative coverage in South America (10.6 per cent) and Meso-America (10.1 per cent) than in the Caribbean (7.8 per cent)[306]. New efforts are being made, such as the creation of the Meso-American Biological Corridor, which extends from southern Mexico to Panama, and the Pilot Programme to Conserve the Brazilian Rain Forest. In the Amazon, seven new conservation areas have been created, totalling about 150,000 km2 and including the largest (42,500 km2) strictly-protected area ever created in a tropical forest, the Grão-Pará Ecological Station[307]. In general, “biodiversity hot spots” are poorly protected throughout the region. Protective actions and continuous efforts are needed in most hot spots, as well as in other areas rich in biodiversity.
The policy environment has changed dramatically in recent years, with an increasing mobilization of civil society to address issues such as extraction of oil and gas, water access and protection of regional biodiversity (see Chapters 3, 4 and 5 (Global Environment Outlook (GEO-4): Chapter 6)). Some recent examples include the geopolitical alert over the Guarani Aquifer (one of the world’s largest, encompassing 1.2 million km2 in Brazil, Paraguay, Uruguay and Argentina)[308], and the debates over the Pascua-Lama gold mining project in Chile[309], a new law on protected natural areas in the Dominican Republic, and the construction of pulp mills on the Uruguay River.
Biodiversity conservation and the effective enforcement of environmental laws remain policy challenges in the protection of biological resources. Current policies can impose restrictions for conservation efforts, and they should be revised at the local, national and regional levels. Local institutions and common property approaches should be considered in planning for conservation and sustainable management, while adequate funding and revenue strategies are still needed. Payment for environmental services[310] may be a crucial instrument for effectively protecting biodiversity[311], and promising examples are underway in several countries, such as Mexico, Costa Rica and Colombia[312].
Degraded Coasts and Polluted Seas
Coastal degradation threats
The effects of coastal degradation, and the deterioration or loss of the wide range of environmental services provided by marine and coastal ecosystems are felt inland, often a long way from the coast[313] (see Chapters 3 and 4 (Global Environment Outlook (GEO-4): Chapter 6)). About half of the regional population lives within 100 kilometers of the coast[314]. Nearly one-third of the coastline in North and Central America and about half of that in South America are under moderate to high threats from the impacts of development. As a result, mangrove losses range from 67.5 per cent in Panama and 36 per cent in Mexico, to 24.5 per cent in Peru, while Costa Rica recorded a gain of 5.9 per cent[315]. The growth of aquaculture and shrimp farming has also contributed to mangrove damage[316]. The destruction of these ecosystems has increased risks for coastal populations and infrastructure[317].
The Caribbean Sea provides many ecosystem services, such as fisheries and recreation opportunities, and attracts about 57 per cent of the world’s scuba diving tours[318]. Between 1985 and 1995, 70 per cent of monitored beaches in the eastern Caribbean islands had eroded, indicating a loss of shoreline protection capacity and increased vulnerability to erosion and storm effects[319]. In the Caribbean as a whole, 61 per cent of the coral reef area is under medium or high threat from sediment, marine and land-based sources of pollution, as well as from overfishing[320]. Coastal groundwater contamination (including saltwater intrusion) is occurring throughout the region, at great economic cost[321].
The region’s oceans face a number of threats, including eutrophication caused by land-based sources of nutrient pollution, unplanned urbanization, lack of sewage treatment, salinization of estuaries due to decreased freshwater flow, unregulated ballast waters from ships and invasive of alien species[322].
Specific threats to the region’s marine waters include:
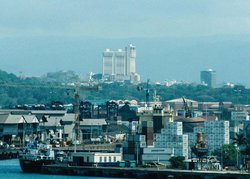 There has been nearly a tripling in the volume of marine cargo in the region. Above is a container and cranes at the freight port of Panama City. (Credit: Rainer Heubeck/Das Fotoarchiv/Still Pictures)
 - Some 86 per cent of the sewage goes untreated into rivers and oceans; in the Caribbean, the figure rises to 80–90 per cent[323].
- There is elevated oil pollution from refineries in the Greater Caribbean and the Gulf of Mexico, and from deep offshore drilling in the Gulf of Mexico and off Brazil. Oil spills are a serious problem in the Gulf of Mexico[324].
- Agrochemical run-off is also important, and highly toxic concentrations have been found in estuaries in the Caribbean, Colombia and Costa Rica[325].
- With nearly a tripling in the volume of marine cargo in the region between 1970 and 2004[326], marine transport is an important source of pollution.
- Hazardous waste, including radioactive materials from other regions, is shipped around South America or through the Panama Canal, and heavy metals pollute the Gulf of Mexico[327].
- Many invasive alien species (crustaceans, land molluscs and insects) inadvertently introduced through freight and ballast, have inflicted important economic damage to infrastructure and crops[328].
- Overfishing is a major source of concern, particularly in the Caribbean, where pelagic predator biomass appears to have been depleted (see Box 6.24).
|
Box 6.24 Fisheries fluctuation in the Humboldt Current Large Marine Ecosystem[329] |
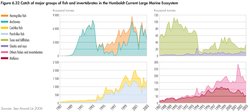 Fig 6.32 Catch of major groups of fish and invertebrates in the Humbold Current Large Marine Ecosystem.[37] Fig 6.32 Catch of major groups of fish and invertebrates in the Humbold Current Large Marine Ecosystem.[37] The regional marine catch peaked in 1994, accounting for close to 28 per cent of the global catch. Harvests in Peru and Chile, which account for most of this catch, had doubled or tripled in the preceding decade. Regional fisheries fell to 50 per cent of that level in 1998, but recovered to 85 per cent of the 1994 level by 2000. The greatest impact of these fluctuations has been on small pelagics (anchovy, sardine and mackerel) that predominate the regional catch in the Humboldt Current Large Marine Ecosystem, along the west coast of South America (see Figure 6.32). In 2001, regional aquaculture represented 2.9 per cent of the world’s total volume and 7.1 per cent of the value. It was concentrated in Chile (51 per cent) and Brazil (19 per cent), but was developed at the expense of mangroves, estuaries and salt marshes. |
Degraded coastal waters put people’s health at risk. Cholera and other water-borne diseases are on the rise in [[coastal] areas], and can be related to declining water quality, [[climate change]s] and eutrophication-driven algal blooms. These blooms (including red tides) have caused neurological damage and death in people through consumption of affected seafood[330]. Cholera increases the rates of sickness and death, and has a severe economic impact in coastal regions. For instance, tuna from countries with incidences of cholera has to be quarantined. Human health effects are also caused by nearshore water pollution, as people consume fish or other seafood containing heavy metals and other toxins that have bioaccumulated in the food chain (see [[Chapter4 (Global Environment Outlook (GEO-4): Chapter 6)]6])[331].
Responses to marine and coastal pollution
Most regional and sub-regional responses are related to the UNEP Regional Seas programme, the UN Convention on the Law of the Sea, international conventions on maritime transport and conventions on fisheries (Fisheries and aquaculture)[332]. Only a few countries have ratified global agreements against illegal exploitation of highly migratory fish populations.
Regional Seas Programmes exist for the North East Pacific, the South East Pacific and the Wider Caribbean. All programmes are underpinned by regional conventions: the 1981 Convention for the Protection of the Marine Environment and Coastal Zones of the South-East Pacific (Lima Convention), the 2002 Convention for Cooperation in the Protection and Sustainable Development of the Marine and Coastal Environment of the North-East Pacific (The Antigua Convention) and the 1983 Convention for the Protection and Development of the Marine Environment of the Wider Caribbean Region (Cartagena Convention). Protocols to address specific problems (such as mitigating and preventing pollution from land-based activities, radioactive pollution, oil spills, and protected areas and wildlife) have been adopted in the South East Pacific and the Wider Caribbean, while the North East Pacific programme is still at an early stage, seeking financial support for implementing its action plan[333]. The effectiveness of these programmes still remains to be assessed. In general, there is inadequate use of economic instruments, making compliance dependent on limited monitoring resources.
However, integrated marine and coastal areas management is gaining ground, with growing protection for marine areas, and increasing efforts to establish marine protected areas, such as the whale sanctuary in the marine areas of Mexico, established in 2002[334]. But, more focus is needed on the integration of coastal area and inland river basin management (ICARM) as a key response to coastal and marine pollution (see Chapters 4 and 5 (Global Environment Outlook (GEO-4): Chapter 6)). The Global Environment Facility (GEF) and the UNEP/ GPA Secretariat are supporting this approach, as well as the integrated management of shared living marine resources in the Caribbean.
Regional Vulnerability to Climate Change
Findings by the Intergovernmental Panel on Climate Change (IPCC) indicate that impacts of global warming in Latin America and the Caribbean include rising sea levels, higher rainfall, increased risk of drought, stronger [[wind]s] and rain linked to hurricanes, more pronounced droughts and floods associated with El Niño events, decline in water supplies stored in glaciers and declines in crop and livestock productivity[335]. Tropical rain forests in Meso-America and the Amazon basin, mangroves and coral reefs in the Caribbean and other tropical areas, mountain ecosystems in the Andes, and coastal wetlands are some of the ecosystems more vulnerable to the effects of climate change[336]. Small island states are particularly extreme cases, as they may be affected by surface warming, droughts and reduced water availability, floods, erosion of beaches and coral bleaching, all of which might affect local resources and tourism[337]. Furthermore, changes in El Niño behaviour may be associated with increasingly severe and more frequent extreme climate events[338].
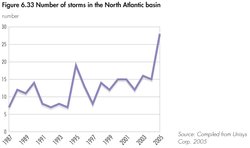 Fig 6.33 Number of storms in the North Atlantic basin.[38]
 Extreme climate events affecting the region have already increased over the last 20 years. The number, frequency, duration and intensity of tropical storms and hurricanes in the North Atlantic Basin have increased since 1987 (see Figure 6.33). The 2005 season was the most active and the longest on record, with 27 tropical storms, 15 of which became hurricanes. An unprecedented four of these storms reached category five on the Saffir-Simpson scale, with Wilma being the most intense in history[339]. Hurricanes Jeanne and Ivan in September 2004, and Dennis in July 2005, had severe impacts on Caribbean islands, killing 2,825 people and affecting just over 1 million more (EMDAT). Hurricane Stan in October 2005 left 1 600 dead and 2.5 million people affected in Haiti, Central America and Mexico (EM-DAT).
In South America, flooding and landslides had huge impacts in the 2000–2005 period, including 250 dead and 417,500 affected in Bolivia (EM-DAT). Economic damage is increasing, partly due to more people being exposed. From 1997–2006, it doubled in Central America and the Caribbean, and grew by 50 per cent in South America (as compared to the preceding decade) (EM-DAT). Poverty and settlement on vulnerable sites, such as coastal areas and marginal zones, expose people to increased risks from flooding, landslides and other hazards. In addition, natural and social conditions throughout the region increase the risk of exposure to infectious diseases, such as malaria or dengue fever, which are in turn exacerbated by climate change (see Box 6.25).
|
Box 6.25 Health, climate and land-use change: re-emerging epidemics[340] |
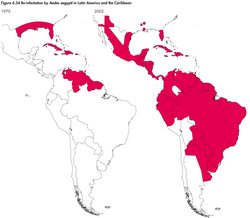 Fig 6.34 Re-infestation by Aedes Aegypti in Latin America and the Caribbean. Fig 6.34 Re-infestation by Aedes Aegypti in Latin America and the Caribbean. Rising temperatures, land cover modification, changing precipitation patterns and shrinking health expenditures are behind the re-emergence of epidemics once under control in Latin America and the Caribbean. Changes related to the El Niño-Southern Oscillation tend to increase the geographic distribution of disease vector organisms, and result in alterations to the life cycle dynamics and seasonal activity of vectors and parasites. This amplifies the risk of transmission for many vector-borne diseases, such as malaria, dengue fever, yellow fever and bubonic plague. A reinfestation of the Aedes aegypti mosquito, responsible for the transmission of yellow fever and dengue fever (see Figure 6.34), and is thought to be related to climate change. Both too much and too little precipitation can lead to faecal-oral transmission infections, such as cholera (as in Honduras, Nicaragua and Peru in 1997 and 1998), typhoid fever and various diarrhoeas. Flooding can contaminate water with human waste, while a lack of water means less for hygiene. The loss of vegetation and the occurrence of extreme weather events facilitate the contamination of water, and an increase in pests. |
Between 2000 and 2005, droughts caused serious economic losses for more than 1.23 million people in Bolivia, Brazil, Cuba, El Salvador, Guatemala, Honduras, Haiti, Jamaica, Mexico, Nicaragua, Paraguay, Peru and Uruguay (EM-DAT). In 2003 and 2004, the Amazon River experienced its lowest water level in a decade, and Cuba had only 60 per cent of its average rainfall[341].
The loss of Latin American glaciers is particularly dramatic evidence of climate change: the Andean ridge and Patagonia in Argentina are showing evidence of glacier retreat, and a reduction in snow-covered zones (see Figure 6.35). In Peru, the Andean glaciers of Yanamarey, Uruashraju and Broggi are diminishing in size, while the Antisan glacier in Ecuador retreated eight times faster during the 1990s than in previous decades. In Bolivia, the Chacaltava glacier lost over half of its area since 1990[342]. Glacier loss in the Andes, and saltwater intrusion from sea-level rise will affect the availability of drinking water, and may also affect agricultural production and tourism.
Mitigation and adaptation to climate change
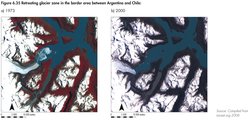 Fig 6.35 Retreating glacier zone in the border area between Argentina and Chile.[39]
 A lack of adaptation capabilities increases the severity of climate change impacts[343]. Latin America and the Caribbean, particularly its small island states, is especially vulnerable to the effects of climate change, such as sea-level rise and extreme events[344]. The region lacks basic information, observation and monitoring systems, capacity building and appropriate political, institutional and technological frameworks. It has generally low income, and many settlements are in vulnerable areas. Under the United Nations Framework Convention on Climate Change (UNFCCC), countries in the region agreed to mitigation and adaptation activities in the energy, transport, agricultural and waste management sectors, and to increase the capacity of carbon sinks[345].
North America
Drivers of Change
Socio-economic trends
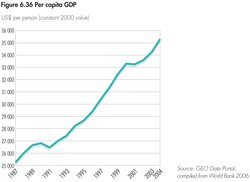 Fig 6.36 Per capita GDP.[40]
 Over the past 20 years, North America (Canada and the United States) has continued to enjoy generally high levels of human, economic and environmental well-being. Canada and the United States rank sixth and eighth respectively on the 2006 Human Development Index[346]. Since 1987, the region’s total population grew, mostly due to immigration, by 23 per cent to almost 339 million in 2007, with 90 per cent in the United States[347]. There has been strong growth in per capita GDP (see Figure 6.36). The ratio between energy use and GDP continued a slow but positive decline that began in 1970, reflecting a shift to less resource-intensive production patterns, although the region remains among the most energy-intensive in the industrialized world. The two countries (along with Mexico) became more economically integrated following the 1994 North American Free Trade Agreement (NAFTA). The combination of a growing population and economy has many implications for environment and development. It leads to increases in energy use, anthropogenic greenhouse gas (GHG) emissions and the overuse of the planet’s resources.
Energy consumption
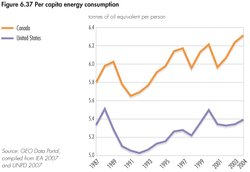 Fig 6.37 Per capita energy consumption.[41]
 With only 5.1 per cent of the world population, North America consumes just over 24 per cent of global primary energy. Per capita energy consumption in both countries is shown in Figure 6.37. Total energy consumption grew 18 per cent. The US transport sector consumes 40 per cent of total energy used (see Figure 6.38), making it the dominant energy user in the region. Total transport energy consumption rose by 30 per cent between 1987 and 2004[348]. More big, less fuel-efficient vehicles and a rise in number of vehicles and distances travelled contributed to this trend.
Environmental governance
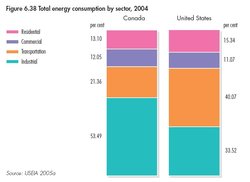 Fig 6.38 Total energy consumption by sector, 2004.[42]
 Building on the solid foundation of environmental legislation from the 1970s, the two countries strengthened domestic policies, and entered into important bilateral and multilateral environmental agreements over the past two decades. Following the report of the World Commission on Environment and Development in 1987, sustainable development was adopted in principle, and governments are integrating it into policy and governing structures. Market-based programmes have been effective, especially in controlling SOx emissions, and, as a result, have been applied widely in North America and elsewhere. New modes of paying for ecosystem services are providing increased incentives for controlling pollution and conserving natural resources.
They have made important strides in transboundary cooperation to address common environmental issues, through organizations such as the Commission for Environmental Cooperation (CEC), the International Joint Commission (IJC) and the Conference of Eastern Canadian Premiers and New England Governors. The CEC, which includes Mexico, has a mechanism for citizen submissions that has enabled the public to play an active whistle-blower role when a government appears to be failing to enforce its environmental laws effectively. Both Canada and the United States are federal systems, where decisions are often made at local or regional levels. States and provinces, municipalities and other local actors have become especially progressive in addressing environmental issues. North America is a leader in research in environmental science and ecology, developing state of environment reporting, integrating the public into environmental decision making and providing access to timely information on environmental conditions.
The United States leads the world in the production of goods-and-services that mitigate or prevent environmental damage[349]. The growth engine of North America also helps drive creation of employment and wealth in most parts of the world. As in other regions, the transition from a growth only, heavy polluting model to a sustainable development one is still in process, with much more to be done.
Selected Issues
North American priority issues identified for this report through regional consultation are energy and climate change, urban sprawl, and freshwater quality and quantity. The analyses illustrate how atmospheric and water pollution, as well as sprawl, have direct impacts on both ecosystems and human health, and can cause economic, social and cultural impacts and disruptions. As in the rest of the world, the most vulnerable populations suffer the greatest impacts.
Energy and Climate Change
Although total energy consumption has increased since 1987 (see above), progress has been made in using energy more efficiently. Energy consumption per unit of GDP dropped since the 1980s, reflecting the rising importance of the service sector, and information and communication technologies, which use less energy to create wealth than do heavy industries. Investments in energy efficiency have proven to be economically and environmentally beneficial (see Box 6.26). Improved energy efficiency can also be attributed in part to the outsourcing of some production activity, relocating energy use and its impacts in other parts of the world[350].
|
Box 6.26 Energy efficiency makes economic sense[351] |
|
A 13 per cent improvement in national energy consumption per unit of GDP between 1990 and 2003 saved Canadians almost US$7.4 billion in energy costs in 2003, and reduced annual GHG emissions by an estimated 52.3 million tonnes. The US Energy Star programme, a voluntary labelling programme promoting energy-efficient products and practices, prevented 35 million tonnes of GHG emissions, and saved about US$12 billion in 2005 alone. |
Energy production
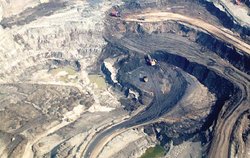 Oil sand mining has major negative environmental impacts. (Credit: Chris Evans, The Pembina Institute http://www.OilSandsWatch.org)
 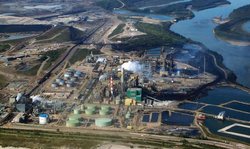 Oil sand mining has major negative environmental impacts. (Credit: Chris Evans, The Pembina Institute http://www.OilSandsWatch.org)
 The United States and Canada exhibit similar energy consumption patterns, which have hardly changed over the past 15 years and are dominated by just over 50 per cent petroleum products. They do differ in energy production, though. While total energy production grew in both countries, oil production declined in the United States (see Figure 6.39), resulting in a growing dependence on imported oil. Driven by demand for transportation fuel, the rising price of crude oil, uncertainty about supplies and a favourable fiscal regime, heavy investments were made in Canada, doubling oil production from oil sands to about 150,000 tonnes/day between 1995 and 2004. Production may reach some 370,000 tonnes/ day by 2015, with an associated doubling of GHG emissions[352].
Extracting oil from the sands involves the use of large amounts of natural gas and water. It results in substantial releases of GHGs, the disposal of dangerous tailings and wastewater, and the radical alteration of landscapes and damage to boreal forests, which threatens wildlife habitat and requires extensive reclamation. Improved environmental performance of oil sands production is likely to be eroded by a huge increase in development[353].
Heavy reliance on imported fossil fuels heightened concerns over US energy security during the last decade (see [[Chapter7 (Global Environment Outlook (GEO-4): Chapter 6)]2]). Canada’s concern focuses on the impacts that US demand for Canadian energy will have on its own energy supply, and on the environment. Canada is the most important source of US oil imports, and over 99 per cent of Canada’s crude oil exports go to the United States[354]. To help meet US demand, oil and gas exploration in that country increased dramatically over the past 20 years; from 1999 to 2004, the number of drilling permits more than tripled[355].
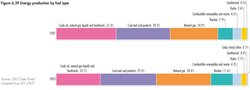 Fig 6.39 Energy production by fuel type.[43]
 Coal-bed methane production has increased in both countries since the mid-1990s. It is still in its infancy in Canada, but it accounted for about 7.5 per cent of total US natural gas production in 2000. The heavy sodium content of water drawn off in this process can pollute surface- and groundwater used for drinking and irrigation[356]. The exploration for underground deposits, drilling of closely-spaced wells to recover coal-bed methane, and the new infrastructure for fossil fuel exploration, production and distribution have significant impacts. The fragmenting and damaging of wilderness areas[357], increasing air pollution, pipeline leaks and oil transport spills all pose important environmental and health threats[358]. There is increasing recognition of the human health costs of fossil fuel combustion (see Box 6.27).
|
Box 6.27 Fossil fuels and human health in North America[359] |
|
Burning fossil fuels in power plants and vehicles is the major source of CO2, SO2 and NOx emissions. There are clear associations between exposure to air pollutants and a range of human health problems. In the early part of this decade, air pollution caused the premature deaths of an estimated 70,000 people a year in the United States and some 5,900 in Canada. It is known to exacerbate asthma, which is on the rise, especially among children. Mercury emitted when coal is burned in power plants enters the food chain, affecting indigenous people in the North more than other North Americans (see [[Chapter2 (Global Environment Outlook (GEO-4): Chapter 6)]6] and the Polar Regions section in this chapter). It can have severe health effects. |
Greenhouse gas emissions and climate change
The energy sector is a major CO2 emitter (see Figure 6.40). The United States emits 23 per cent and Canada 2.2 per cent of global energy-related GHG emissions[360]. Fossil fuel combustion accounts for 98 per cent of total US CO2 emissions. From 1987 to 2003, CO2 emissions from fossil fuels in North America increased 27.8 per cent, and per capita emissions per unit of GDP remain high relative to other industrialized regions[361]. The transport section is a major emitter of GHGs; in 2005, it accounted for 33 per cent of total US energy-related CO2 emissions[362]. An emerging issue is the rise in emissions from air travel (see Chapter 2).
The IPCC Fourth Assessment in 2007 stated with very high confidence that climate change is human-induced through GHG emissions (see Chapters 2, 4, 5 (Global Environment Outlook (GEO-4): Chapter 6) and the Polar section of this chapter), and this will have important consequences for human health (see Box 6.28) (see Chapter 2). With its large output of GHGs, North America has an impact on the changing climate in other parts of the world, disproportionately affecting poor and more vulnerable countries and people[363].
|
Box 6.28 Potential human health impacts of climate change[364] |
|
The major health threat of warmer temperatures is the likely increase in more intense and prolonged heat waves that can cause dehydration, heat stroke and increased mortality. Depending on the location, climate change is expected to increase smog episodes, water- and food-borne contamination, diseases transmitted by insects (such as Lyme disease, West Nile Virus and Hantavirus pulmonary syndrome), and the intensity of extreme weather events (hurricanes such as Katrina, which devastated the northern coast of the Gulf of Mexico in August 2005). Children, the elderly, the poor, disabled people, immigrant populations, aboriginal people, those who work outdoors and people with already compromised health would suffer disproportionately. |
Responding to climate change
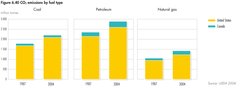 Fig 6.40 Carbon dioxide emissions by fuel type.[44]
 Since the 1990s, North American governments focused on market-based, voluntary and technological measures to address climate change. When it ratified the Kyoto Protocol in 2002, Canada committed to a 6 per cent reduction in GHG emissions below the 1990 level by between 2008 and 2012. The United States, which has signed but not ratified the protocol, called for an 18 per cent reduction in emissions relative to economic output by 2012 compared to 2002[365]. From 1992 to 2003, emissions of CO2 rose by 24.4 and 13.3 per cent for Canada and the United States respectively[366].
In 2006, the Canadian government introduced a new Clean Air Act as the centrepiece of a “green” agenda. If passed into law, short-term targets for GHG emissions will be set based on intensity (which encourages efficiency, but allows emissions to increase if output grows). In 2007, a new regulatory framework called for an absolute reduction of 150 megatonnes (or 20 per cent below the 2006 level) by 2020[367].
In 2005, the United States initiated a national energy plan. It provides support for the fossil fuel industry, and contains incentives for research and development of cleaner fuels, renewable energy, especially biofuels and hydrogen, and increased energy conservation and efficiency, among other measures[368]. In 2006, the United States joined five other countries to form the new Asia-Pacific Partnership for Clean Development and Climate, a US-led effort to accelerate the voluntary development and deployment of clean energy technologies. It exemplifies US support for public-private partnerships that replicate successful energy projects globally. Canada has expressed an interest in participating in this partnership. Both countries’ long-term policies include adaptation strategies to cope with climate change impacts[369]. Many states, municipalities, the private sector and other actors, took a variety of significant and innovative steps since the late 1990s to address GHG emissions (see Box 6.29).
|
Box 6.29 States, provinces, municipalities and businesses take climate change action |
|
Over the past 20 years, there has been a lack of recognition of the need to protect the environment as the foundation upon which development takes place. The focus has been on development first, often at the expense of the environment. However, leadership in promoting sustainability is emerging from states and provinces, municipalities, cross-border organizations, and the voluntary and private sectors. The following are examples of commitments at different governance levels to mitigate climate change:
|
Concerns about energy security are helping foster an energy transition to replace what has been called America’s “addiction to oil”[370], but it is not clear if the transition will be to a low-energy economy and lifestyle. Political support and financial incentives led to record growth in wind energy, ethanol and coal production over the past five years[371], and there has been renewed interest in nuclear energy. Since 2000, biomass has been the largest renewable energy source in the United States. Sales of hybrid cars also grew over the past several years, although North America is behind many other industrialized regions in promoting and using fuel-efficient alternatives to the internal combustion engine[372]. North America’s earlier successes in arresting air pollution and acid rain have become models for other regions.
Sprawl and the Urban-Rural Interface
Urban expansion
Sprawl was an issue in GEO-3, and continues to be one of the most daunting challenges to environmental quality in North America. Permissive land-use planning and zoning, and the growth of affluent populations facilitated urban sprawl. Houses and lots have become bigger, while the average number of people per household has fallen[373]. Sprawl has contributed significantly to increases in the number of cars, vehicle kilometers travelled and the length of paved roads in North America over the past 20 years. Urban development accounts for less than 1 per cent of Canada’s land area[374] and 3.1 per cent of US land area[375].
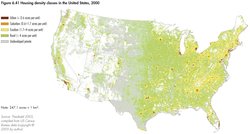 Fig 6.41 Housing density classes in the United States, 2000.[45]
 Urban sprawl, a settlement pattern and process on the outskirts of urban areas characterized by low-density housing, continued unabated over the past 20 years. By 2000, it was expanding at twice the rate of population growth in the United States[376], and Canada now has 3 of the world’s 10 most sprawling urban areas (Calgary, Vancouver and Toronto)[377]. In the United States, coastal areas represent only 17 per cent of the US land base, but contain more than half the US population[378]. Sprawl is increasing, and can stretch 80 km inland.
Rural or exurban sprawl has expanded more than other settlement patterns over the past decade, and is an increasing threat to natural (and protected) areas and their ecosystem services. Exurban sprawl is defined as clusters of large lot, low-density housing developments beyond the urban fringe, separated by natural areas and with extended commuting distance to urban areas[379]. Between 1990 and 2000, the exurban population of the 22 states west of the Mississippi River increased by 17.3 per cent[380]. Population growth in California’s Central Valley, which supplies the United States with one-quarter of its foodstuffs, is threatening valuable agricultural land[381].
Exurban expansion, as well as commercial and energy developments close to protected areas, threatens their integrity[382]. In 2000, urban and suburban settlements occupied almost 126,000 square kilometres in the United States, while exurban housing accounted for over seven times that (some 11.8 per cent of the United States mainland)[383] (see Figure 6.41). There was strong growth in rural areas of the Rocky Mountains, southern states and the California interior[384] (see Box 1.9 in Chapter 1). Exurban sprawl also characterized most of the increase in Canada’s rural population from 1991 to 1996, especially in the west[385]. Where developments press up against open spaces, they create an urban-rural interface (URI), where social and ecological systems overlap and interact[386].
Expansion of exurban sprawl and the URI are associated with the fragmentation and loss of forests, prime agricultural land (see Chapter 3), wetlands and other resources, such as wildlife habitats and biodiversity (see Box 6.30 below). Of the more than 36,400 km2 of land developed in the United States between 1997 and 2001, 20 per cent came from cropland, 46 per cent from forest land and 16 per cent from pastureland[387]. In Canada, about half the area converted to urban uses over the past 30 years was good agricultural land, meaning land where crop production is not constrained[388].
|
Box 6.30 Sprawl is threatening biodiversity in the United States[389] |
|
Although developed land covers only a small proportion of North America’s land base, it has a large impact on ecosystem services. For example, roads occupy just 1 per cent of the US land area, but they alter the ecological structures and functions of about 22 per cent or more of the land. In US regions with rapid exurban growth, species richness and endemism diminish as urban cover increases, threatening biodiversity. The fragmentation of natural habitat threatens more than 500 endangered US wildlife species with extinction. It also provides new entry points for invasive species already introduced through other pathways (see [[Chapter5 (Global Environment Outlook (GEO-4): Chapter 6)]4]). |
In both countries, grasslands are also being lost and fragmented, leading to drastically altered native prairie landscapes, biodiversity loss and introduced species. The North American Central Grasslands are considered to be among the most threatened ecosystems, both on the continent and in the world[390]. Finally, almost half the annual net loss of wetlands from 1982 to 1997 in the United States was due to urban development[391].
 Wild elk in the residential area of Gardiner, Montana. (Credit: Jeff and Alexa Henry/Still Pictures)
 Wildfire is a positive agent of natural disturbance in many forest ecosystems, but the increased intermingling of housing with flammable forests and grasslands contributed to a rise in the number of “interface” fire incidents over the past decade[392]. Interface fires destroy property, threaten human health and wildlife, and can foster invasive species and insect attacks. Such fires are not as severe in Canada, but they still affect thousands of people, and have large economic costs, and the risks are growing[393].
Increased exurban development affects freshwater in several ways. Impervious surfaces channel water into drains and sewers instead of replenishing groundwater, and suburban runoff contains a host of pollutants[394]. Furthermore, the expanding URI is also creating more opportunities for off-road vehicle recreation, which is an emerging source of habitat fragmentation, increased erosion, water degradation, and noise and air pollution, especially in the United States[395]. Although the desire for a healthy environment is a key incentive to move to the suburbs, some health threats occur more in suburbs than in areas with less sprawl (see Box 6.31).
|
Box 6.31 Sprawl and human health[396] |
|
Traffic deaths and injuries, and illness associated with higher ozone levels occur more in sprawling suburbs than in denser settlements. Suburban areas are less conducive to walking than are compact neighbourhoods, and lack of exercise can contribute to weight gain and associated health problems, such as diabetes. Expansion of the URI has led to greater human exposure to diseases and infections transmitted between animals and humans, such as Lyme disease, which is on the rise in the United States. |
Smart policy response to sprawl
North America has made important strides in reducing forest, grassland and wetland losses to urban and suburban development over the past 20 years, through public and private preservation, mitigation and restoration programmes.
A number of states, provinces and municipalities have designed and implemented Smart Growth[397], and other strategies that include a wide variety of policy tools to manage sprawl[398]. One definition of Smart Growth is about 48 people/hectare, a density deemed conducive to public transit[399]. The features of Smart Growth are meant to reduce the environmental impact of human settlements and travel, preserve farmland and green space and their ecosystem services, and increase “liveability.” Organizations representing many sectors of society have endorsed the principles of Smart Growth[400].
Nationally, the United States encourages sustainable urban development through the Smart Growth Network, the Liveability Agenda and the National Award for Smart Growth Achievement[401]. Between 1997 and 2001, 22 US states enacted laws to curb sprawl[402]. In Canada, the 30-year plan of the Transportation Association of Canada led to the inclusion of sprawl control in the master plans of most Canadian cities[403]. Canada’s 2002 Urban Strategy, its 2000 Green Municipal Fund and the 2005 New Deal for Cities and Communities all support sprawl control in various ways[404]. There is a lack of information about the effectiveness of sprawl control, but Bengston and others[405] found that policy implementation, packages of complementary policy instruments, vertical and horizontal coordination, and stakeholder participation are vital elements for success.
Urban air pollution policy should include such integrated policy packages. Over the past two decades, a number of emissions declined, due to a variety of controls, including clean air legislation, voluntary and regulatory acid rain programmes, and transboundary air quality agreements. Both North American countries now have comparable criteria for air quality[406], and real-time air quality information is provided on the Internet. Both countries introduced regulations to reduce emissions from new diesel vehicles, starting in 2007[407], and to reduce mercury emissions from coal-burning power plants[408]. These controls should help to bring down concentrations of traditional urban air pollutants, which remain high compared to other developed regions [409].
Freshwater
Water supply and demand
North America possesses about 13 per cent of the world’s renewable freshwater[410], but despite the apparent abundance, users are not always close to water sources, and some experience periodic water deficits[411]. Limited water supplies have led to increased competition for water in parts of western North America (see Box 6.32), the Great Plains[412] and the Great Lakes basin. Droughts can increase the stress. A severe drought during 2000–2005 affected large areas of North America from the US southwest to Canada’s Atlantic provinces[413].
|
Box 6.32 Water shortages in the North American west[414] |
|
With a yearly average rainfall of less than 10.2 centimetres, the western United States is one of Earth’s driest regions, but it is home to about one in five US citizens. The Colorado River drains almost 627,000 km2, and is completely allocated to providing water for more than 24 million people, irrigating about 8,100 km2 of agricultural land and generating 4,000 megawatts of hydropower (see [[Chapter4 (Global Environment Outlook (GEO-4): Chapter 6)]7]). A trickle now feeds the once-fertile delta at the river’s mouth. In the early 1990s, a water market developed, allowing rapidly growing municipalities to purchase water rights from farmers and ranchers. The United States introduced a number of strategies to forestall conflicts, including water conservation and efficiency, and collaboration. |
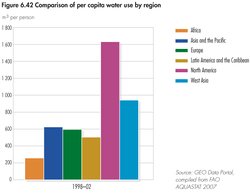 Fig 6.42 Comparison of per capita water use by region.[46]
 Glaciers and snowpacks, a major source of the Canadian Prairies’ water, are declining[415], and hydrological variability is expected to worsen with climate change, exacerbating competition for water among agriculture, the oil and gas industry, and municipalities. The Prairie Provinces have responded by adopting watershed planning and management strategies[416].
The United States and Canada respectively are the two highest per capita water users in the world (see Figure 6.42). One of the key reasons is its low cost, the lowest among the world’s industrialized countries, given the subsidies to industry, agriculture and municipalities. Another reason is that North America is a net exporter of food, and thus the world’s biggest exporter of “virtual water,” which is the water contained in the food[417]. Since the mid-1990s, some municipalities in both countries introduced limited water metering, and water restrictions in times of shortage. An emerging concern is the loss of municipal water from leaking pipes, which ranges up to 50 per cent in some places, due to ageing infrastructure[418].
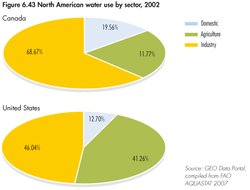 Fig 6.43 North American water use by sector, 2002.[47]
 Figure 6.43 shows the major categories of water users in both countries. Agriculture accounts for 39 per cent of North America’s annual water withdrawal[419]. The United States has over 75 per cent of North America’s irrigated cropland, and between 1995 and 2000, this area increased by nearly 7 per cent.
Groundwater demand in North America increased over the past 20 years. Irrigation in drought-prone regions of the United States is responsible for unsustainable withdrawal of water from aquifers, at rates as much as 25 per cent higher than natural replenishment[420]. The impacts of overdrafting aquifers include land subsidence, saltwater intrusion in coastal areas and loss of aquifer capacity (see Chapter 4, Table 4.1). Although groundwater data in Canada is limited, studies suggest that most aquifers are not yet threatened by overdrafting[421].
In the United States, water efficiency improved due to water conservation strategies, supported since 2002 by the Farm Bill[422]. By 2004, the area irrigated with sprinkler and micro-irrigation systems had grown to more than half the total irrigated land[423].
Water quality
Overall, drinking water in North America is the cleanest in the world, but some places in the region have water of lower quality[424] (see Box 6.33). Measures and definitions of water quality differ between the two countries, making an overall assessment of the region difficult. Preliminary indicators show that Canada’s freshwater is “good” or “excellent” at 44 per cent of selected sites, “fair” at 31 per cent, and “marginal” or “poor” at 25 per cent[425]. Studies using different measures show that about 36 per cent of US watersheds have moderate water quality problems, 22 per cent have more serious problems and 1 in 15 [[watershed]s] is highly vulnerable to further degradation[426]. A recent study revealed that 42 per cent of the nation’s shallow streams were in poor environmental condition[427].
|
Box 6.33 Drinking water, wastewater treatment and public health[428] |
|
North American drinking water can contain contaminants from municipal and industrial wastewater effluents, sewer overflows, urban run-off, agricultural wastes and wildlife. Pathogens in drinking water have been responsible for numerous health-related incidents in the region, and its waters also contain pharmaceuticals, hormones and other organic contaminants from residential, industrial and agricultural origins. Canada Treatment of effluents in municipalities has improved since 1991, but a number of serious health incidents related to contaminated water in the early part of this decade affected thousands of people, and prompted provinces to increase groundwater monitoring, and adopt better methods to adhere to national guidelines. Many coastal communities still discharge insufficiently treated sewage, and a number of indigenous communities have inferior drinking water and sewage services compared to other Canadians. Overflows from combined sewer and storm-water systems are leading causes of water pollution. Provinces and some municipalities have wastewater and sewage standards, and enforce federal guidelines, but Canada has no nationally enforced drinking water standards. In 2006, with 193 of 750 systems in First Nations communities classified as high risk, the federal government launched a plan of action to address their drinking water concerns. United States Concentrations of contaminants rarely exceed US drinking water standards, but guidelines for some compounds have not yet been established, and the interactive effects of complex mixtures are still uncertain. The United States experienced some 250 disease outbreaks and nearly 500,000 cases of water-borne illness from polluted drinking water between 1985 and 2000. In 2005, the United States amended the Safe Drinking Water Act to reduce the entry of microbial contaminants and the health risks from disinfection by-products. Some 3.5 million US residents get sick each year from exposure to pollution from sewer spills and overflows while swimming, boating and fishing. The US Beach Act of 2000 requires states to adopt US Environmental Protection Agency (USEPA) health standards to protect people from harmful pathogens, and information on beach quality is provided in real time. The US Clean Water Act requires all cities to have secondary sewage treatment, and new measures to control storm-water discharge were introduced in the 1990s. However, a 2005 study found that more than half the Great Lakes’ municipalities were violating these rules, and ageing infrastructure is an emerging and costly problem. |
The primary causes of degradation are agricultural runoff, sewage treatment plant discharges and hydrologic modifications (see Figure 6.44 and Box 6.33). Significant gains have been made in protecting water quality from point sources of pollution, while non-point contamination, especially from agriculture, the largest source of freshwater impairment, has become a priority in both countries.
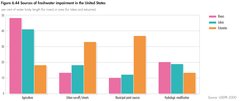 Fig 6.44 Sources of freshwater impairment in the United States.[48]
 Confined (or concentrated) animal feeding operations (CAFOs), which have increased in size, scale and geographic clustering over the past 20 years, are a growing source of non-point nutrient pollution[429]. When improperly managed, nutrients from manure enter waterbodies and groundwater. Nutrient management plans now require farmers to adhere to certain guidelines to control run-off, but in 2001, only 25 per cent of manure-producing farms had such plans[430]. The US Clean Water Act regulates waste discharges from livestock systems, while states can impose either stricter or more lenient restrictions[431]. CAFOs consume large amounts of water, and are under increasing pressure to conserve it[432].
About 40 per cent of major US estuaries are highly eutrophic due to nitrogen enrichment: agricultural fertilizer accounts for about 65 per cent of the nitrogen entering the Gulf of Mexico from the Mississippi Basin[433]. It contributes to the formation of the world’s second-largest aquatic “dead zone” (after the Baltic Sea)[434]. A 2000 Action Plan aims to reduce the average size of the Gulf of Mexico dead zone by half by 2015 (see [[Chapter4 (Global Environment Outlook (GEO-4): Chapter 6)]8]).
Chesapeake Bay is also subject to nutrient problems and associated large algal blooms that kill fish and destroy shellfish habitat. Despite programmes in place since 1983, the ecosystem has become seriously degraded as population growth increases pressures[435]. Dead zones also occur in [[freshwater]s], such as Lake Erie’s hypoxic zone, which has expanded since 1998, harming the lake’s food web[436]. The region has instituted innovative transboundary, multistakeholder and multilevel policy measures to address this and other water problems (see Box 6.34) (see [[Chapter4 (Global Environment Outlook (GEO-4): Chapter 6)]9]).
|
Box 6.34 The Great Lakes[437] |
|
National and transboundary multistakeholder and multi-level regulatory measures in the Great Lakes ecosystem (see GEO-3), where about 15 million Canadians and 30 million US citizens live, have addressed pressures from industrial processes, improved water quality and reduced mercury concentrations in sediments over the past 20 years, but so far only two of the 43 polluted Areas of Concern have been de-listed. The Great Lakes are still subject to contaminated run-off, untreated municipal sewage, eroding shorelines, wetland loss and invasive species. There are more than 160 nonnative species in the lakes, and some, such as the zebra mussel, cause serious harm. Urban sprawl and population growth throughout the region are harming the ecosystem. The cumulative effect of these pressures is threatening its health, and efforts are now underway to study this ecosystem as a whole. |
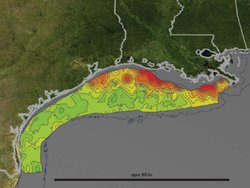 Summertime satellite observations of ocean colour in the Gulf of Mexico show highly turbid waters which may include large blooms of phytoplankton extending from the mouth of the Mississippi River all the way to the Texas coast. Reds and oranges represent low oxygen concentrations. (Credit: NASA/Goddard Space Flight Center Scientific Visualization Studio www.gsfc.nasa.gov/topstory/2004/0810deadzone.html)
 In Canada, increased fertilizer use, livestock numbers and manure application also contribute to increased nitrogen contamination in lakes and rivers[438], including Lake Winnipeg, where phosphorus loadings increased by 10 per cent over the last 30 years, posing a severe threat to the lake’s ecological balance[439]. A 2003 action plan, and Manitoba’s 2006 Water Protection Act aim to reduce phosphorus and nitrogen loadings. Nitrate concentrations in Canada’s agricultural streams have contributed to declines in some amphibian populations[440].
At present, all levels of governments are increasingly attempting to address [[watershed]s] as integrated systems through Integrated Water Resource Management (IWRM), comprehensive river basin management and other approaches. The adoption of city and community-based management and restoration strategies is also growing[441] (see Chapter 4). For example, New York City’s investment in land conservation in the Catskills- Delaware watershed to protect the natural filtration capacity of the city’s water source is helping to reduce the cost of its water treatment plants[442].
West Asia
Drivers of Change
Socio-economic trends
The 12 countries of West Asia are divided into two sub-regions: the Arabian Peninsula, including the Gulf Cooperation Council (GCC) and Yemen; and the Mashriq, including Iraq, Jordan, Lebanon, Occupied Palestinian Territories (OPT) and Syria.
Although the region made notable progress towards achieving the [[Millennium Development Goals] (MDGs)] in health, education and empowerment of women[443], some 36 million people over 18 years of age (32 per cent of the total population) are still illiterate, including 21.6 million women[444]. Poverty in the region has been rising since the 1980s, ranging from almost no poverty in Kuwait to as much as 42 per cent of the population in Yemen[445]. It is possible for the GCC countries to achieve the MDGs by 2015, but doubtful for the Mashriq and Yemen, and impossible for Iraq and the OPT[446].
While the region experienced a large increase in its human development scores between 1960 and 1990, it registered very little progress thereafter[447]. People endure low levels of freedom at the family, tribal, traditional, social and political levels, and the majority of countries still lack political institutions and modernized constitutions and laws that protect individual freedoms and human rights[448]. There is some indication, however, of a slow and gradual democratization process, which may lead to greater accountability.
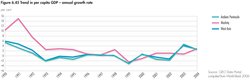 Fig 6.45 Trends in per capita GDP - annual growth rate.[49]
 Countries in each sub-region have responded differently to socio-economic and geopolitical changes since 1987. The exploitation of natural resources, and sustained population and urban growth remain the major factors in all West Asian economies. Agriculture is the main economic activity in the Mashriq and Yemen, contributing an average 30 per cent to GDP, and employing more than 40 per cent of the work force, whereas oil is the major source of income in the GCC, representing about 40 per cent of GDP, and 70 per cent of government revenues[449].
West Asia’s high dependency on natural resources has made it very vulnerable to economic shocks and fluctuations in international prices, with profound repercussions on growth, employment and economic stability, as well as on the environment. A clear example is the decline of oil prices in the 1980s that plunged the region into a decade of macro-economic instability, characterized by rising debts, high unemployment rates and acute balance of payment difficulties.
With the economic reforms of the late 1980s and early 1990s, and the temporary recovery of oil markets, the region witnessed some economic stabilization during the 1990s, reflected in reduced inflation rates, lower public and foreign deficits and a noticeable increase in investments[450], but there were limited impacts on economic growth. Population increases likely eroded economic achievements by 2002 (see Figure 6.45). Nevertheless, starting in 2002, and with sharp increases in oil prices, growth picked up significantly, particularly in the GCC countries, which experienced remarkable capital inflows and rising investment levels[451].
Recent developments, such as trade agreements and partnerships with the European Union and the United States, are expected to contribute to economic growth and development in the region. Despite these positive developments, demographic and employment pressures will continue to constitute a core development problem, and result in major challenges in the future. Although declining, population growth rates are still close to 3 per cent. On average, the population is 63 per cent urban[452], and unemployment rates rise above 20 per cent[453]. Political instability, the shattered economies of Iraq and the OPT, and associated disruptions and sharp declines in growth pose further challenges.
Environmental governance
Significant effort has been made in environmental governance since the World Commission on Environment and Development report. Countries have actively begun enacting environmental regulations, and setting up a variety of local, national and international environmental institutions[454]. National environmental strategies and action plans were prepared, and some countries are preparing sustainable development strategies. However, there is still governmental reluctance to implement integrated environmental, economic and social decision making. Governments still routinely conceive and implement economic development programmes on a sectoral basis, without considering their environmental and social causes, contexts and implications.
The creation of effective institutions, capacity building, and strict environmental legislation and enforcement are urgently required to discourage the relaxation of environmental protection. Regional cooperation and coordination among West Asian countries to manage shared marine and water resources, mitigate the impacts of transboundary environmental problems and enhance regional environmental management capacity should be a priority. Finally, socio-economic integration in the region has the potential to alleviate population pressures on development and the environment.
Selected Issues
The region’s environment is predominantly dryland, with great variability in rainfall within and between seasons, and frequent spells of drought, making water the most precious resource. Poor resource management over several decades has resulted in widespread land and marine degradation. Population growth and changes in consumption patterns have made urbanization a major environmental issue. A protracted history of wars and conflicts has placed peace and security at the centre of environmental concerns. Five regional priority issues were selected: freshwater stress, land degradation, marine and coastal degradation, urban management, and peace and security.
Freshwater
Overexploitation of water
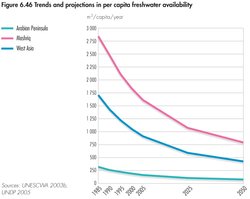 Fig 6.46 Trends and projections in per capita freshwater availability.[50]
 West Asia is one of the world’s most water-stressed regions. Between 1985 and 2005, its overall per capita freshwater availability fell from 1 700 to 907 cubic metres/year (see Figure 6.46). Based on projected population increases, it is expected to decline to 420 m3/year by the year 2050.
The Mashriq relies mainly on surface water, and, to a lesser extent, on groundwater, while the Arabian Peninsula relies on renewable and non-renewable groundwater and desalinated water. Both regions are increasingly using treated wastewater. Since more than 60 per cent of surface water originates outside the region, the issue of shared water resources is a major determinant of regional stability. Riparian countries have not signed agreements on equitable sharing and management of water resources. Groundwater overexploitation and the continued deterioration in the quality of limited surface- and groundwater, as a result of industrial, domestic and agricultural effluents, aggravate water scarcity, and affect human health and ecological systems (see [[Chapter4 (Global Environment Outlook (GEO-4): Chapter 6)]10]).
Rapid urbanization, particularly in the Mashriq and Yemen, challenges efforts to meet increasing domestic water demands with scarce public funds. Municipal water consumption escalated from 7.8 billion m3 in 1990 to about 11 billion m3 in 2000, a 40 per cent increase, a trend expected to persist[455]. Although most people have access to improved drinking water and sanitation, these services are not always reliable, especially in lower-income areas. Such water shortages are a problem in key cities like Sana’a, Amman and Damascus[456].
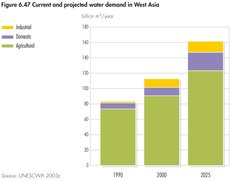 Fig 6.47 Current and projected water demand in West Asia.[51]
 In the GCC countries, rapid population growth and urbanization, and the rise in per capita water consumption explain the current alarming increase in urban water demand. With an average consumption range of 300–750 litres/person/day, GCC residents rank among the highest per capita water users in the world[457]. Key reasons include the absence of proper demand management and price signalling mechanisms. Government policies have primarily focused on the supply side of water production from aquifers or desalination plants. Water tariffs are generally quite low, representing an average of no more than 10 per cent of the cost, and therefore there are no incentives for consumers to save water.
Although urban demand is high, the agricultural sector consumes most water, accounting for more than 80 per cent of total water used (see Figure 6.47). During the past few decades, economic policies favouring food self-sufficiency and socio-economic development have prioritized the development and expansion of irrigated agriculture. Agricultural water use increased from about 73.5 billion m3 in 1990 to more than 85 billion m3 in the 1998–2002 period[458], exerting immense pressures on the region’s limited water resources (see Box 6.35). Although many countries recently abandoned such policies, agricultural water consumption is expected to increase, and problems in allocating water among agricultural, domestic and industrial sectors will worsen.
|
Box 6.35 Depletion of fossil groundwater in the GCC: what happens when the water is gone?[459] |
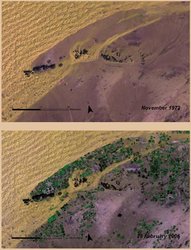 Agricultural expansion based on fossil groundwater in Saudi Arabia. The bright circles are the areas that are irrigated by large sprinklers. (Credit: UNEP/GRID-Sioux Falls) Agricultural expansion based on fossil groundwater in Saudi Arabia. The bright circles are the areas that are irrigated by large sprinklers. (Credit: UNEP/GRID-Sioux Falls) Over the past three decades, economic policies and generous subsidies in most of the GCC countries supported the expansion of irrigated agriculture in an effort to achieve food security. Irrigation water is often used inefficiently, and without considering the economic opportunity cost for potable water and urban or industrial demands. Agriculture contributes less than 2 per cent to GDP in GCC countries, but it overexploits groundwater resources, most of which are non-renewable, resulting in their depletion and quality deterioration due to seawater intrusion and the upflow of saltwater. No clear “exit strategy” exists to address the question of what happens when the water is gone. |
In the Mashriq, the health impacts of poor water quality are a major concern (see Box 6.36). The main causes are the use of untreated domestic wastewater for irrigation, poor sanitation and inadequate waste management[460]. Furthermore, overexploitation of groundwater has caused many natural springs to dry up, resulting in destruction of their surrounding habitats, as well as the loss of their historical and cultural values. An example is the drying up of most of the historical springs in the Palmyra oasis in Syria, including Afka, around which the historical Kingdom of Zanobia was developed[461].
|
Box 6.36 The health impacts of water pollution[462] |
|
A 2002–2003 pilot project assessing impacts of groundwater nitrate contamination in the Mashriq countries confirmed it as a serious source of illness in infants. In general, most small villages in the region lack adequate wastewater disposal systems, and rely on individual household cesspits. This contributes to the contamination of groundwater, often a source of untreated drinking water. Extensive use of manure as fertilizer aggravates the problem as run-off seeps into aquifers. Nitrate causes methemoglobaenemia (blue baby syndrome) in infants, a condition that can result in death or retardation. |
Towards sustainable water resources management
The supply driven approach to water management has not delivered a substantial degree of water sustainability or security. Recently, most countries have shifted towards more integrated water management and protection approaches. Water sector policy reforms focus on decentralization, privatization, demand management, conservation and economic efficiency, improved legal and institutional provisions, and public participation[463]. Very few countries have completed and integrated these strategies into social and economic development frameworks yet because existing institutional capacities are still inadequate[464].
In addition, improved population and agriculture policies are crucial to the sustainable management of water resources. The absence of agreements regulating shared surface- and groundwater resources among riparian countries, and lack of financing (mainly in Mashriq countries) constitute major challenges for the region.
Land Degradation and Desertification
Land quality
Sixty-four per cent of West Asia’s 4 million square kilometer land base is drylands[465] on calcareous [[soil]s] prone to degradation. Just over 8 per cent of the land is cultivated, but historically this has provided the population with ample food, with few adverse environmental impacts. Over the past 20 years, however, a 75 per cent increase in the population[466] has increased the demand for commodities and land. This was accompanied by the intensive use of inappropriate technology, poor regulation of common property resources, ineffective agricultural policies and rapid, unplanned urban development. These pressures resulted in widespread land-use changes, land degradation and desertification (which is land degradation in drylands, see [[Chapter3 (Global Environment Outlook (GEO-4): Chapter 6)]8]) in most of the countries.
Wind erosion, salinity and water erosion constitute the major threats, while soil waterlogging, fertility degradation and soil crusting are secondary problems. At the beginning of the 21st century, 79 per cent of the land was degraded, with 98 per cent of that being caused by people[467]. The reasons include inadequate land resource policies, centralized governance, lack of public participation, low-profile expertise, and an arbitrary and isolated single discipline approach to planning and management.
Soil degradation and food security
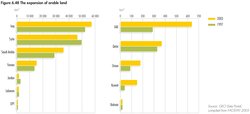 Fig 6.48 The expansion of arable land.[52]
 The expansion of cultivated and irrigated land (see Figure 6.48), intensified mechanization, modern technology, the use of herbicides, pesticides and [[fertilizer]s], and the expansion of greenhouses and aquaculture resulted in a significant increase in agricultural production. Irrigated lands increased from 4.4 to 7.3 million hectares from 1987 to 2002[468]. Despite increases in food production, however, the trade deficit continues to increase, threatening food security. Poor management and irrational use of irrigation water has increased salinity and alkalinity (see Box 3.5 in Chapter 3), which affects about 22 per cent of the region’s arable land[469]. Economic losses from the effects of salinization are expected to be significant[470].
Rangelands and soil erosion
Rangelands occupy over 52 per cent of the total land area[471]. The carrying capacity changes annually, depending on the distribution and amount of rainfall. Annual production of animal dry feed is estimated as low, ranging from 47 kilogrammes/ha in Jordan to 1 000 kg/ha in Lebanon[472]. This indicates a substantial feed gap, although there has been no significant change in the number of standard livestock units (250 kg) since 1987, estimated at 14.6 million[473]. West Asia is prone to drought, frost and excessive heat, so vegetation diversity is essential, because it enhances plant cover resilience. Biodiversity is declining, however, due to pressures on forests, woodlands and rangelands.
The impacts of heavy and early grazing, rangeland cultivation and recreational activities have significantly reduced species diversity and density, and increased soil erosion and sand dune encroachment on agricultural lands[474]. Observations of plant cover change show that vegetation in drylands may extend approximately 150 kilometres further in a rainy year than in a preceding dry year[475]. In the period 1985–1993, the land area covered by sand increased by about 375 km2 in the Al-Bishri area of Syria[476], while the size of the dune fields nearly doubled in 15 months north of Jubail, in eastern Saudi Arabia[477]. Between 1998 and 2001, overgrazing and fuelwood gathering decreased rangeland productivity by 20 per cent in Jordan and 70 per cent in Syria[478] (see [[Chapter3 (Global Environment Outlook (GEO-4): Chapter 6)]9]).
Forests
Forests occupy 51,000 km2 of West Asia, or only 1.34 per cent of the region’s total area[479], and account for less than 0.1 per cent of the world’s total forested area. Forest degradation occurs widely. Fires, wood cutting, overgrazing, cultivation and urbanization all negatively affect the products and services of the forests[480]. There have been no major changes, though, in the total extent of forest area in the last 15 years, because deforestation in some parts was balanced by afforestation in others. Between 1990 and 2000, the forest cover even increased on average by 60 km2/year in the Arabian Peninsula, but remained stable between 2000 and 2005. In the Mashriq, the rate of increase due to afforestation programmes has been 80 km2/year since 1990, and continues to date[481]. The main challenges and constraints facing sustainable forest management are weak institutions and law enforcement, unfavourable land tenure practices, climatic and water limitations, lack of technical personnel and agricultural extension services, insufficient financial resources and policy failures[482].
Mitigating land degradation
National action plans (NAPs) to combat desertification contain well-defined measures to mitigate land degradation and protect threatened areas[483]. Countries with completed NAPs (Jordan, Lebanon, Oman, Syria and Yemen), and others still in the process will need to accelerate implementation to stem desertification. The region’s countries have joined international efforts to conserve biodiversity, and most have ratified the Convention on Biological Diversity and its biosafety protocol, and have joined FAO’s International Treaty on Plant Genetic Resources for Food and Agriculture. More intensive efforts are required, though, to improve the understanding of ecosystem dynamics, and to develop more efficient and sustainable production systems, including integrated forest management programmes.
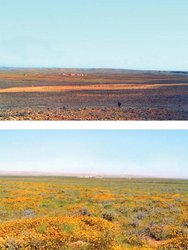 Measures to combat desertification can transform bare land (top photo, taken in 1995) into areas with good plant cover (bottom photo, taken in 2005). This area in Al-Bishri, Syria received compatable amounts of annual precipitation and spring rain in both years. (Credit: Gofran Kattash, ACSAD)
 However, in many countries these plans are not mainstreamed into national development policies. The interaction between land degradation issues and poverty is routinely ignored, leading to irrelevant and ineffective policies. Despite governmental efforts to prevent and reduce land degradation at the national and regional levels, only limited success has been achieved, mostly due to the severity of the problems. More extensive cooperative and participatory efforts are urgently needed.
There already are considerable practical efforts being made to improve degraded lands, such as introducing water-efficient irrigation and agricultural techniques[484], rehabilitating degraded rangelands (see photos), increasing the area under protection (see Figure 6.49) and afforestation projects. These efforts, however, cover only 2.8 and 13.6 per cent of degraded lands in the Arabian Peninsula and the Mashriq, respectively[485]. After a clear increase between 1990 and 1995, the total protected area remained the same, indicating the need for intensified and integrated efforts to enlarge these projects.
Governments have only recently recognized the ecological importance of forests, and are now conserving forest ecosystems and biological diversity, for example through forest reserves and ecotourism. Large water impoundments in Syria, Jordan and Iraq have also created new habitats for resident and migrating species, especially birds. Significant achievements are the restoration of Mesopotamian marshlands of Iraq, in the Eden Again Project 2004 (see [[Chapter4 (Global Environment Outlook (GEO-4): Chapter 6)]11], Figure 4.12), and the preservation of local wheat varieties in Jordan and Syria[486].
Coastal and Marine Environments
Coastal development
Coastal and marine areas in West Asia are threatened by rapid coastal development of residential towns, resorts and recreational projects (see [[Chapter4 (Global Environment Outlook (GEO-4): Chapter 6)]12]). Land reclamation, oil pollution, chemical contamination and overfishing are also factors.
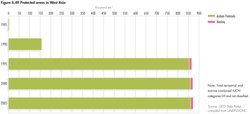 Fig 6.49 Protected areas in West Asia.[53]
 Dredging for urban and transport developments has caused extensive coastline alteration. By the early 1990s, some of the GCC countries had developed 40 per cent of their coastlines[487]. The coastal zone in Bahrain increased by about 40 km2 in less than 20 years[488]. Similarly, since 2001 more than 100 million m3 of rock and sand have been used in the Palm Islands on the coast of Dubai Emirate, United Arab Emirates (UAE) to increase the shoreline by 120 km[489]. Over 200 million m3 of dredged sediments were used for Jubail Industrial City, Saudi Arabia[490], and the 25-km causeway connecting Bahrain and Saudi Arabia used about 60 million m3 of dredged mud and sand.
Industry, agriculture, livestock production, and food and beverage processing are the major sources of organic carbon loads and oxygen-demanding compounds discharged to the marine environment in the ROPME Sea Area (RSA), which includes the coasts of the eight Member States of the Regional Organization for the Protection of the Marine Environment[491]. Water discharged directly from desalination plants contributes brine, chlorine and thermal pollution, as well as microorganisms that may include pathogenic bacteria, protozoa and viruses[492].
Oil spills and chemical contamination are other major threats to the region’s marine environment, including the Mediterranean countries of the region (see Box 6.46). Eight refineries and more than 15 petrochemical complexes are located along the coast of the RSA, and more than 25,000 tankers, carrying about 60 per cent of total global oil exports, pass through the Strait of Hormuz annually[493]. Ballast waters spill about 272,000 tonnes of oil in the RSA every year[494]. Wars and military conflicts contributed additional oil spills and chemical contamination[495].
Jordan’s coral reefs, the tidal coral reef terraces in Lebanon and Syria[496], and the great diversity of endemic organisms in Yemen and the RSA are at risk unless protected and well managed, while coastal erosion everywhere continues to be a threat. The degradation and loss of coral reefs (see Box 6.37), and the decline in the Dead Sea’s water level are additional serious problems affecting marine and coastal environments.
|
Box 6.37 Coral reef degradation and bleaching[497] |
|
There are more than 200 species of corals in the Red Sea, and 60 species in the RSA. Human activities and other factors account for the continuous degradation of corals in the region. Climate change caused major coral bleaching in the RSA and Red Sea during 1996 and 1998, and mortality of Acropora corals reached 90 per cent. |
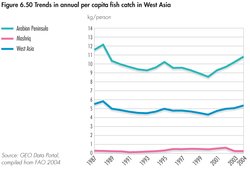 Fig 6.50 Trends in annual per capita fish catch in West Asia.[54]
 Coastal development has exerted significant pressures on fisheries. Contaminants, high temperatures, disease agents and biotoxins accounted for fish mortality in the RSA from 1986 until 2001, resulting in considerable economic losses to the fishing industry and local fishers[498]. Furthermore, population growth has led to a gradual decrease in annual per capita fish catches, especially in the RSA (see Figure 6.50), threatening food security. In the RSA, there are more than 120,000 fishers[499]. In the past 10 years, fish harvests in Mashriq countries remained at about 5,000–10,000 tonnes/year, while annual fish catches in Yemen alone increased from around 80,000 to 140,000 tonnes. Fishery regulations exist but need better enforcement, particularly in the RSA. The Red Sea has mainly been threatened by reclamation activities[500], but the emerging and growing shrimp farming industry is expected to seriously threaten remaining mangroves[501].
Policy responses
Recently, many countries introduced regulations requiring environmental impact assessments prior to any coastal or marine activities[502], and adopted integrated coastal zone management plans. West Asia has more than 30 marine reserves[503], and has signed 18 regional and international agreements related to coastal and marine environments. Accordingly, various conservation measures and regional programmes were undertaken over the last two decades[504].
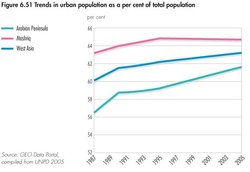 Fig 6.51 Trends in urban population as a percent of total population.[55]
 In the last five years, many activities have taken place in the Red Sea to protect mangroves as part of habitat and biodiversity conservation programmes and regional action plans[505]. In 2006, ROPME countries agreed to establish a regional environmental information centre (QEIC) in Oman, which will collect information on mangroves. A regional survey on the globally threatened sea cow began in 1986, and continues through cooperation among Saudi Arabia, Bahrain and the UAE[506].
There has been enormous pressure on marine and coastal areas, for example from oil production, although increased efficiency measures have reduced oil spillage significantly. The signing of the International Convention for the Prevention of Pollution from Ships (MARPOL), and the introduction of oil tanker reception facilities will improve the situation, but not all GCC countries have signed the protocol[507]. A 2000–2001 survey of coastal water contamination in the RSA revealed that petroleum hydrocarbon levels were lower than those reported in the Gulf War of 1990–1991, but sediments near some industrial facilities and harbours had higher levels of trace metals[508].
Urban Environment
Urbanization
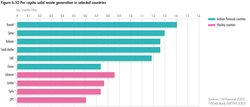 Fig 6.52 Per capita solid waste generation in selected countries.[56]
 There has been intense urbanization in West Asia over the past two decades (see Figure 6.51), which has overstretched urban infrastructure, and had significant but varying impacts on the region’s environment and natural resources. Natural population growth, rural migration and displacement in the Mashriq, economic transformations, and increased migrant labour in GCC have resulted in higher demand for water and energy, waste management challenges and the deterioration of urban air quality.
Slums and urban poverty
Slum areas have expanded, especially around the Mashriq’s major cities. Over the last decade, the number of people living in slum conditions almost doubled in Yemen, and increased by about 15, 25 and 30 per cent in Jordan, Syria and Lebanon, respectively[509].
In the OPT and Iraq, military conflicts contributed to the growth in slum and refugee camp populations. By 2005, there were about 400,600 Palestinian refugees in Lebanon, some 424,700 refugees in Syria and about 1.78 million in Jordan. In the West Bank and Gaza there were about 687,500 and 961,650 registered refugees respectively, totalling more than one-third of the total Palestinian population in these two areas[510].
During Iraq’s three Gulf wars, stringent economic sanctions and the continued conflict devastated the environment, and resulted in a severe housing shortage. The shortage was estimated at 1.4 million units in the centre and south, while in the north an estimated one in every three persons lived in grossly substandard housing or neighbourhoods[511]. In 2003, 32 per cent of people in Iraqi cities lived under or near the poverty line, while a large number lived in refugee camps on the borders with Syria and Iran[512]. Similarly, in the conflict-stricken countries of the OPT and Lebanon, these conditions led to a corresponding rise in levels of urban poverty. In 1997, 27 per cent lived below the poverty line in Lebanon, 67 per cent fell below that level in the OPT in 2004.
Urban waste management
Rapid urbanization, inadequate waste management and lifestyle changes have resulted in increased waste generation. Per capita solid waste in the GCC ranges between 0.73 and 1.4 kg/person/day, compared to 0.61 and 0.86 kg/person/day in the Mashriq (see Figure 6.52). The inability of existing waste management systems to cope has led to significant health and environmental problems. The presence of landfills, burning waste, rodents and odours has also depressed real estate values in surrounding residential areas. Reduce, re-use and recycle initiatives have recently been established in some urban centres.
Energy sector, transport and air pollution
The energy sector, dominated by huge oil and gas facilities and thermal electric power plants, is a primary driver of both economic development and environmental degradation. A balance between the two has yet to be achieved in West Asia. The region holds about 52 per cent of the world’s oil and 25.4 per cent of its gas reserves. It is responsible for nearly 23 per cent of global oil and about 8.7 per cent of global gas production[513], a contribution that is expected to increase. Per capita energy consumption in the region varies greatly between oil producing countries and non-oil producers (see Figure 6.53). The energy sector has adverse impacts on air, water, land and marine resources, and contributes to global climate change (see [[Chapter2 (Global Environment Outlook (GEO-4): Chapter 6)]7]). Average per capita CO2 emissions increased from 6 to 7.2 tonnes between 1990 and 2003, compared to a world average of 3.9 tonnes[514].
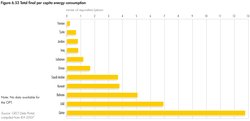 Fig 6.53 Total final per capita energy consumption.[57]
 The CO2 emission increases result not only from industrial expansion and use of fossil fuel, but also from a growth in the number of vehicles, poor traffic management, energy subsidies, inefficient public transportation, ageing cars and congested roads, especially in the Mashriq sub-region. In GCC countries, power, petrochemical, aluminium and fertilizer plants, as well as motor vehicles are the primary sources of CO2 and other air pollutants, such as SO2 and NO2. Fine particles from seasonal sand and dust storms add to the air pollution burden in the whole region. Air pollution has a considerable impact on human health. In Jordan, for example, it is estimated that over 600 people die prematurely each year due to urban air pollution, while another 10,000 disability adjusted life years (DALYs) are lost annually due to related illnesses[515].
Addressing the urban challenges
Government responses to these challenges have been varied and thus far inadequate. To curb growth in slum areas, the GCC guarantees housing for all citizens. Some countries have developed energy efficiency codes and standards for buildings and home appliances. Efforts to create integrated waste management programmes, and to monitor and legislate air pollution are underway. In their efforts to alleviate urban air pollution, all GCC countries, as well as Lebanon, Syria and the OPT, have introduced unleaded gasoline (see Box 6.38). To meet global market specifications, refineries in Kuwait, Saudi Arabia, Bahrain and the UAE have pledged to reduce sulphur content in petroleum products. Gas flaring and other hydrocarbon releases are decreasing.
|
Box 6.38 Phasing out leaded gasoline in Lebanon[516] |
|
The introduction of unleaded gasoline and the use of catalytic converters in Lebanon decreased lead emissions from some 700 tonnes/year in 1993 to almost 400 tonnes in 1999. However, lead concentrations at monitored urban and suburban locations still average 1.86 ?/m3 and 0.147 ?/m3 respectively. These levels are much higher than in countries where leaded gasoline has been completely phased out. The cost of lead-related pollution in Lebanon is estimated at US$28–40 million/year, or 0.17 to 0.24 per cent of GDP, associated mainly with impaired neurological development in children. This is a reason to continue vigorously with measures to reduce lead emissions. |
Policies aimed at switching to natural gas are another response to mitigate air pollutants and GHG emissions. Planned regional integration of gas projects, such as the natural gas pipeline or Dolphin Project, which is expected to deliver 82 million m3 of Qatar gas to the UAE in 2005, will improve energy availability, economic efficiency and environmental quality[517]. Some countries have been developing and promoting renewable energy resources, such as wind and solar energy (see Box 6.39).
|
Box 6.39 The Gulf’s first wind power plant[518] |
|
The first wind power plant on the Arabian Peninsula was inaugurated in 2004 in the UAE. The US$2.5 million plant, located on the Island of Sir Bani Yas, off Abu Dhabi Emirate, will generate 850 kilowatts of electricity to power a seawater desalination plant. If shown to be cost-effective, wind-powered desalination could be introduced elsewhere in the GCC region. |
Assessing urbanization’s full impact on West Asia’s environment continues to be an elusive goal. Major efforts are needed in multisectoral planning, monitoring, legislation and public awareness campaigns in the sectors concerned. Harmonized approaches and data collection need to be applied across countries to enable better comparative and regional assessments. The recent creation of a Beirut-based regional monitoring organization to coordinate efforts in the different countries is a step towards this goal. Without the legislative power to enforce changes, however, these efforts will remain ineffective.
Peace, Security and the Environment
War and conflict
Armed conflict in West Asia has harmed human wellbeing, and resulted in the degradation of natural resources and ecological habitats. While the impacts are severe, reliable data remain scarce, except for a few selected locations[519], making long-term assessment difficult.
The Gulf War of 1990–1991 resulted in serious environmental damage, especially in Iraq, Kuwait and Saudi Arabia, and is fully documented in previous GEO editions and other reports[520]. Fifteen years later, ecosystems are still showing clear symptoms of damage[521]. The situation further deteriorated during the 2003 invasion of Iraq. The construction of military fortifications, laying and clearance of mines, and movement of military vehicles and personnel severely disrupted Kuwait’s and Iraq’s ecosystems and protected areas[522]. In the desert, these activities accelerated soil erosion, and increased sand movement, along with dust and sandstorms.
In Iraq, concern has risen over the use of depleted uranium munitions in the wars of 1991 and 2003[523]. In addition, even several years after the end of major wars, unexploded ordnance (UXO) and land mines are still killing civilians and hampering reconstruction[524]. A detailed assessment of five priority industrial areas revealed serious threats to human health and the environment, and called for urgent action to contain hazardous materials[525].
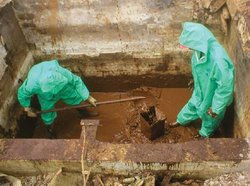 Removal of contaminated sludge from electroplating tanks in Al-Qadissiya. (Credit: UNEP/Post Conflict Branch 200)
 In the armed conflict in Lebanon in 2006, extensive oil pollution occurred along the country’s coast after Israeli bombers hit the Jiyeh power station oil depots, south of Beirut. Environmentalists have described it as the worst environmental disaster in Lebanon’s history[526], with additional threats to human health from air and water pollution.
The cumulative impact of decades of occupation and neglect in the OPT has resulted in serious environmental problems, including the degradation of scarce water resources, and pollution by solid and liquid waste[527].
The consequences of these wars include the disruption of health services, deepened poverty, destroyed institutions and the inability to enforce environmental legislation[528]. Among children under five in Baghdad, for example, 7 out of 10 suffered from diarrhoea between 1996 and 2000, due to the lack of clean water, poor sanitation and large amounts of uncollected garbage[529]. The non-violent death rates in Iraq increased in 2005 and 2006, which may reflect deterioration in health services, and environmental health[530].
The issue of refugees and internally-displaced people in West Asia cannot be overemphasized. Successive wars have increased their numbers to about 4 million[531]. They live in poor socio-economic conditions, with high population densities and inadequate basic environmental infrastructure, adding pressure to fragile environments. Dense populations in Gaza’s refugee camps contributed to aquifer depletion, which resulted in saltwater intrusion and saline water unsuitable for irrigation[532]. During the 2006 hostilities along the borders of Israel and Lebanon, about 1 million people were temporarily displaced in Lebanon alone, in addition to those displaced in northern Israel, raising serious concerns over their well-being[533].
War results in heavy infrastructural damage. Bombardments of military and civilian targets resulted in altered Iraqi and Lebanese rural and cityscapes. In the OPT, occupation forces demolished a major section of the Jenin refugee camp[534]. The economic infrastructure in the Gaza Strip was damaged in the May 2004 hostilities, aggravating existing environmental problems[535].
About 150,000 land mines were placed indiscriminately in Lebanon between 1975 and 1990[536]. In Iraq, the total number of individual UXOs may range from 10,000 to 40,000[537]. UNEP’s preliminary post-conflict assessment of the recent conflict in Lebanon indicated that approximately 100,000 unexploded cluster “bomblets” were identified, a figure that is expected to rise[538]. The detonation of UXOs potentially releases contaminants into the air and soil.
Addressing the impacts of war
The hidden and long-term environmental cost of war in the region is enormous, and cannot be easily estimated. Since the 1990 Gulf War, a mechanism to address environmental claims resulting from wars and conflicts was introduced. Countries neighbouring Iraq have submitted environmental claims for compensation from Iraq through the United Nations Compensation Commission[539]. This mechanism could help prevent policies that threaten human and environmental well-being. On-site response to war-related environmental damage in affected countries has included monitoring and assessment of damage, mine clearance, and cleaning and restoration measures. Internationally, some conflict resolution techniques have been implemented, including agreements, mutual understandings, the promotion of peace, cultural exchanges and other reconciliation measures.
Polar Regions
Drivers of Change
Governance
There have been major political events in the Arctic since the 1987 report of the World Commission on Environment and Development, Our Common Future. The dissolution of the Soviet Union was followed by a drop of one-quarter in the population in the Russian Arctic[540], and the withdrawal of government support to indigenous economies[541]. There has been some political restructuring in the Arctic, in part inspired by international human rights development. It includes some delegation of management authority to local people in Finland and Scandinavia, and increases in indigenous self-government in Canada and Greenland[542]. The settlement of land claims, and associated changes in resource management and ownership, starting with the Alaska Native Claims Settlement Act 1971, continue to be important political trends in the North American Arctic.
[[Antarctic]a] is subject to sovereignty claims that are not universally recognized. The continent was without a governance regime until the Antarctic Treaty in 1959. The Antarctic is now governed by an international multilateral regime, under which measures are implemented through domestic legislation. Today, 46 nations, including all but one of the Arctic nations, are parties to the Antarctic Treaty. The system is centred on principles of peaceful use, international scientific cooperation and environmental protection. The current treaty signatories, along with invited expert and observer groups, meet on an annual basis to effectively govern the region, and provide a forum for discussion and resolution of issues. The most significant legal development since 1987 was the 1991 Protocol on Environmental Protection, which designated Antarctica as “a natural reserve devoted to peace and science.” In 2005, Annex VI to the Protocol was adopted, addressing liability for environmental emergencies in the Antarctic region.
By contrast, large parts of the Arctic have governance regimes based on state sovereignty. The Arctic includes all or part of eight nations: Canada, Denmark (Greenland), Finland, Iceland, Norway, the Russian Federation, Sweden and the United States. National domestic laws remain the primary legal controls in the Arctic. Since 1987, a series of “soft law” agreements and cooperative arrangements have been created[543] at both regional and circumarctic levels. The Arctic Environmental Protection Strategy (1991) was absorbed into the work of the newly-formed Arctic Council in 1996. The council develops assessments, recommendations and action plans on a broad range of environmental and socio-economic issues. It is composed of the eight Arctic nations, six indigenous peoples’ organizations, who sit on the council as permanent participants, and additional nations and international organizations holding observer status.
Multilateral environmental agreements
Multilateral environmental agreements (MEAs), and international policies and guidelines play an increasing role in both polar legal systems. The concept of sustainable development and the MEAs that embrace it have had a profound resonance in the Polar Regions, particularly in the vulnerable Arctic.
Integrating sustainability of Arctic communities and the natural environment are key components of circumarctic agreements and programmes[544]. This is only possible with reference to the aspirations, traditional lifestyles and values of indigenous and local people, and with their involvement in decision making. Monitoring and projections from scientific models demonstrate that these MEAs can be effective. However, the current suite of MEAs is inadequate to meet the challenges from climate change and the many harmful substances that remain unregulated internationally. In common with other parts of the world, progress in implementing these actions has been relatively slow, despite the institutionalization of sustainability principles[545].
Selected Issues
The Polar Regions are among the world’s last great wilderness areas, but they are undergoing rapid and accelerating change, stressing ecosystems in both the Arctic and Antarctic, and affecting the well-being of Arctic residents. These regions are of vital importance to the health of the planet (see Box 6.40), and the changes are of global significance.
|
Box 6.40 Global-scale ecosystem services provided by the Polar Regions[546] |
|
Regulate climate Without the global thermohaline marine current exchanging waters between the Polar Regions and the tropics (see Box 6.42 and [[Chapter4 (Global Environment Outlook (GEO-4): Chapter 6)]13]), the tropics would become much warmer (or too hot), while polar and temperate regions would become much colder. Store freshwater They account for about 70 per cent of the world’s total water stored as ice. Provide resources The Arctic holds 28 per cent of the global marine commercial fish catch. Antarctic fisheries add 2 per cent. The Arctic has rich mineral resources, and undeveloped stores of oil and gas, including an estimated 25 per cent of the world’s undiscovered petroleum reserves. Store carbon The Arctic stores one-third of the global carbon pool, an important sink for greenhouse gases (GHGs). Support migratory species About 300 species of fish, marine mammals and birds migrate between the Polar Regions and mid-latitudes each year. Between 500 million and 1 billion birds annually connect with almost every part of the globe. More than 20 whale species migrate between polar and tropical waters. Form an essential part of our global heritage [[Antarctic]a] is by far the largest wilderness area on Earth, while 7 of the 11 other largest wilderness areas are in the Arctic. These are crucial not only for tangible ecosystem services, such as the preservation of biological diversity, but also for intrinsic values related to aesthetics and culture. |
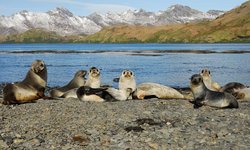 Antarctica has no native terrestrial vertebtrates, but large populations of seals go there to breed. Above are Antarctic fur seals. (Credit: S. Meyers/Still Pictures)
 There are important geographical and political distinctions between the Arctic and Antarctic. About 4 million people live in the Arctic, of whom approximately 10 per cent are indigenous[547]. The Antarctic has no indigenous population; the only residents are transient scientists and staff in research stations. The Arctic is a partially-frozen ocean, surrounded by a diversity of landscapes, including sparsely-vegetated barren lands, tundra, wetlands and forests, influenced by ice, seasonal snow cover and permafrost. There are low numbers of known terrestrial species compared to mid-latitudes, but large and widespread populations of key species, several of which are of major importance to indigenous and local cultures and economies. Agriculture in the Arctic is severely limited, and subsistence economic activities mainly involve hunting and fishing, reindeer herding, trapping and gathering.
Antarctica, a continent surrounded by ocean, is 99 per cent ice covered[548], with no native terrestrial vertebrates, but large populations of marine birds and seals go there to breed. The small crustacean, krill, is the basis of the Southern Ocean food web, which supports fish, marine mammals and birds.
Climate change, the accumulation of persistent toxic substances and pollutants, damage to the stratospheric ozone layer, and increasing development and commercial activity are examples of globally-driven issues that have particularly affected Polar Regions. Over the past 20 years, polar research and assessment, along with the direct involvement of Arctic residents, particularly indigenous peoples, have been instrumental in understanding the impacts, and in bringing these issues to the world’s attention.
Climate Change
Melting ice: a local and a global threat
Impacts occur faster in the Polar Regions
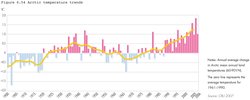 Fig 6.54 Arctic temperature trends.[58]
 Global increases in population, industrialization, expanding agriculture and deforestation, and the burning of fossil fuels have resulted in rising atmospheric concentrations of GHGs, and dramatic changes in land cover. Scientists agree that it is very likely that most of the observed increase in global temperatures in the past half-century is due to human additions of GHGs to the atmosphere[549]. It is a major issue for the Polar Regions because these regions are experiencing impacts faster and to a greater extent than the global average, and because climate change in the Polar Regions has major implications for the Earth.
Climate change is accentuated in the Polar Regions, mainly because of feedback mechanisms related to shrinking ice and snow cover (see Chapters 2 and 7 (Global Environment Outlook (GEO-4): Chapter 6)). The Antarctic shows complex temporal and spatial patterns of both warming and cooling, with the most pronounced warming along the Antarctic Peninsula[550]. The Arctic is warming almost twice as fast as the world average[551], and most increases occurred in the past 20 years (see Figure 6.54), causing shrinking and thinning of sea ice (see Figure 6.55), melting glaciers and changing vegetation. The land and the sea absorb more heat when there is less ice and snow, resulting in the melting of more ice and snow. Thawing of frozen peat bogs is releasing methane (a potent GHG) at some sites, but it is not known if the circumpolar tundra will be a carbon source or sink in the long-term[552].
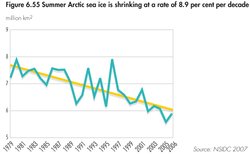 Fig 6.55 Summer Arctic sea ice is chrinking at a rate of 8.9 percent per decade.[59]
 In 2005, the world’s first major regional multistakeholder climate change assessment, the Arctic Climate Impact Assessment (ACIA) was released. It included comprehensive reviews of the state of knowledge on climate variability and change, and on current and projected impacts and vulnerabilities, and it incorporated perspectives based on Arctic indigenous peoples’ knowledge. Some major observed trends identified in the ACIA 2005 include:
- sharply rising temperatures, especially in winter, and particularly in Alaska, northwestern Canada and Siberia;
- rainfall increasing but snow cover decreasing;
- glaciers melting and summer sea ice shrinking;
- river flows increasing;
- North Atlantic salinity reducing; and
- thawing of permafrost, and decreasing periods of ice cover on lakes and rivers, in some areas.
These observed changes have wide-ranging impacts on plants, animals and the well-being of Arctic residents (see Box 6.41 and Box 7.8 in [[Chapter7 (Global Environment Outlook (GEO-4): Chapter 6)]3]). Impacts affecting people range from those related to melting permafrost and shorter ice seasons (damage to buildings, and shorter seasons for winter roads), to warmer and less predictable weather (more forest fires in some regions, and problems travelling on frozen rivers and through snow for reindeer herders and hunters). Sea ice changes cause increased coastal erosion, necessitating the relocation of coastal communities, such as Shishmaref, Alaska[553], and affecting marine hunters and fishers. Many impacts are indirect; for example, more melting and freezing of snow makes food less accessible to caribou and reindeer, affecting herders and hunters, their economies and cultural integrity. Future impacts are expected to be widespread, and include positive and negative changes, both in economic opportunities and in risks to the environment. One of the big factors is the potential for changes in access due to more open Arctic marine shipping routes[554].
|
Box 6.41 From algae to polar bears, climate change is affecting Arctic biota at many scales[555] |
|
The Arctic tundra is a land of meltwater lakes, meandering rivers and wetlands. Analysis of algae in sediment cores from 55 circumpolar Arctic lakes revealed dramatic regime shifts in many lakes over the past 150 years. Lakes have become more productive, and there are more species of algae in the shallow lakes. These ecosystem changes are triggered by climate warming; they are more marked at higher latitudes, and they correspond in timing to climate warming inferred through records such as sediment cores and tree rings. Changes at the base of the aquatic food chain can be expected to have far-reaching effects on other life in and around the lakes. Polar bears depend on sea ice for hunting, and use ice corridors to move from one area to another. Pregnant females build winter dens in areas with thick snow cover, and need good spring ice conditions to find food. The mothers emerge with their cubs in the spring, and have not eaten for 5–7 months. Late sea ice formation in the Arctic autumn and earlier breakup of ice in the Arctic spring means a longer period of fasting. During the past two decades, the condition of adult polar bears in western Hudson Bay in Canada has declined. There was a reduction of 15 per cent both in average adult body weight and in the number of cubs born between 1981 and 1998. Some climate models project that if GHG emissions are not curbed drastically there will be an almost complete loss of summer sea ice in the Arctic before the end of this century. Polar bears, along with other marine mammals, such as seals, are unlikely to survive in such a changed environment. 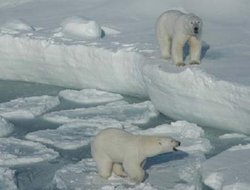 Polar bears. (Credit: Jon Aaars/Norwegian Polar Institute) Polar bears. (Credit: Jon Aaars/Norwegian Polar Institute) 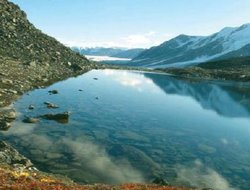 Arctic meltwater lake. (Credit: J. Smol) Arctic meltwater lake. (Credit: J. Smol) |
Increased attention is being paid to climate change impacts on Antarctic ecosystems, including new research through the International Polar Year (2007–2008). Seasonal and regional variations in the extent of sea ice have large impacts on ecosystem processes[556]. Krill, the food source for many birds, fish and marine mammals, rely on the algae that live in sea ice, and cannot survive without ice cover[557]. Many seabirds are significantly influenced by rising temperatures[558], and changes in winter sea ice conditions affect the populations of three of the most ice-dependent species: Adélie penguins, Emperor penguins and Snow petrels[559]. Even a small increase in temperature may allow the introduction of non-native plant and animal species that affect native biodiversity.
Global impacts of polar climate change
There are many ways in which the major changes observed and projected for the Polar Regions influence the environment, the economy and human well-being around the globe. Two of the most fundamental of these are ocean circulation and sea-level rise.
The role of the Polar Regions as a driver of ocean circulation (see Box 6.42) is of enormous significance, because of their influence on global climate regimes. For instance, part of this ocean circulation warms Europe by 5–10°C, compared to what would be expected at this latitude. Breakdown of thermohaline circulation could precipitate an abrupt change in global climate regimes[560]. The global sea level has been rising at a rate of about 3 millimetres/year since 1993, compared to less than 2 mm/year over the previous century[561]. This increased rate is very likely due to human-induced climate change, primarily through thermal expansion of warming oceans, and freshwater from melting glaciers and ice sheets[562]. The Greenland and Antarctic ice sheets have the potential to be the largest contributors, because they store so much ice. The rate at which polar ice sheets are contributing to sea-level rise is faster than previously predicted, and there is a lot of uncertainty around the future of the ice sheets. Until a few years ago, most scientists studying the ice sheets believed that the biggest immediate impact of global warming was that it would lead to mass loss from increased surface melting. While increased melting is certainly a concern, it appears that other mechanisms may be at least as important. For example, meltwater reaching the base of the ice causes the ice to flow faster. This accelerated flow is a far more efficient way of rapidly losing large amounts of ice mass than surface melting[563]. These dynamic processes of mass loss are not well understood and current models that project future sea-level rise are not able to take them fully into account[564]. This means that there is a lot of uncertainty around projections of future sea-level rise.
|
Box 6.42 Polar Regions and ocean circulation[565] |
|
The circulation of water through the oceans is partly driven by differences in density of seawater, determined by temperature and salt content (see [[Chapter4 (Global Environment Outlook (GEO-4): Chapter 6)]14]). The formation of deep, dense seawater in the Arctic and Antarctic drives this “ocean conveyor belt.” This process is disrupted by warming and freshening of surface water, reduction in sea ice and melting of glaciers and ice sheets. Evidence shows that circulation of the deep, cold water of the North Atlantic conveyor belt may have slowed by as much as 30 per cent over the past 50 years. In the Antarctic, recent increases in precipitation have reduced the salinity of surface layers, weakening deep-water formation that drives the southern conveyor belt. |
Studies of the Greenland Ice Sheet show that ice melt and calving of icebergs is occurring at a greater rate than new ice is being formed[566]. A rise of 3°C in the average annual temperature in Greenland is likely to cause the ice sheet to slowly melt away, leaving only glaciers in the [[mountain]s]. If GHG emissions rise at currently projected rates, it is expected that by the end of this century the average temperature will be above this tipping point. The meltwater could raise the sea level 7 metres over a period of 1,000 years or more[567].
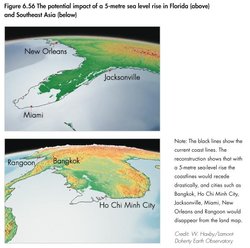 Fig 6.56 The potential impact of a 5-metre sea level rise in Florida (above) and Southeast Asia (below). (Credit: W. Haxby/Lamont-Doherty Earth Observatory)
 In [[Antarctic]a], there are two giant ice sheets: the West and the East Antarctic Ice Sheets. Together they account for about 90 per cent of the world’s freshwater ice[568], and changes to them would have huge global repercussions. The West Antarctic Ice Sheet is particularly vulnerable, and recent evidence points to instability[569]. Three large parts of ice shelves in the Antarctic Peninsula have collapsed over the past 11 years, followed by a marked acceleration and thinning of glaciers that previously fed the shelves[570]. Over the last decade, the grounded ice shelf in the Amundsen Sea, and ice shelves in Pine Island Bay have thinned significantly; in the latter area there has been a tenfold reduction in ice mass in the past decade[571]. Some experts think that a full collapse of the West Antarctic Ice Sheet is conceivable in this century[572]. Were this to happen, the sea level would rise by about 6 m[573] (see Figure 6.56).
The East Antarctic Ice Sheet is more stable, and increased snowfall has resulted in local mass gains, which partially compensate for the contributions to the oceans of water from the West Antarctic and Greenland ice sheets, and mountain glaciers[574]. However, a 2006 satellite-based estimate of overall losses and gains of the Antarctic ice sheets concluded that there was a net loss of 152 ±80 cubic kilometers of ice annually between 2002 and 2005[575].
Responding to climate change
There are two policy response categories to climate change from the polar perspective: accelerate efforts to reduce GHG emissions and, at the same time, adapt to changing conditions. The policy document issued by the Arctic ministers through the ACIA[576] recognizes that action must be taken both on mitigation and adaptation, and establishes broad guidelines for action. Recommended mitigation actions include meeting commitments under the Kyoto Protocol in reducing GHG emissions.
Adaptation measures include identifying vulnerable regions and sectors, assessing risks and opportunities associated with climate change, and developing and implementing strategies to increase the capacity of Arctic residents to adapt to change (see Box 6.43).
|
Box 6.43 Hunters adapting to climate change[577] |
 Inuit use of modern technoloy in hunting at the ice edge as an example of climate change adaptation by Arctic residents. (Credit: Roger Debreu/CIS) Inuit use of modern technoloy in hunting at the ice edge as an example of climate change adaptation by Arctic residents. (Credit: Roger Debreu/CIS) An example of climate change adaptation by Arctic residents is Inuit use of modern technology in hunting at the ice edge. Because of rapid change, ice conditions are becoming increasingly difficult to predict based only on traditional knowledge. Satellite imagery is now also used routinely by indigenous hunters in the Canadian Arctic as a tool for safe and efficient navigation in the icescape. |
As Arctic nations are responsible for 40 per cent of global carbon dioxide emissions (see [[Chapter2 (Global Environment Outlook (GEO-4): Chapter 6)]8])[578], implementing these recommendations would have a significant positive impact globally. However, the world’s response has been slow, and emissions continue to rise, while the scale of this issue and the lag time between action and ecosystem response require immediate action, both on mitigation and on adaptation. To protect environmental quality, biodiversity and human wellbeing, policy responses must take cumulative impacts into consideration, and all polar policies now need to be evaluated in the context of climate change.
Persistent Pollutants
Contamination
Many toxic chemicals released into the environment from industry and agriculture at lower latitudes are transported to the Polar Regions by wind, ocean currents and migratory wildlife[579]. Persistent organic pollutants (POPs), such as DDT and PCBs, are long-lived, fat-soluble chemicals that build up to higher levels through the food chain. Arctic animals are especially vulnerable, since they store fat to survive when food is not available. Metals differ from POPs in that they occur naturally in the environment, but levels are elevated as a result of industrial activities around the world, including transport (lead), coal burning (mercury) and waste disposal. There are also local sources of industrial metals in the Arctic, especially the smelters on the Kola Peninsula and at Norilsk in Russia. Emissions of metals transported through the air from industry in Europe and Asia, however, are the largest sources[580]. The Arctic Monitoring and Assessment Programme of the Arctic Council (AMAP) and national programmes research and report on toxics in the Arctic[581]. Some results of this work are shown in Figure 6.57. The graph shows declining levels of regulated POPs, and rising levels of mercury in the eggs of Thick-billed murres on Prince Leopold Island, Nunavut, Canada. In the past 20–30 years, DDT and PCBs have generally declined in Arctic animals, while mercury has risen in some species and regions, and remained unchanged in others. Rising mercury levels may be from anthropogenic sources, from ecosystem changes related to climate warming, or a combination of these factors.
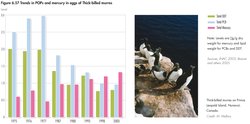 Fig 6.57 Trends in POPs and mercury in eggs of Thick-billed murres (left) and Thick-billed murres on Prince Leopold Island, Nunavut, Canada (right). (Sources: INAC 2003, Braune and others 2005 (left)[60]; Credit: M. Mallory (right))
 The levels of POPs that are banned or being phased out tend to be lower in Antarctic animals than in Arctic animals, though high concentrations of PCBs have been found in south Polar skuas[582]. In [[Antarctic]a], limited work on mercury indicates that the increases seen in some Arctic seabirds are not occurring in the Antarctic. Feathers of King penguins collected in 2000–2001 showed a reduction in mercury concentrations of 34 per cent compared with levels in feathers from a 1970s collection[583]. Types of POPs that are still in use and are not adequately regulated continue to build up in both Polar Regions in birds, seals and whales, and, in Antarctica, in ice and krill[584].
POPs and mercury pose a threat to the integrity of traditional food systems and the health of indigenous peoples (see Chapters 1 and 5 (Global Environment Outlook (GEO-4): Chapter 6)). The highest exposures – to Inuit populations in Greenland and northeastern Canada – are linked to consumption of marine species as part of traditional diets. Unborn and young children are most susceptible[585]. There are also potentially widespread impacts on polar animals. Effects that have been demonstrated include reduced immunological response in polar bears, leading to increased susceptibility to infection, multiple health effects in glaucous gulls and reproductive failure from eggshell thinning in peregrine falcons[586].
Response measures
Balancing and communicating the risks of contaminants in relation to other health risks and against the known benefits of breastfeeding and eating a traditional diet continues to be a challenge[587]. Indigenous organizations, concerned about the safety of traditional foods, have taken a lead in directing and collaborating on studies, and on providing balanced information about risks and benefits of traditional foods[588].
Arctic indigenous peoples’ organizations, working with the Arctic scientific community and AMAP, have pushed for international action on POPs, and directly participated in developing the global Stockholm Convention on POPs, which entered into force in 2004, and commits governments to reducing and eliminating the use of specific POPs. This success story of circumpolar cooperation between indigenous peoples and scientists[589] is now looked upon as a model for taking global action on climate change.
There is still work to be done on the issue of POPs in Polar Regions. POPs now in use, such as brominated flame retardants, are accumulating in polar ecosystems[590], and are not yet included in the POPs convention. Although there are moves to find alternative products, many of these chemicals remain in widespread and increasing use[591]. In the Arctic, there are also local sources of POPs from past industrial and military activities, and from electric installations in Russia. As a response to this, the Arctic Council initiated a project to assist Russia in phasing out PCBs and managing PCB-contaminated waste[592]. In addition, the 1998 Protocol on Heavy Metals of the Convention on Long-Range Transboundary Air Pollution (the Protocol came into force in 2003), calls for a reduction in emissions of mercury, lead and cadmium to below 1990 levels[593].
Ongoing monitoring and assessment of trends is needed to determine whether these international control measures are reducing toxic substances in polar environments, and to assess emerging issues. This includes identifying problem toxic substances currently in use, and assessing how climate change interacts with the accumulation of toxic substances in plants and animals.
Damage to the Ozone Layer
Ozone-depleting substances
The use of ozone-depleting substances leads to destruction of stratospheric ozone. This destruction has been most dramatic in the Antarctic, but the stratosphere over the Arctic is also affected. In September 2006, the Antarctic ozone hole was the largest recorded[594]. The ozone layer over the Arctic is not pierced by a hole as in the Antarctic, but in the winter of 2004–2005 it was the thinnest layer on record[595] (see [[Chapter2 (Global Environment Outlook (GEO-4): Chapter 6)]9]).
When the Antarctic ozone hole occurs, most of the coast is covered with 2–3 m of seasonal sea ice, which acts as a protective barrier for marine organisms. Microalgae in the sea ice are potentially adversely affected by increases in ultraviolet (UV-B) radiation resulting from ozone depletion[596], and a reduction in sea ice may affect primary production in the entire region. Even with the ozone barrier, enough UV-B is transmitted through the annual ice to damage or kill embryos of the sea urchin Sterechinus neumayeri[597].
In the Arctic, young people today are likely to receive a lifetime dose of UV-B that is about 30 per cent higher than any prior generation, with increased risk of skin cancer. Studies show that increased UV-B is causing changes to Arctic lakes (see Chapter 2), forests and marine ecosystems[598]. Despite the Montreal Protocol’s success in markedly reducing ozone-depleting substances, the ozone layer’s recovery is expected to take more than another half century[599].
Increasing Development and Commercial Activity
Multiple development pressures – cumulative impacts
The biggest and fastest-growing development in the past 20 years in the Arctic is the expansion of oil and gas activity to meet growing global energy needs. Arctic oil and gas activity has been focused on onshore oil development in Siberia, the Russian Far East and Alaska. There has been offshore activity in the Barents and Beaufort Seas. Expanded, new and proposed petroleum developments, including access corridors and pipelines, are at various stages of preparation and implementation around the Arctic, especially in Siberia, Alaska, the Canadian western Arctic and the Barents Sea.
Minera exploitation in the Antarctic is prohibited under the 1991 Protocol on Environmental Protection to the Antarctic Treaty. The effect of the protocol on rights relating to the exploitation of Antarctic seabed resources arising from the United Nations Convention on the Law of the Sea has not yet been tested. Mining is widespread in the Arctic, and has decreased in some areas and expanded in others. At the same time, logging has decreased overall in northern Russia, but expanded in some regions of Siberia, and remains an important economic activity in northern Scandinavia and Finland[600].
There are many pressures associated with these activities, including emissions, leaks, spills and other releases of contamination from operating and decommissioned mines and oil facilities. As well, there are impacts that build up slowly with piecemeal development, such as habitat fragmentation and disturbance to wildlife (see Box 6.44). Spills in Arctic marine and coastal regions could have disastrous consequences for the livelihoods of residents who hunt and fish in these regions.
|
Box 6.44 Habitat loss and fragmentation[601] |
 Caribou, Rangifer tarandus - bull in fall colours in the Denali National Park, Alaska. (Credit: Steven Kazlowski/Still Pictures) Caribou, Rangifer tarandus - bull in fall colours in the Denali National Park, Alaska. (Credit: Steven Kazlowski/Still Pictures) The destruction and breakup of large areas of habitat into patches has negative impacts on many species. Some examples of observed trends and impacts related to Rangifer (caribou and reindeer) include:
|
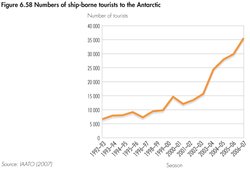 Fig 6.58 Numbers of ship-bourne tourists to the Antarctic.[61]
 Development pressures, such as global energy demands, combine and interact with climate change, persistent toxics and other pressures on polar ecosystems. In the marine environment, commercial fishing (see Chapter 4) is a significant pressure for both polar regions, including the ongoing problem of illegal, unregulated and unreported (IUU) fishing. In Arctic waters, increased shipping brings increased risk of spills, contamination and disturbance to wildlife. In the Antarctic, even the growth of scientific activities adds new pressures, as does bioprospecting[602]. The search for naturally occurring chemicals that may have commercial applications currently takes place in the Antarctic without dedicated management.
Furthermore, there is a diversifying and expanding tourism industry in the Antarctic (see Figure 6.58) that has seen a great increase in ship-borne passengers[603]. The Antarctic Treaty Consultative Meeting (ATCM) is examining the regulation of tourism[604]. The increase in visitors, combined with changing conditions related to global warming, risks the introduction of non-native species to this isolated part of the world[605] (see [[Chapter5 (Global Environment Outlook (GEO-4): Chapter 6)]5]).
Economy, environment and culture: striking a balance
Long-term planning and effective environmental policies are needed to balance economic development with environmental and cultural considerations. Increasingly, cumulative effects are considered when impacts of large-scale industrial development in some parts of the Arctic are assessed[606]. However, smaller projects and infrastructure are rarely assessed in terms of their cumulative effects and in terms of how they interact with impacts from other developments and climate change (see Box 6.45). Countering the combined actions of many pressures represents one of the most serious gaps in the Arctic management regime[607]. Effective measures include integrated planning that incorporates protection of representative ecosystems, key habitats and vulnerable areas, especially along the Arctic coastline.
|
Box 6.45 The importance of monitoring and assessing species distribution and abundance[608] |
|
Climate change is the big unknown factor in assessing vulnerability, and projecting cumulative impacts from multiple pressures. Polar bears are threatened by the accumulation of POPs at the same time as their primary habitat, coastal ice, is shrinking due to climate change (see Box 6.41). An assessment of the interactions between contaminants and climate change concluded that it is difficult to predict whether climate change will lead to decreased or increased contaminant levels in Arctic ecosystems in the long-term, because there are so many factors to consider. There may be changes in [[wind]s], ocean currents and temperatures, and even changes in migration patterns of birds and fish that carry contaminants from lower latitudes. The Canadian population of the Ivory gull, which lives along the ice edge year-round, has declined by 80 per cent since the early 1980s, with a total count in 2005 of only 210 birds, and there are indications that the species may be declining in the rest of its range. There are several factors that singly or in some combination could be implicated in this decline, including changes in sea ice in the winter range, hunting during migration through northwest Greenland, disturbance from diamond exploration and high levels of mercury in their eggs. These examples highlight the importance of monitoring and assessing species distribution and abundance to detect and respond to changes in biodiversity. Recent initiatives have identified gaps, and recommended improvements in Arctic monitoring and assessment[609]. The Circumpolar Biodiversity Monitoring Programme was launched by the Arctic Council to improve monitoring and assessment of biodiversity and ecosystems to help meet the Arctic target of the Convention on Biological Diversity. |
Throughout the Arctic, governments and industry face great challenges in minimizing environmental and social impacts, and in including local residents in decision making for new and expanding developments. Priorities in responding to these issues include ensuring that local residents share in the opportunities and benefits from petroleum development, and that adequate technology, policy, planning and systems are in place to protect vulnerable regions, and to prevent and respond to accidents.
In the Antarctic, monitoring of cumulative impacts and consideration of management measures based on the precautionary approach are under discussion[610]. Site-specific guidelines have been adopted, but the question remains whether this will be sufficient for comprehensive protection.
Regional Environmental Challenges
Progress has been made, challenges remain
Countries in developed regions have progressively invested in solving “conventional” or easy-to-manage environmental problems, and have achieved relative success, but such issues are still daunting to developing nations. Since the mid-1980s, many global conferences on the environment have been convened, a diversity of multilateral environmental agreements have been adopted (see Figure 1.1), and governments and other stakeholders continue to pursue sustainable development. But challenges remain as environmental issues become more complex and onerous. They are often cumulative, diffuse, indirect and/or persistent. For example, as Europe and North America addressed discrete and obvious pollution sources (point sources), they found they needed to deal with diffuse and scattered non-point sources. Non-point pollution is often hard to control, and its impacts difficult to measure. The Polar Regions identified cumulative and interacting pressures as a key priority. The causes, consequences and solutions for such complex problems cut across economic sectors and political portfolios. All regions are now aware of the health and economic costs associated with air pollution, including weather-related hazards. They are also aware of the savings to be had through prevention and mitigation.
The world’s most crucial environmental challenges, such as climate change, start with many actions at the local level that accumulate to have global effects. The reach and magnitude of transboundary issues is seen in the impacts of persistent organic pollutants on the Polar Regions, and the distances travelled by dust storms. New environmental issues arise quickly, and can have important human health impacts before existing policies can be used, or new policies put in place to address them. Examples of such new issues include: electronic waste, pharmaceuticals, hormones and other organic contaminants, and commercial exploitation of the Antarctic. As pointed out by the Polar Regions, a very important lesson learned is that there is a long lag time between dealing with complex global environmental issues and seeing improvements, as is the case with climate change.
In addition to complexity, progress in addressing regional environmental issues is challenged by counteracting forces and diminishing returns. For example, gains in potable water provision in many urban areas are being offset by the rising numbers of urban residents, for example, in North East Asia. In some regions, improved energy efficiency is being offset by an increase in the number of cars and other energy uses. Increased consumption and production, coupled with a lack of prevention often outstrips efficiency gains in waste management. Another limitation expressed in several regions is that despite progress in introducing environmental policies, there is inadequate monitoring to inform new environmental policies, regulations and other measures. Some report a lack of coordination among different decision making agencies, insufficient public participation or a lack of transboundary collaboration. This is, for example, a challenge in the Mediterranean Basin with its long, common history and geography, but large differences in culture and economic development. Box 6.46 describes inter-regional efforts to establish international implementation programmes in the Mediterranean.
|
Box 6.46 The Mediterranean Sea: taking a holistic approach[611] |
|
The Mediterranean Sea is bordered by 21 countries. More than 130 million people live permanently along its coastline, a figure that doubles during the summer tourist season. The sea and its shores are the biggest tourist destination on Earth. Because of its geographical and historical characteristics, and its distinctive natural and cultural heritage, the Mediterranean is a unique ecoregionLink title. Although the Mediterranean countries fall within three different GEO regions, the sea and the surrounding land mass must be dealt with as one ecosystem, with common issues and problems. Local, regional and national authorities, international organizations and financing institutions have devoted a great deal of effort to protecting the Mediterranean region’s environment, but many environmental problems continue to plague it. In recent decades, environmental degradation has accelerated. Valuable agricultural land is being lost to urbanization and salinization (80 per cent of arid and semi-arid areas in the southern Mediterranean countries are affected by desertification, as well as 63 per cent of the semi-arid land in the northern bordering countries). Scarce, overused water resources are threatened with depletion or degradation. Traffic congestion, noise, poor air quality and the rapid growth of waste generation are compromising urban standards of living and health. Coastal areas and the sea are affected by pollution and [[coast]lines] are being built up and/or eroded, while fish resources are being depleted. In short, overexploitation is disrupting the Mediterranean’s unique landscapes and biodiversity. In addition, the region is increasingly vulnerable to flooding, landslides, [[earthquake]s],tsunamis, droughts, fires and other ecological disturbances, which have a direct and immediate impact on the livelihood and welfare of a large proportion of the population. Although it is difficult and risky to assign specific values, the costs of environmental degradation are clearly very significant. In addition, environmental pressures are likely to increase considerably over the coming 20 years, especially in the tourism, transport, urban development and energy sectors. There are two major current initiatives to improve the state of the environment in the Mediterranean region. The Mediterranean Strategy for Sustainable Development, developed by UNEP’s Mediterranean Action Plan and adopted in 2005, focuses on seven priority fields of action: water resources management, energy, transport, tourism, agriculture, urban development, and the marine and coastal environments. Complementary to this is the Horizon 2020 initiative under the Euro-Mediterranean Partnership. The aim of this initiative is to “de-pollute the Mediterranean by 2020” through tackling all the major sources, including industrial emissions, and municipal waste, particularly urban wastewater. |
Inequities prevail
The 1987 Brundtland Commission report, Our Common Future, and subsequent global, regional and national processes have highlighted the need for sustainable development, which integrates improvements in economic, social and environmental well-being. Sustainable development calls for increased intra- and intergenerational equity, so that environmental goods-and-services are shared fairly among people today, and are passed on to future generations. As shown in this chapter, however, environmental inequities continue to grow. They exist in many of the world’s cities, where the poor are generally less well served by municipal water and waste systems, and are more exposed to pollution. The poor are the main victims of environmental degradation[612]. Indeed, poor people suffer more than the wealthy when water, land and the air are degraded and polluted. Not only are they deprived of livelihood options but their health is also impaired. In developing countries, environmental risk factors are a major source of health problems for the poor in particular[613].
The poor are also disproportionately affected by natural hazards. Before the devastating death tolls of the 2004 Indian Ocean Tsunami and the 2005 earthquake in Pakistan, from 1970 to 2002, some 3 million people, mostly in low-income countries, died as a result of natural disasters[614]. The majority of the rural poor live in ecologically fragile areas. The environments in which the urban poor live and work are often fraught with hazards. Faced with a disaster, they suffer more from the loss of income and assets, and have greater difficulty in coping with the aftermath. Climate change and environmental degradation increase the frequency and impact of natural hazards, such as droughts, floods, landslides and forest fires, which often lead to the loss of land, food insecurity and migration[615].
Another message in Chapter6 (Global Environment Outlook (GEO-4): Chapter 6) is that gender inequities with environmental links continue in many regions. In Africa and South East Asia, for example, women often have limited access to land, water and other resources, and they are exposed to the health risks of indoor air pollution from the burning of biomass fuels. In many cases, indigenous peoples also continue to face inequities related to land rights, access to resources, and provision of potable water and wastewater services, even in some developed countries.
Disparities in ecological impacts prevail
Although the regions have made significant progress in reducing some environmental threats since the 1980s, those with growing economies are suffering from increased traffic, waste and greenhouse gas emissions. Asia and the Pacific, for example, reports that its economic growth surpassed the 5 per cent suggested by Our Common Future, (the Brundtland Commission report) but ecosystems and human health continue to deteriorate. Biodiversity loss and global climate change have irreversible consequences that income growth cannot restore[616].
This chapter suggests that some progress on the environmental front in developed regions has been achieved at the expense of developing countries. This imbalance is expressed by the notion of “ecological debt.” Experts agree that this term describes the ecological damage that production and consumption patterns in some countries cause in others or in ecosystems beyond their borders, at the expense of the equitable rights to the ecosystem goods-and-services by those other countries or peoples[617]. For example, the outsourcing of energy, food and industrial production can increase efficiency in one region at the expense of others through the displacement of impacts (see Figure 6.59). The European regional perspective points out that the relocation of highly-polluting industries to Eastern European countries is contributing to higher energy use per unit of industrial output there, while improving energy efficiency and decreasing polluting emissions in Western Europe. Other examples include the export of electronic waste to Southeast Asia, where those who recycle it are exposed to hazardous materials, and the fact that Arctic peoples suffer the consequences of POPs that originate outside the region.
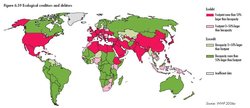 Fig 6.59 Ecological creditors and debtors.[62]
 A prime example of the disproportionate effect of developed regions on the global environment is the former’s generally higher per capita emission of greenhouse gases, which contribute to climate change, while impacts are and will be greater among the poor and other vulnerable people, nations and regions[618]. Poor people in tropical countries will be particularly vulnerable to climate change impacts, such as water shortages, declining crop yields and disease[619], while indigenous peoples in the Arctic suffer from the accelerated impact of climate change. Continued environmental degradation in all regions is unfairly shifting burdens onto future generations, and contradicts the principle of intergenerational equity.
One of Our Common Future’s recommendations was to remove subsidies for intensive agriculture, which are discussed in the introduction to this chapter. Since environmental assets, such as fish, forests and crops, make up a larger share of national wealth in developing countries than in high-income countries, subsidy reform can improve rural livelihoods, and increase the equity between developed and developing regions. The regional perspectives reveal that though there has been some recent progress in debt relief and subsidy reform, developing countries still face unfavourable trade policies and external debt burdens, while a number of developed countries continue to enjoy subsidies.
Economy and environment not mutually exclusive
Although there are signs that environmental issues are being addressed more holistically than they were 20 years ago, the environment is generally still treated “apart” from social and economic considerations. Asia and the Pacific, for example, notes the lack of integration between environmental and economic policies as the major constraint on effective environmental management in the region. As can be seen throughout this chapter, a “Northern” development model still prevails (one sign is the accelerating growth of urban development based on car dependency), and despite progress on some fronts there is too much evidence of development to the detriment of environment, and too few signs of environment for development.
 One sign of a "Northern" development model is the accelerating growth of urban development based on car dependency. (Credit: Ngoma Photos)
 Economic growth and environmental protection are not mutually exclusive; efforts towards poverty alleviation and environmental protection can be mutually reinforcing. Improving the productivity of environmental resources ([[soil]s] and fish stocks, for example), and investing in protecting and rehabilitating land and water resources can secure poverty reduction[620]. When the ecosystems on which the developing world’s rural poor depend are kept healthy enough to provide them with food and income-generating opportunities, they are less likely to migrate to already overcrowded cities and emigrate to other countries. The economic value of ecosystem goods-and-services needs to be fully recognized, and countries need to strengthen their national policies to fully incorporate these values. Given the observed ecological impacts, and the projected consequences for human well-being that all regions point to, climate change needs to be addressed in a more concerted and aggressive fashion in all regions, and by the international community.
Reducing extreme poverty and hunger, the first Millennium Development Goal (MDG), requires work towards achieving MDG 7, which refers to the sustainable management of land, water and biodiversity resources, and the adequate provision of urban sanitation, potable water and waste management[621]. Both poverty and consumption are factors in environmental degradation. All people – rich and poor, urban and rural, and in all the world’s regions – depend on environmental goods-and-services. The challenge is to foster “environment for development” in the developing world, while simultaneously slowing consumption in the developed world.
==Notes UNEP (2006d). The Regional Seas Programme, 2006 (Global Environment Outlook (GEO-4): Chapter 6) . United Nations Environment Programme (last accessed 22 April 2007). * {{note|525}UNEP (2005c). Assessment of Environmental “Hot Spots” in Iraq. United Nations Environment Programme, Nairobi.
- ↑ Christian Reformed Church (2005). Global Debt. An OSJHA Fact Sheet. Office of Social Justice and Hunger Action (last accessed 21 April 2007).
1 Comment
dubai property wrote: 10-13-2010 00:44:31
Great information for everyone seeking advice about relationships. I just loved the article you have written, specific, concise and great message. http://www.bayut.com