Earthquake
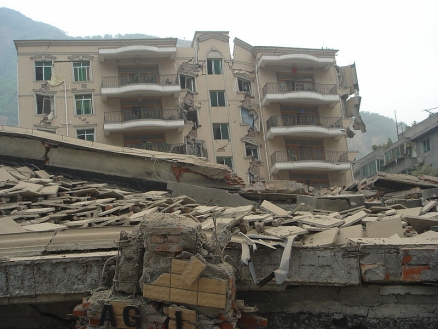
ADBC (Agriculture Development Bank of China) branch in Bei Chuan after earthquake in May 2008. (By 人神之间 (Own work (Original text: “self-made 自己制作”)) (http://www.gnu.org/copyleft/fdl.html) or CC-BY-SA-3.0-2.5-2.0-1.0 (http://creativecommons.org/licenses/by-sa/3.0), via Wikimedia Commons)
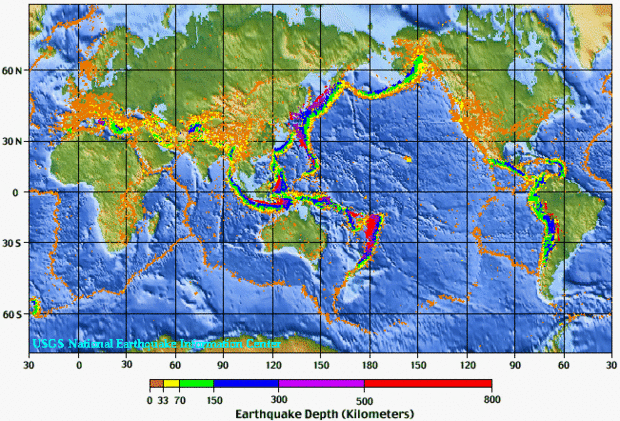
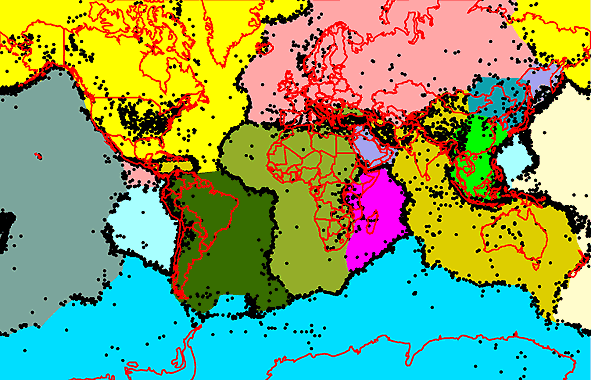
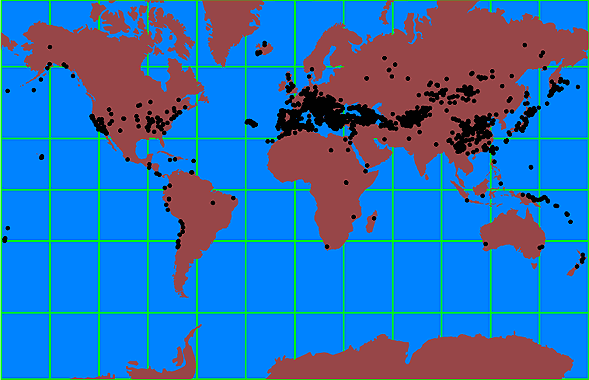
An earthquake is a sudden vibration or trembling in the Earth. More than 150,000 tremors strong enough to be felt by humans occur each year worldwide (see Chance of an Earthquake). Earthquake motion is caused by the quick release of stored potential energy into the kinetic energy of motion. Most earthquakes are produced along faults, tectonic plate boundary zones, or along the mid-oceanic ridges (Figures 1 and 2).
At these areas, large masses of rock that are moving past each other can become locked due to friction. Friction is overcome when the accumulating stress has enough force to cause a sudden slippage of the rock masses. The magnitude of the shock wave released into the surrounding rocks is controlled by the quantity of stress built up because of friction, the distance the rock moved when the slippage occurred, and ability of the rock to transmit the energy contained in the seismic waves. The San Francisco earthquake of 1906 involved a six meter horizontal displacement of bedrock. Sometime after the main shock wave, aftershocks can occur because of the continued release of frictional stress. Most aftershocks are smaller than the main earthquake, but they can still cause considerable damage to already weakened natural and human-constructed features.Earthquakes that occur under or near bodies of water can give rise to tsunamis, which in cases like the December 26, 2004 Sumatra-Andaman Island earthquake reult in far greater distruction and loss of life that the initial earthquake.
Contents
Earthquake Waves
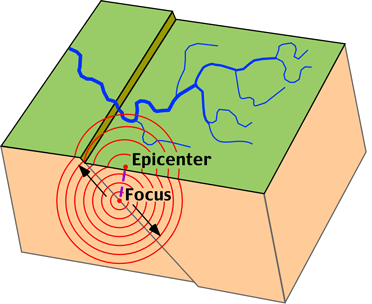
Earthquakes are a form of wave energy that is transferred through bedrock. Motion is transmitted from the point of sudden energy release, the earthquake focus (hypocenter), as spherical seismic waves that travel in all directions outward (Figure 3). The point on the Earth's surface directly above the focus is termed the epicenter.Two different types of seismic waves have been described by geologists: body waves and surface waves. Body waves are seismic waves that travel through the lithosphere. Two kinds of body waves exist: P-waves and S-waves. Both of these waves produce a sharp jolt or shaking. P-waves or primary waves are formed by the alternate expansion and contraction of bedrock and cause the volume of the material they travel through to change. They travel at a speed of about 5 to 7 kilometers per second through the lithosphere and about 8 kilometers per second in the asthenosphere. The speed of sound is about 0.30 kilometers per second. P-waves also have the ability to travel through solid, liquid, and gaseous materials. When some P-waves move from the ground to the lower atmosphere (Atmosphere layers), the sound wave that is produced can sometimes be heard by humans and animals.
|
|
S-waves or secondary waves are a second type of body wave. These waves are slower than P-waves and can only move through solid materials. S-waves are produced by shear stresses and move the materials they pass through in a perpendicular (up and down or side to side) direction.
Surface waves travel at or near the Earth's surface. These waves produce a rolling or swaying motion causing the Earth's surface to behave like waves on the ocean. The velocity of these waves is slower than body waves. Despite their slow speed, these waves are particularly destructive to human construction because they cause considerable ground movement.
Earthquake Magnitude and Energy
| Table 1: Relationship between Richter Scale magnitude and energy released. Magnitude in Richter Scale Energy Released in Joules Comment 2.0 1.3 x 10⁸ Smallest earthquake detectable by people. 5.0 2.8 x 10¹² Energy released by the Hiroshima atomic bomb. 6.0 - 6.9 7.6 x 10¹³ to 1.5 x 10¹⁵ About 120 shallow earthquakes of this magnitude occur each year on the Earth. 6.7 7.7 x 10¹⁴ Northridge, California earthquake January 17, 1994. 7.0 2.1 x 10¹⁵ Major earthquake threshold. Haiti (Earthquake) earthquake of January 12, 2010 resulted in an estmated 222,570 deaths | ||
|---|---|---|
| 7.4 | 7.9 x 10¹⁵ | Turkey earthquake August 17, 1999. More than 12,000 people killed. |
| 7.6 | 1.5 x 10¹⁶ | Deadliest earthquake in the last 100 years. Tangshan, China, July 28, 1976. Approximately 255,000 people perished. |
| 8.3 | 1.6 x 10¹⁷ | San Francisco earthquake of April 18, 1906. |
| 9.0 |
Japan Earthquake March 11, 2011 | |
| 9.1 | 4.3 x 10¹⁸ |
December 26, 2004 Sumatra earthquake which triggered a tsunamiand resulted in227,898 deaths spread across fourteen countries |
| 9.5 | 8.3 x 10¹⁸ |
Most powerful earthquake recorded in the last 100 years. Southern Chile on May 22, 1960. Claimed 3,000 lives. |
The strength of an earthquake can be measured by a device called a seismograph. When an earthquake occurs this device converts the wave energy into a standard unit of measurement like the Richter scale. In the Richter scale, units of measurement are referred to as magnitudes. The Richter scale is logarithmic. Thus, each unit increase in magnitude represents 10 times more energy released. Table 1 describes the relationship between Richter scale magnitude and energy released. The following equation can be used to approximate the amount of energy released from an earthquake in joules when Richter magnitude (M) is known:
Energy in joules = 1.74 x 10(5 + 1.44*M)
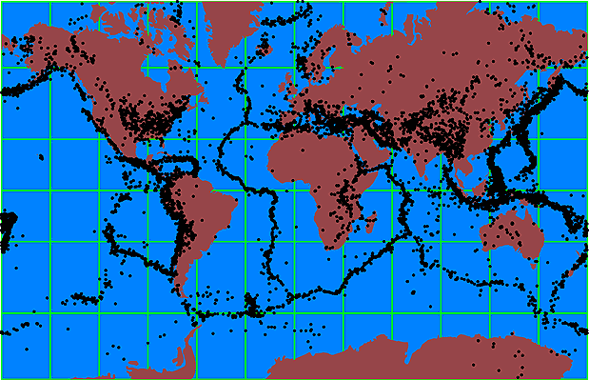
Figures 4 and 5 describe the spatial distribution of small and large earthquakes respectively. These maps indicate that large earthquakes have distributions that are quite different from small events. Many large earthquakes occur some distance away from a plate boundary. Some geologists believe that these powerful earthquakes may be occurring along ancient faults that are buried deep in the continental crust. Recent seismic studies in the central United States have discovered one such fault located thousands of [[meter]s] below the lower Mississippi Valley. Some large earthquakes occur at particular locations along the plate boundaries. Scientists believe that these areas represent zones along adjacent plates that have greater frictional resistance and stress.
|
|
|
|
The Richter Scale Magnitude, while the most known, is one of several measures of the magnitude of an earthquake. The most commonly used are:
- Local magnitude (ML), commonly referred to as "Richter magnitude;"
- Surface-wave magnitude (Ms);
- Body-wave magnitude (Mb); and
- Moment magnitude (Mw).
Scales 1 to 3 have limited range and applicability and do not satisfactorily measure the size of the largest earthquakes. The moment magnitude (Mw) scale, based on the concept of seismic moment, is uniformly applicable to all sizes of earthquakes but is more difficult to compute than the other types. All magnitude scales should yield approximately the same value for any given earthquake.
Earthquake Intensity
The severity of an earthquake can be expressed in terms of both intensity and magnitude. However, the two terms are quite different, and they are often confused.
Intensity is based on the observed effects of ground shaking on people, buildings, and natural features. It varies from place to place within the disturbed region depending on the location of the observer with respect to the earthquake epicenter while magnitude is related to the amount of seismic energy released at the hypocenter of the earthquake.
Although numerous intensity scales have been developed over the last several hundred years to evaluate the effects of earthquakes, the one currently used in the United States is the Modified Mercalli (MM) Intensity Scale. The lower numbers of the intensity scale generally deal with the manner in which the earthquake is felt by people. The higher numbers of the scale are based on observed structural damage. Structural engineers usually contribute information for assigning intensity values of Vlll or above.
The following is an abbreviated description of the 12 levels of Modified Mercalli intensity.
I. Not felt except by a very few under especially favorable conditions.
II. Felt only by a few persons at rest, especially on upper floors of buildings. Delicately suspended objects may swing.
III. Felt quite noticeably by persons indoors, especially on upper floors of buildings. Many people do not recognize it as an earthquake. Standing motor cars may rock slightly. Vibration similar to the passing of a truck. Duration estimated.
IV. Felt indoors by many, outdoors by few during the day. At night, some awakened. Dishes, windows, doors disturbed; walls make cracking sound. Sensation like heavy truck striking building. Standing motor cars rocked noticeably.
V. Felt by nearly everyone; many awakened. Some dishes, windows broken. Unstable objects overturned. Pendulum clocks may stop.
Vl. Felt by all, many frightened. Some heavy furniture moved; a few instances of fallen plaster. Damage slight.
Vll. Damage negligible in buildings of good design and construction; slight to moderate in well-built ordinary structures; considerable damage in poorly built or badly designed structures; some chimneys broken.
Vlll. Damage slight in specially designed structures; considerable damage in ordinary substantial buildings with partial collapse. Damage great in poorly built structures. Fall of chimneys, factory stacks, columns, monuments, walls. Heavy furniture overturned.
IX. Damage considerable in specially designed structures; well-designed frame structures thrown out of plumb. Damage great in substantial buildings, with partial collapse. Buildings shifted off foundations.
X. Some well-built wooden structures destroyed; most masonry and frame structures destroyed with foundations. Rails bent.
Xl. Few, if any (masonry) structures remain standing. Bridges destroyed. Rails bent greatly.
Xll. Damage total. Lines of sight and level are distorted. Objects thrown into the air.
Earthquake Damage and Destruction
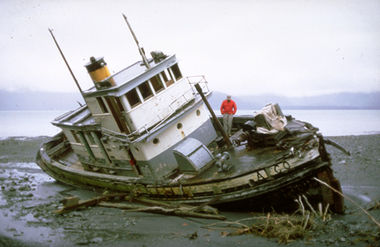
Earthquakes are a considerable hazard to humans. Earthquakes can cause destruction by structurally damaging buildings and dwellings, fires, tsunamis, and mass wasting (see Figures 6 to 10). Earthquakes can also take human lives. The amount of damage and loss of life depends on a number of factors. Some of the more important factors are:
- Time of day. Higher losses of life tend to occur on weekdays between the hours of 9:00 AM to 4:00 PM. During this time interval many people are in large buildings because of work or school. Large structures are often less safe than smaller homes in an earthquake.
- Magnitude of the earthquake and duration of the event.
- Distance form the earthquake's focus. The strength of the shock waves diminish with distance from the focus.
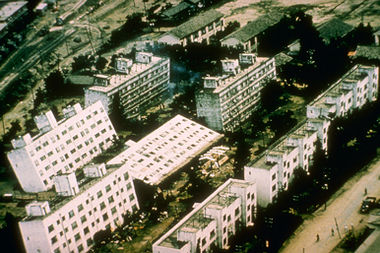
- Geology of the area affected and soil type. Some rock types transmit seismic wave energy more readily. Buildings on solid bedrock tend to receive less damage. Unconsolidated rock and sediments have a tendency to increase the amplitude and duration of the seismic waves increasing the potential for damage. Some soil types when saturated become liquefied (Figure 6).
- Type of building construction. Some building materials and designs are more susceptible to earthquake damage (Figure 7).
- Population density. More people often means greater chance of injury and death.
The greatest loss of life because of an earthquake this century occurred in Tangshan, China in 1976 when an estimated 250,000 people died. In 1556, a large earthquake in the Shanxi Province of China was estimated to have caused the death of about 1,000,000 people.
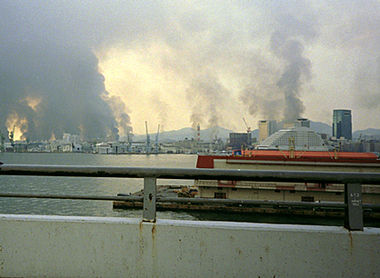 Figure 8: The following image looks at downtown Kobe, Japan at about noon on the day of the 1995 earthquake. Many areas of downtown Kobe were on fire and there was no water pressure to put out the flames. (Source: Photograph by Roger Hutchison. Image provided by the National Geophysical Data Center, NOAA)
 A common problem associated with earthquakes in urban areas is fire (Figure 8). Shaking and ground displacement often causes the severing of electrical and gas lines leading to the development of many localized fires. Response to this problem is usually not effective because shock waves also rupture pipes carrying water. In the San Francisco earthquake of 1906, almost 90% of the damage to buildings was caused by fire.
In mountainous regions, earthquake-provoked landslides can cause many deaths and severe damage to built structures (Figure 9). The town of Yungay, Peru was buried by a debris flow that was triggered by an earthquake that occurred on May 31, 1970. This disaster engulfed the town in seconds with mud, rock, ice, and water and took the lives of about 20,000 people.
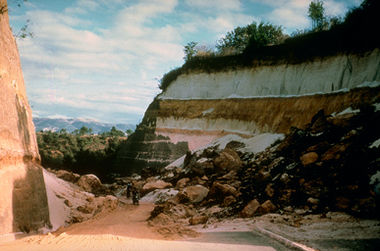 Figure 9: The Guatemala earthquake of February 4, 1976 had a magnitude of 7.5. This earthquake killed about 23,000 people, injured 76,000, and caused just over 1 billion dollars in property damage. The earthquake also caused a number of landslides. (Source: Photography by US Geological Survey. Image provided by the National Geophysical Data Center, NOAA)
 Another consequence of earthquakes is the generation of tsunamis (Figure 10). Tsunamis, or tidal waves, form when an earthquake triggers a sudden movement of the seafloor. This movement creates a wave in the water body which radiates outward in concentric shells. On the open ocean, these waves are usually no higher than one to three [[meter]s] in height and travel at speed of about 750 kilometers per hour. Tsunamis become dangerous when they approach land. Frictional interaction of the waves with the ocean floor, as they near shore, causes the waves to slow down and collide into each other. This amalgamation of waves then produces a super wave that can be as tall as 65 meters in height.
The US Geological Survey estimate that at least 1,783 deaths worldwide resulted from earthquake activity in 2009. In 2010, the number rose to 226,729 as the result of 222,570 people killed by the Jauary 12, 2010 earthquake in Haiti.
The deadliest earthquake of 2009 was a magnitude 7.5 event that killed approximately 1,117 people in southern Sumatra, Indonesia on Sept. 30, according to the U.S. Geological Survey (USGS) and confirmed by the United Nations Office for Coordination of Humanitarian Affairs (OCHA). However, the number of earthquake-related fatalities in 2009 was far less than the 2008 count of over 88,000. The high number of fatalities in 2008 was primarily due to the devastating magnitude 7.9 earthquake that occurred in Sichuan, China on May 12.
Although unrelated, the Sept. 30 Indonesian earthquake occurred a day after the year’s strongest earthquake, a magnitude 8.1 on Sept. 29 in the Samoa Islands region. Tsunamis generated by that earthquake killed 192 people in American Samoa, Samoa and Tonga. A magnitude 6.3 earthquake hit the medieval city of L’Aquila in central Italyon April 6, killing 295 people.
Overall, earthquakes took the lives of people in 15 countries on four continents during 2009, including Afghanistan, Bhutan, China, Costa Rica, Greece, Indonesia, Italy, Kazakhstan, Honduras, Japan, Malawi, Samoa, South Africa and Tonga, as well as the U.S. territory of American Samoa. Earthquakes injured people in 11 additional countries, including the mainland United States, where a magnitude 4.4 earthquake on May 2 injured one person in the Los Angeles area.
The biggest 2009 earthquake in the 50 United States was in the Aleutian Islands of Alaska. The magnitude 6.5 earthquake occurred in the Fox Islands on Oct. 13. It was felt at the towns of Akutan and Unalaska, but caused no casualties or damage. The greatest earthquake for the year in the contiguous United States was a magnitude 5.2 event on October 2 in the Owens Valley southeast of Lone Pine, California. Because of the sparse population in the epicentral area, this quake caused no damage although it was felt as far away as Merced and Los Angeles, California and Las Vegas, Nevada.
A magnitude 9.1 Sumatra-Andaman Island earthquake and subsequent tsunami on December 26, 2004 killed 227,898 people, which is the fourth largest casualty toll for earthquakes and the largest toll for a tsunami in recorded history. As a consequence of that earthquake, the USGS has significantly improved its earthquake notification and response capabilities. Improvements include the addition of nine real-time seismic stations across the Caribbean basin, a seismic and tsunami prone region near the U.S. southern border, implementation of a 24x7 earthquake operations center at the USGS National Earthquake Information Center (NEIC), and development of innovative tools for rapid evaluation of population exposure and damage to potentially damaging earthquakes.
The USGS estimates that several million earthquakes occur throughout the world each year, although most go undetected because they hit remote areas or have very small magnitudes. The USGS NEIC publishes the locations for about 40 earthquakes per day, or about 14,500 annually, using a publication threshold of magnitude 4.5 or greater worldwide or 2.5 or greater within the United States. On average, only 18 of these earthquakes occur at a magnitude of 7.0 or higher each year.
In the 2009 year, 17 earthquakes reached a magnitude of 7.0 or higher, with a single one topping a magnitude of 8.0. These statistics for large magnitude earthquakes are higher than those of 2008, which experienced only 12 earthquakes over magnitude 7.0 and none over 8.0. Factors such as the size of an earthquake, the location and depth of the earthquake relative to population centers, and fragility of buildings, utilities and roads all influence how earthquakes will affect nearby communities.
Table 2. Notable Earthquakes and Their Estimated Magnitude
| Date |
Location |
Fatalities | Magnitude |
| January 23, 1556 |
Shensi, China |
830,000 | ~8 |
| August 17, 1668 |
Anatolia, Turkey |
~8,000 | ~8 |
| November 1, 1755 |
Lisbon, Portugal |
70,000 | ~8.7 |
| December 16, 1857 |
Naples, Italy |
11,000 | ~6.9 |
| October 27, 1891 |
Mino-Owari, Japan |
7,273 | ~8 |
| June 15, 1896 |
Sanriku, Japan |
27,000 | ~8.5 |
| April 18, 1906 |
San Francisco, CA |
3,000 | 7.8 |
| August 17, 1906 |
Valparaiso, Chile |
3,882 | 8.2 |
| December 28, 1908 |
Messina, Italy |
70,000 | 7.2 |
| December 16, 1920 |
Ningxia-Gansu, China |
200,000 | 7.8 |
| September 1, 1923 |
Kanto, Japan |
143,000 | 7.9 |
| May 22, 1927 |
Gansu, China |
>40,900 | 7.6 |
| January 13, 1934 |
Bihar, India |
10,700 | 8.1 |
| December 26, 1939 |
Erzincan, Turkey |
32,700 | 7.8 |
| February 29, 1960 |
Agadir, Morocco |
10,000 | 5.7 |
| May 22, 1960 |
Chile |
1,655 | 9.5 |
| March 28, 1964 |
Prince William Sound, AK |
128 | 9.2 |
| May 31, 1970 |
Peru |
66,000 | 7.9 |
| July 27, 1976 |
Tangshan, China |
255,000* | 7.5 |
| September 19, 1985 |
Michoacan, Mexico |
9,500 | 8 |
| December 7, 1988 |
Spitak, Armenia |
25,000 | 6.8 |
| August 17, 1999 |
Izmit, Turkey |
17,118 | 7.6 |
| January 26, 2001 |
Gujarat, India |
20,085 | 7.6 |
| December 26, 2003 |
Southeastern Iran |
31,000 | 6.6 |
| December 26, 2004 |
Off west coast northern Sumatra |
227,898 | 9.1 |
| October 8, 2005 |
Pakistan |
86,000 | 7.6 |
| May 26, 2006 |
Java, Indonesia |
5,749 | 6.3 |
| May 12, 2008 |
Eastern Sichuan, China |
87,587 | 7.9 |
| January 12, 2010 |
Near Port-au-Prince, Haiti |
222,570 | 7.0 |
| March 11, 2011 |
Pacific Ocean, East of Oshika Peninsula, Japan |
15,885 | 8.9-9.1 |
- Fatalities in the 1976 Tangshan, China earthquake were estimated as high as 655,000.
Source: Preferred Magnitudes of Selected Significant Earthquakes, USGS, 2010 (with additions on two most recent major earthquakes in Haiti and Japan.
See Deaths from U.S. Earthquakes
Further Reading
The following links provide some more information about earthquakes.
- American Geophysical Union (AGU)
- Animation of P, S & Surface Waves
- Animations of Seismology Fundamentals
- Association of American State Geologists (AASG)
- Association of Bay Area Governments (ABAG)
- California Geological Survey (CGS)
- California Office of Emergency Services (OES)
- California Seismic Safety Commission
- Center for Earthquake Research & Information (CERI)
- Central United States Earthquake Consortium (CUSEC)
- Consortium of Universities for Research in Earthquake Engineering (CUREE)
- COSMOS Virtual Data Center
- CREW - Cascadia Region Earthquake Workgroup
- Earthquake Engineering Research Institute (EERI)
- Earthquake Information for 2009, USGS
- Earthquake Information for 2010, USGS
- Earthquake Monitoring
- Earthquakes - Online University
- Earthquakes by Bruce A. Bolt Online Companion
- Earthquakes Cause over 1700 Deaths in 2009, USGS
- Earth Science Education Activities
- EarthScope
- European-Mediterranean Seismological Centre
- FEMA - Federal Emergency Management Agency
- Finite-source Rupture Model Database
- Global Earthquake Explorer
- GSA - Geological Society of America
- Incorporated Research Institutes for Seismology (IRIS)
- International Association of Seismology and Physics of the Earth's Interior (IASPEI)
- International Seismological Centre (ISC)
- John Lahr's Earthquake website
- McConnell, D., D. Steer, C. Knight, K. Owens, and L. Park. 2010. The Good Earth. 2nd Edition. McGraw-Hill, Dubuque, Iowa.
- Mid-America Earthquake Center
- Multi-Disciplinary Center for Earthquake Engineering Research (MCEER)
- National Geophysical Data Center (NGDC) - NOAA
- National Information Centre of Earthquake Engineering (NICEE)
- National Science Foundation (NSF)
- Natural Hazards Center
- Northern California Earthquake Data Center
- Observatories and Research Facilities for EUropean Seismology (ORFEUS)
- PhysicalGeography.net
- Plummer, C., D. Carlson, and L. Hammersle. 2010. Physical Geology. 13th Edition. McGraw-Hill, Dubuque, Iowa.
- Project IDA
- Quake-Catcher Network
- Saint Louis University Earthquake Center
- Seattle Fault Earthquake Scenario
- Seismographs: Keeping Track of Earthquakes
- Seismological Society of America (SSA)
- Seismo-surfing the Internet for Earthquake Data
- Smithsonian Global Volcanism Program
- SOPAC (Scripps Orbit and Permanent Array Center)
- Southern California Earthquake Center (SCEC)
- Subduction
- Tarbuck, E.J., F.K. Lutgens, and D. Tasa. 2009. Earth Science. 12th Edition. Prentice Hall, Upper Saddle River, New Jersey.
- Tectonics Observatory
- Tracing earthquakes: seismology in the classroom
- UPSeis Seismology Questions Answered
- USGS Earthquake Hazards Program, U.S. Geological Survey
- Western States Seismic Policy Council (WSSPC)
- World Data Center System
- World Organization of Volcano Observatories
- World Seismic Safety Initiative (WSSI)
