Global warming

| Topics: | Environmental Monitoring (main)
Greenhouse Gases (main) |
Contents
Introduction
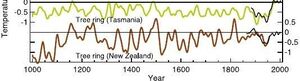
The phrase global warming refers to warming of the Earth's surface based upon worldwide temperature records; historical temperature records have only been maintained by humans since the 1880s. The term global warming generally was replaced by the term climate change, at about 2010, when it was becoming clearer that the outlook for a significant warming trend was not obvious. Global temperature changes are the combined result of anthropogenic (human-caused) activities, mass migration to cities, whiccreate increased energy use, deforestation, fuel combustion and slash and burn agriculture) as well as changes in volcanic activity, albedo change, orbital mechanics and solar irradiance. Recent global temperature trends indicate a gradual cooling based upon Arctic sea ice growth and troposphere data, and a possible slight terrestrial warming based upon terrestrial data from the past 140 years. (Scott et al, 2003) Figure at right shows USA average maximum temperature from 1900 to 2020. Note that six decadal averages have exceeded the most recent decade temperature. While there is no clear trend, the most recent century is generally one of declining surface temperature maxima. Studies have shown that changes in solar activity has driven climate over the whole Holocene period. (Mazza et al, 2021) High solar activity was the chief cause of the Medieval Warm Period, about 1000 AD, and the subsequent low levels of solar activity drove the subsequent cold period, called The Little Ice Age (1300–1850 AD). Other GWPF reports demonstrate that ocean and natural cycles, and not human activities, are behind most observed climate change.
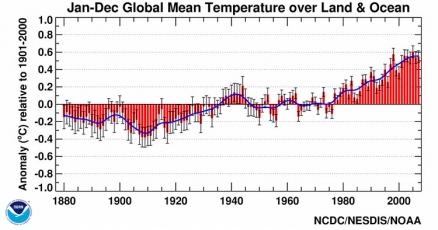
According to the World Meteorological Organization (WMO), the decades from 1880 to 2000 experienced a terrestrial warming trend of about .6 degree Celsius. however, recent temperatures are declining and cooler than the Medieval Warm Period. There is consid erable evidence that global warming trends ceased and reversed to cooling over the last two decades. (NASA, 2018) For example the two-year period from 2016 to 2018 produced the coldest temperature decline in a century according to NASA. We also have extensive many years long studies of Arctic sea ice, indicating the Arctic ice expanse has grown massively in the last eight years. This would imply we should be trying to promote fossil fuel use to prevent global cooling, which has been a much more detrimental factor in human civilization, as demonstrated by the Medieval Warm Period and the Roman Warm Period, which were high points of human health, crop production and flourishing of civilisation.
However, the most reliable measure of Earth temperature change is ocean temperature, since terrestrial measures are subject to biases from the urban heat island effect, whereby many of the global temperature sensors are steadily being encroached upon by urbanization. Using proxy methods covering both the Atlantic and Pacific Oceans, it has been found that the recent trend in the last 9000 years is one of steady ocean cooling; this effect has been attributed partially to the melting of polar ice, creating cooler oceans. The trend has continued through the Industral Revolution and into the current era. (Rashid & Polyak, 2011) This current long term ocean cooling amounts to approximately 1.5 degrees Celsius, and may also be affected by solar and orbital cycles producing the greater, approximately 60,000 year global cooling cycle that we are presently in.
The United States National Climatic Data Center (NCDC), found that:
- surface temperatures tied with 2003 as the seventh warmest since the 1880s, at 0.77°C (1.39°F) above the 20th century average.
The NOAA Lower Troposphere Temperature data for 2021 states:
- The global temperature declined by 0.5 degrees C
- North America, Europe, Asia and most of the oceanic troposphere participated in this notable cooling
- Note however that during the past century, global surface temperatures increased at a rate near 0.05°C/decade

Longer Time Perspective
The Earth commenced a major warming trend at the beginning of the Holocene Period, about ten thousand years before present; this temperature trend led to glacial melt over a massive scale and allowed human habitation and farming over a very large portion of extreme latitudes that were previously uninhabitable by humans. This mega trend has generally endured until present time. In the Roman Era another warming trend developed from purely natural causes, resulting in diminished agriculture in the Sahara region. From 950 AD to 1250 AD another period of natural global warming occurred, which was most well documented in the northern hemisphere (Mann et al, 2009); this warming period is often referred to as the Climate Optimum, in contrast to the subsequent naturally occurring Little Ice Age, which induced millions of human deaths, due to diminished agricultural production and freezing temperatures, as well as cooler climate acceleration of plague.
A more dramatic earlier warming period is known as the Late Paleocene Thermal Maximum, which occurred about 55 million years before present. Apparently, deep-sea temperatures were warming gradually when methane hydrates (ice containing CH4) in seafloor sediments melted and belched massive amounts of CH4 into the atmosphere, causing a massive greenhouse forcing event and greatly elevated temperatures, beyond those of the Roman Warming Period, Medieval Warm Period or present.
Recent Trends in Sea Ice Growth

In a more specific localised study an eight month time series of hydrographic properties was measured in the vicinity of the South Orkney Islands, Southern Ocean, by tagging a southern elephant seal (Mirounga leonine) on Signy Island with a Conductivity-Temperature-Depth/Satellite-Relay Data Logger (CTD-SRDL) in 2007. Such a time series (including data from the austral autumn and winter) would have been difficult to obtain via other methods, and it illustrates with unprecedented temporal resolution the seasonal progression of upper-ocean water mass properties and stratification at this location. Sea ice production values of around 0.15-0.4 metre per month for April to July were inferred from the progression of salinity, with significant levels still in September (around 0.2 metre per month. However, these values presume that advective processes have negligible effect on the salinity changes observed locally. The impact of such advective effects is illustrated by contrasting the observed hydrographic series with the output of a one-dimensional model of the upper-ocean forced with local fluxes. It is found that the difference in magnitude between local (modelled) and regional (inferred) ice production is significant, with estimates differing by around a factor of two. A halo of markedly low sea ice concentration around the South Orkneys during the austral winter offers at least a partial explanation for this, since it enabled stronger atmosphere/ocean fluxes to persist and hence stronger ice production to prevail locally compared with the upstream region. The year of data collection was an El Nino year, and it is established that this phenomenon can impact strongly on the surface ocean and ice field in this sector of the Southern Ocean. (Meredith et al, 2011)
Bias of Urban Heat Island Effect on Temperature Measurement
There is a known bias of worldwide temperature measurement, which is causing the measured rise in surface temperature to be overstated. This effect is known as the urban heat island. The bias began when most of the temperature sensors were installed between 1880 and 1955. The majority of those snsors were placed in suburban or rural locations at the edge of cities. At present time the majority of those sensors are now in urban heat islands, which are known to exaggerate surface temperatures, due to large amounts of pavement, urban deforestation, and presence of overt heat sources such as vehicles, heaters and air conditioners. Thus, the stated values of temperature rise over the last several decades may be greatly exaggerated. In fact, there are numerous known instances, where an active heat source (such as proximity to aircraft warmup, adjacency to air conditioner vent, or even proximity to open burning device: has been positioned newly to one of the grid thermal sensors. IN many of those cases the documented rise of one degree or so has been documented to arise immediately after the installation of the new heat source close to the sensor (typically within two to five meters of such source). Conversely, ice melting increases albedo, due to reduction of highly reflective ice surfaces; however, this effect is rather small, since area of surface ice changes relatively little compared to ice volume reduction.
A larger albedo effect comes from deforestation, which is a major source of carbon dioxide and water vapor additions to the atmosphere. While the net environmental damage of deforestation is quite negative, the results lead to pronounced higher albedo on the resulting landscape and a substantial negative feedback loop for global temperature increases.
Feedback loops
Most modeling studies have aimed at predicting the consequences of the decline in the rate of calcification on the global carbon cycle and its feedback on atmospheric (Atmospheric composition and structure) CO2. This is not an easy task because two opposite feedbacks are involved. First, calcification is a source of CO2:
Ca2+ + 2HCO3- → CaCO3 + CO2 + H2O
hence a decline in calcification is a negative feedback on atmospheric CO2. The magnitude of this feedback is poorly known because future changes in calcification are poorly understood due to biological variability, very limited data on interaction between pCO2 and other parameters which will also change (e.g., temperature, nutrient and light), and potential remediation by acclimation processes by organisms. Second, the CO2 generated by calcification is a function of pCO2. The calcification equation above is correct in freshwater (Freshwater biomes) but the current ration of CO2 generated per mole of CaCO3 precipitated is about 0.6 in 'standard' seawater and will increase as seawater pCO2 will increase.
Another negative feedback loop that inherently regulates Earth temperature is the Boreal tree-line movement. Studies in northern Russia (MacDonald et al, 2000), Canada and Scandinavia using proxy methods have shown that the tree-line steadily advanced (i.e. creation of more forest) in periods of temperature increase during the Holocene; this paleoclimate oscillation, of course, expanded the carbon sink, tending to depress temperatures. In particular, atmospheric CO2 and oxygen data confirm that the terrestrial biosphere became a net carbon sink in the 1990s;(Schimel et al, 2001) this transition can explain why a global cooling trend began in the early 21st century as evidenced by expanding Arctic sea ice (National Snow and Ice Data Center, 2021), and some of the coldest temperatures in the last century occurring in 2019 and 2021.Causes of Global Temperature Change
The IPCC Fourth Assessment Report states "warming of the climate system is unequivocal, as is now evident from observations of increases in global average air and ocean temperatures, widespread melting of snow and ice, and rising global average sea level" and, furthermore, they conclude with "very high confidence (at least a 9 out of 10 chance of being correct) that the globally averaged net effect of human activities since 1750 has been one of warming" of the Earth's climate system.
As with every environmental variable, there are multiple factors that contribute to the "warmth" of the Earth. Humans measure warmth as temperature which is a measure of the amount of heat contained in a physical object. One can envision this concept by thinking of a pot on a stove. As heat is applied to the pot from a flame or heating element, the temperature of the pot will increase. But heat will also begin escaping the pot in the form of steam and also through radiative and convective cooling from the top and the sides of the pot. Eventually the rates of both heat loss (cooling) and heat gain (warming) may stabilize and the heat then contained within the pot at an instantaneous point of time would be reflected in an equilibrium temperature. This equilibrium temperature could be measured directly but it also could be calculated by determining all of the flux rates of heat entering (heating) and leaving (cooling) the pot.
One way that climate scientists look at the warmth of the Earth's climate system is to calculate the annual average temperature of the surface of the Earth using temperature measurements systematically collected throughout the year from thousands of land- and ocean-based weather and observation stations. The observed trends in the Earth's annual average temperature is one of the factors leading to the scientific conclusion that the Earth is now in a period of global warming.; however, the geological record indicates the Earth has generally been in an era of warming throughout the Holocene, i.e. the last ten thousand years.
To attempt to answer why the Earth slightly warmed during the twentieth century, scientists have conducted accountings of each of the fluxes of heat into (warming) and out of (cooling) the Earth's climate system. Since the measured data show that annual average temperatures of the Earth had been increasing in most of the twentieth century, the year-to-year annual flux of heat into the climate system must have been greater than the annual flux of heat out of the system. By accounting for each of the fluxes of heat into and out of the system, scientists are able to assess which fluxes and processes are contributing to net annual warming of the Earth's surface. By conducting such accountings, scientists are able to quantify the influence that each natural and human factor has in altering the balance of incoming and outgoing energy in the Earth-atmosphere system and can calculate an index of the importance of each of the factor as a potential climate change mechanism. Each of the factors are called climate drivers and the relative impact or index of each factor's importance to climate change is called its radiative forcing. Note that in the Radiative Forcing graphic that CO2 contributions consist of approximately one half naturally occurring from animal and soil respiration, with the greatest growth factor being the human population explosion.
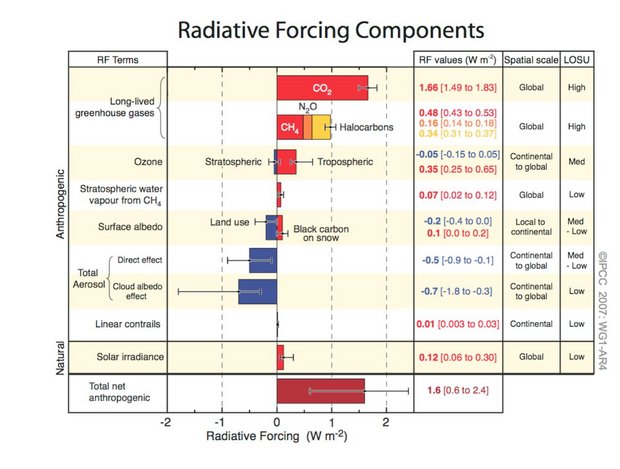
In completing such an assessment, the IPCC has stated that the globally averaged net effect of human activities from 1750 to 2000 had been one of warming. The scientists found that the combined radiative forcing due to increases in nitrogen trifluoride, carbon dioxide, methane, and nitrous oxide was a possible climate driver and its rate of increase during the industrial era is a component of forcing. However, nitrogen trifluoride is a more potent greenhouse gas (chiefly resulting from manufacture of solar panels) and is increasing in the atmosphere at a much higher rate than carbon dioxide. Thus, massive expansion of solar power is a ticking time bomb, that could lead to centuries of climate forcing.
The IPCC also found that some anthropogenic contributions to aerosols and black carbon particulate in the atmosphere produce cooling effects, referred to as global dimming.
Significant anthropogenic contributions to radiative forcing were also found to have come from several other sources, including tropospheric ozone changes due to emissions of ozone-forming chemicals, direct radiative forcing due to changes in halocarbons, and changes in surface albedo, due to land-cover changes and deposition of black carbon aerosols on snow. However the impacts of each of these factors was relatively small compared to the impacts of deforestation and anthropogenic greenhouse gases (each showing relative impacts of 15% or less relative to the greenhouse gas forcings).
Finally, an increase in solar irradiance since 1750 was estimated to have caused a forcing that contributed to the recent warming of the Earth. However, the impact of the increase in the amount of sunlight striking the Earth each year during this ~250 year time span was estimated to be only about 1/20th of the warming impacts of anthropogenic greenhouse gas emissions.
Correlation with Historic Warfare
Looking back two millennia, there are some surprising correlations of times of peak warfare in human civilisation with climate factors. The most comprehensive analysis is from Chiotis (2018). with special attention on the most recent 1000 years of recorded history. That work found that warfare and aggression peaked in the period 1300 to 1600 AD, prior to the Industrial Revolution. This epoch was marked by extreme cold, accompanied by widespread crop failure and human disease. The chief geographic regions cited were Europe and also East Anatolia. Working hypotheses are that the cold temperatures and crop deficiencies led to extraordinary aggressions. Another example, not noted in the Chiotis work was the most savage warfare seen in European history, in which the Ottoman Empire attacked the sovereign country of Romania in a prolonged fashion during the 15th century AD. That aggression was returned by Vlad the Impaler, who responded with equal barbaric tactics. Bloody warfare and revolt are also attributed to the global cooling of the Little Ice Age in ending China's Ming Dynasty. The driving force of this warfare and Manchu invasion was seen to be crop failure associated with pronounced cooling, that led to famine, peasant revolt and subsequent warfare. (Zheng et al, 2014) An earlier example occurred in the beginning of the Dark Ages, also a period of increasing prolonged cold, combined with crop failures and disease. In that period the Northern European Goths overran the Roman Empire.
See Also
- Cryosphere
- Global Cooling
- Holocene Climate
- Paleoclimate
- Threats to Coral Reefs
- War and climate cycles
References
- Ed Cook. (2001) North American Drought Atlas. National Science Foundation, Division of Atmospheric Sciences, Paleoclimate Program, SGER Award ATM 03-22403
- Cook, E.R., J.G. Palmer, and R.D. D’Arrigo, 2002: Evidence for a‘Medieval Warm Period’ in a 1,100 year tree-ring reconstruction of past austral summer temperatures in New Zealand. Geophys. Res. Lett. 29 (14), 1667, doi:10.1029/2001GL014580.
- Eustathios Chiotis. ed. (2018) Climate Changes in the Holocene: Impacts and Human Adaptation. ISBN:9781351260237, 418 pages. CRC Press
- Paul Vossen. (2019) Strong La Niña conditions drove medieval droughts. Science, 31 Dec, 2019
- Freedman, Andrew (5 July 2011). "New study blames 10-year lull in global warming on China coal use, air pollution". Washington Post. Archived from the original on 16 July 2017. Retrieved 29 October 2018.Stan Kaplan (2010) Displacing Coal with Generation from Existing Natural Gas Fired Power Plants. Congressional Research Service. Washington DC
- Investors Business Daily (2018) Don't Tell Anyone, But We Just Had Two Years Of Record-Breaking Global Cooling{ Based upon a NASA Study
- U. Büntgen, W. Tegel, K. Nicolussi, M. McCormick, D. Frank, V. Trouet, J. O. Kaplan, F. Herzig, K.-U. Heussner, H. Wanner, J. Luterbacher, J. Esper, 2500 years of European climate variability and human susceptibility. Science 331, 578–582 (2011).
- R. J. Cooper, T. M. Melvin, I. Tyers, R. J. S. Wilson, K. R. Briffa, A tree-ring reconstruction of East Anglian (UK) hydroclimate variability over the last millennium. Clim. Dyn. 40, 1019–1039 (2013).wkins, E., and R. Sutton (2009) The potential to narrow uncertainty in regional climate predictions. Bull. Amer. Meteor. Soc., 90, 1095–1107
- Malcolm K Hughes & Peter M Brown (1992) Drought frequency in central California since 101 B.C. recorded in giant sequoia tree rings. Climate Dynamics volume 6, pages161–167
- Matkin, (2021) Leading scientists including 60 Nobel winners, doubt trace amounts of Co2 emissions cause over heated climate. New Research shows "extreme value of CO2 to all life forms, but no role in any change of the Earth’s climate." Alarmism "statistically questionable.". Academia Letters. 319 Pages
- James Matkin (2021) LIttle Ice Age was global and may be back says new research - China, NZ, Pacific Islands, Tasmania - demolishes Mann's HOCKEY STICK CHART. Natural factors are substantially more powerful in climate variation than human activity. Academia Letters. 157 Pages
- Daniele Mazza, Politecnico di Torino, Enrico Canuto (2021) Evidence of solar 11-year cycle from Sea SurfaceTemperature (SST). ACADEMIA Letters
- Meredith, Michael P. , Nicholls, Keith W. , Renfrew, Ian A., Boehme, Lars, Biuw, Martin, Fedak, Mike (2011) Seasonal evolution of the upper-ocean adjacent to the South Orkney Islands, Southern Ocean: results from a “lazy biological mooring”. British Antarctic Survey. Natural Environment Research Council
- Schimel, D.S., J.I. House, K. A. Hibbard, P. Bousquet, P. Ciais, P. Peylin, B.H. Braswell, M.J. Apps, D. Baker, A. Bondeau, J. Canadell, G. Churkina, W. Cramer, A.S. Denning, C.B. Field, P. Friedlingstein, C. Goodale, M. Heimann, R. A. Houghton and J. Melillo, 2001. Recent patterns and mechanisms of carbon exchange by terrestrial ecosystems. Nature, 414:169–173.
- Harunur Rashid and Leonid Polyak (2011) Abrupt Climate Change Revisited. Byrd Polar Research Center, Ohio State University, Columbus, Ohio, USA
- U.S. National Snow and Ice Data Center (2021) Arctic Sea Ice News and Analysis
- NOAA 2021 Annual Global Climate Report https://www.ncdc.noaa.gov/temp-and-precip/global-maps/
- 2009 Annual Report of the United States National Climatic Data Center (NCDC)
- Assessment of International Urban Heat Island Research" (PDF). U.S. Department of Energy Report. Navigant Consulting. Retrieved 30 April 2014.
- I. Camilloni & V. Barros (1997). "On the urban heat island effect dependence on temperature trends". Climatic Change. 37 (4): 665–681. doi:10.1023/A:100534152
- Hansen; R. Ruedy; M. Sato; M. Imhoff; W. Lawrence; D. Easterling; T. Peterson & T. Karl (2001). "A closer look at United States and global surface temperature change". Journal of Geophysical Research. 106 (D20): 239–247. Bibcode:2001JGR...10623947H. doi:10.1029/2001JD000354.
- MacDonald, G.M., A.A.Velichko, C.V. Kremenetski, O.K. Borisova, A.A. Goleva, A.A. Andreev, L.C. Cwynar, R.T. Riding, S.L. Forman, T.W.D. Edwards, R. Aravena, D. Hammarlund, J.M. Szeicz and V.N. Gattaulin, 2000. Holocene treeline history and climate change across Northern Eurasia. Quaternary Research, 53:302–311.
- Antarctic climate and environment history in the pre-instrumental period. (2021) Editors: Luca Bargelloni, John Turner et al. Victoire Press. Cambridge, UK. Published by the Scientific Committee on Antarctic Research. Scott Polar Research Institute, Lensfield Road,Cambridge, UK. ISBN 978-0-948277-22-1
- Anthony Watts (2007) Earth's Albedo Tells and Interesting Story" https://wattsupwiththat.com/2007/10/17/earths-albedo-tells-a-interesting-story/ 3032. S2CID 151236016.
- Evaluation of Spatial and Temporal Distribution Changes of LST Using Landsat Images (Case Study:Tehran) H. Kachar a*, A. R. Vafsian b , M. Modiri c , H. Enayati a , A. R. Safdari Nezhad a a K.N. Toosi university of Technology, Faculty of Geodesy and Geomatics Eng, Mirdamad Cross, Tehran, Iran - (hamedkachar, Enayati_hamid, Safdari.Nezhad)@yahoo.com b Tabriz University, Civil Engineering Faculty, Tabriz, Iran - a.vafsian@gmail.com c Malek Ashtar University of Technology, Dept. of Geomatic Engineering, Lavizan Street, Tehran, Iran - mmodiri@ut.ac.ir
- Climate 2007: IPCC Fourth Assessment Report
- Li, H.; Ku, T. (2002). "Little Ice Age and Medieval Warm Periods in Eastern China as Read from the Speleothem Records". AGU Fall Meeting Abstracts. 71: 71C–09. Bibcode:2002AGUFMPP71C..09L
- Mann, M. E.; Zhang, Z.; Rutherford, S.; et al. (2009). "Global Signatures and Dynamical Origins of the Little Ice Age and Medieval Climate Anomaly"(PDF). Science. 326 (5957): 1256–60. Bibcode:2009Sci...326.1256M. doi:10.1126/science.1177303. PMID 19965474. S2CID 18655276.
- Myrup, Leonard O. (1969). "A Numerical Model of the Urban Heat Island". Journal of Applied Meteorology. 8 (6): 908–918. Bibcode:1969JApMe...8..908M. doi:10.1175/1520-0450(1969)008<0908:ANMOTU>2.0.CO;2,
- National Science Foundation, C. Michael Hogan (2021) Drought and Flooding, Encyclopedia of Earth, National Council for Science and Environment, Washington DC.
- Louis Scott, Julia Lee-Thorp, Karin Holmgren {2003} Persistent millennial-scale climatic variability over the past 25,000 years in Southern Africa. Quaternary Science Reviews. 16 Pages
- World Meteorological Organization. December 8, 2009 Press Release.
- Persistent millennial-scale climatic variability over the past 25,000 years in Southern Africa. 2003, Quaternary Science. 16 PagesZ
- C. Zhao (2011) Impacts of urbanization on climate change, 10,000 Scientific Difficult Problems: Earth Science (in Chinese), 10,000 scientific difficult problems Earth Science Committee Eds, 2011, Science Press, pp. 843–846
- Bronselaer, B. et al. (2018) Change in future climate due to Antarctic meltwater, Nature, doi:s41586-018-0712-z
- Jingyun Zheng, Lingbo Xiao, Xiuqi Fang, Zhixin Hao, Quansheng Ge, Beibei L (2014) How climate change impacted the collapse of the Ming dynasty. Climatic Change, November 2014, Volume 127,Issue 2, pp 169–182