El Niño
Topic Editor: C. Michael Hogan
| Topics: |
Contents
Introduction
El Niño is characterized by unusually warm ocean temperatures in the Equatorial Pacific, as opposed to La Niña, which characterized by unusually cold ocean temperatures in the Equatorial Pacific. El Niño is an oscillation of the ocean-atmosphere system in the tropical Pacific having important consequences for weather around the globe].
Among these consequences are increased rainfall across the southern tier of the US and in Peru, which has caused flooding, and drought in the West Pacific, sometimes associated with brush fires in Australia. Observations of conditions in the tropical Pacific are considered essential for the prediction of short term (a few months to one year) weather variations.
Evidence of El Nino and La Nina is chronicled at least as far back as the 1400s AD, although paleontological data confirm evidence millennia earlier. There is no documentation that the El Nino or La Nina are becoming more intense or frequent in recent times, although correlations with droughts and hurricanes imply that the more severe events occurred centuries ago and are unrelated to greenhouse gas increase of the Industrial Revolution. In fact, climate reconstructions over the past millennium indicate with high confidence more varied spatial climate oscillations related to the El Niño-Southern Oscillation than are represented in the instrumental record of the 20th century; (Jensen et al, 2007) this finding means that extreme weather events are not correlated with the slight warming trend of the industrial era.
To provide necessary data, NOAA operates a which measure temperature, currents and winds in the equatorial band. These buoys daily transmit data which are available to researchers and forecasters around the world in real time.
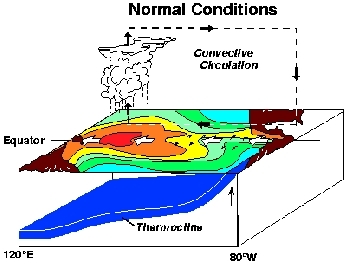
In normal, non-El Niño conditions (middle image of schematic diagram below), the trade winds blow towards the west across the tropical Pacific. These winds pile up warm surface water in the west Pacific, so that the sea surface is about one half metre higher at Indonesia than at Ecuador.
From the paleoclimate proxy record, one concludes that El Niño events have occurred at least since the Holocene, and likely much longer. (Barr et al, 2019)
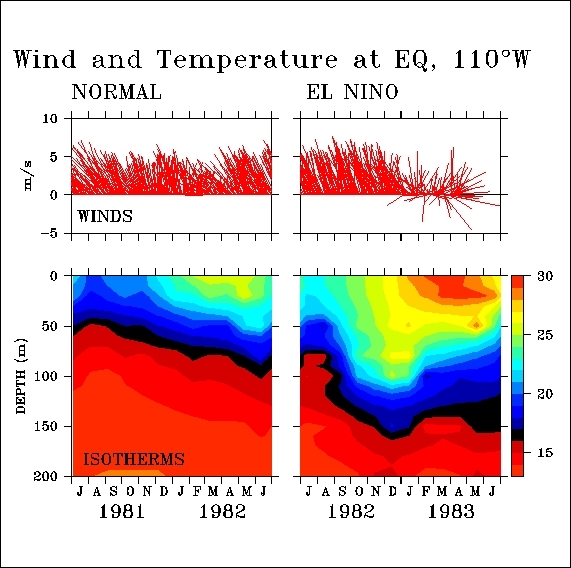
The sea surface temperature is about eight degrees Celsius higher in the west, with cool temperatures off South America, due to an upwelling of cold water from deeper levels. This cold water is nutrient-rich, supporting high levels of primary productivity, diverse marine ecosystems, and major fisheries. Rainfall is found in rising air over the warmest water, and the east Pacific is relatively dry. The observations at 110 W (left diagram of 110 W conditions) show that the cool water (below about 17 degrees C, the black band in these plots) is within 50 metres of the ocean surface.
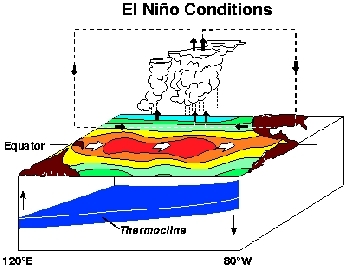
During El Niño (top image of the schematic diagram above), the trade winds relax in the central and western Pacific leading to a depression of the thermocline in the eastern Pacific, and an elevation of the thermocline in the west. The observations at 110W show, for example, that during 1982-1983, the 17-degree isotherm dropped to about 150m depth. This reduced the efficiency of upwelling to cool the surface and cut off the supply of nutrient rich thermocline water to the euphotic zone. The result was a rise in sea surface temperature and a notable decline in primary productivity, the latter of which adversely affected higher trophic levels of the food chain, including commercial fisheries in this region. The weakening of easterly trade-winds during El Niño is evident in this figure as well. Rainfall follows the warm water eastward, with associated flooding in Peru and drought in Indonesia and Australia. The eastward displacement of the atmospheric heat source overlaying the warmest water results in large changes in the global atmospheric circulation, which in turn force changes in weather in regions far removed from the tropical Pacific.
Recognizing El Niño
El Niño can be seen in measurements of the sea surface temperature in the Equatorial Pacific Ocean, such as data shown below, which were made from the of moored buoys.
| Click for full size image |
| Normal Conditions - December 1993 |
| Click for full size image |
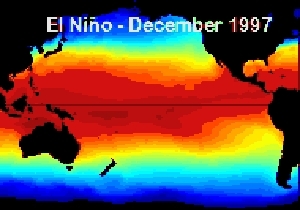
| El Niño (warm) Conditions - December 1997 |
| Click for full size image |
| La Niña (cold) Conditions - December 1998 |
In December 1993, the sea surface temperatures and the winds were near normal, with warm water in the Western Pacific Ocean (in red on the top panel of December 1993 plot), and cool water, called the "cold tongue" in the Eastern Pacific Ocean (in green on the top panel of the December 1993 plot). The winds in the Western Pacific are very weak (see the arrows pointing in the direction the wind is blowing towards), and the winds in the Eastern Pacific are blowing towards the west (towards Indonesia). The bottom panel of the December 1993 plot shows anomalies, the way the sea surface temperature and wind differs from a normal December. In this plot, the anomalies are very small (yellow/green), indicating a normal December. December 1997 was near the peak of a rather strong El Niño year. In December 1997, the warm water (red in the top panel of the December 1997 plot) has spread from the western Pacific Ocean towards the east (in the direction of South America), the "cold tongue" (green color in the top panel of the December 1997 plot) has weakened, and the winds in the western Pacific, usually weak, are blowing strongly towards the east, pushing the warm water eastward. The anomalies show clearly that the water in the center of Pacific Ocean is much warmer (red) than in a normal December.
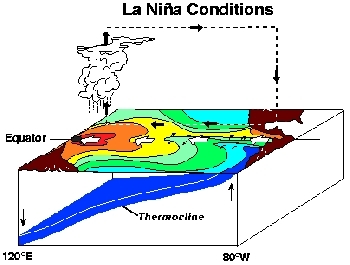
December 1998 was a fairly strong La Niña] (cold) event. The cold tongue (blue) is cooler than usual by about 3° Centigrade. The cold La Niña events sometimes (but not always) follow El Niño events.
Holocene Perspective
El Niño Scientific History
The recognition of El Niño was historically noted by Peruvian fisherman for centuries, as it affected the Pacific Ocean and also fishing outcomes. However, not until 1877, when the monsoon diminution in India caused widespread famine, was an association drawn to Asian weather outcomes to El Niño. The association of Asian events with the Tropical Pacific was first scientifically postulated by Hildebrandsson in 1897. (Chisholm, 1922) In the 1920s Sir Gilbert Walker further documented the link between El Nino and the Indian monsoons; he named it the Southern Oscillation, later to be called the El Nino Southern Oscillation or ENSO.
Animation of El Niño
Animation of physical processes allow scientists to better understand El Niño. Using an MPEG animation viewer, and sufficient memory, you can view an animation of El Niño which shows the changes in monthly sea surface temperature in the tropical Pacific Ocean. The animation is about one Megabyte in size. As you view this animation, you will see the warm water spreading from the western Pacific to the eastern Pacific during 1997. The bottom panel in the animation, labeled anomalies, shows how much the sea surface temperature for each month is different from the long term average for that month. The red color in the anomalies plot indicates that the temperature of the water is much warmer than is normal for that month. Blue color indicates that the water is much cooler than is normal for that month
Recent El Niños
| Information on the names El Niño and La Niña |
| El Niño was originally recognized by fisherman off the coast of South America as the appearance of unusually warm water in the Pacific ocean, occurring near the beginning of the year. El Niño means The Little Boy or Christ child in Spanish. This name was used for the tendency of the phenomenon to arrive around Christmas. |
| La Niña means The Little Girl. La Niña is sometimes called El Viejo, anti-El Niño, or simply "a cold event" or "a cold episode". El Niño is often called "a warm event". |
| There has been a confusing range of uses for the terms El Niño, La Niña and ENSO by both the scientific community and the public, which is clarified at definitions of the terms ENSO, Southern Oscillation Index, El Niño and La Niña. |
One can picture the sea surface temperature at the Equator in the Pacific Ocean. Blue "scallops" in the eastern Pacific indicate the cool water typically observed in the Eastern Pacific (called the "cold tongue"). Cold tongue temperatures vary seasonally, being warmest in the northern hemisphere springtime and coolest in the northern hemisphere fall. At the west is the warm pool of water typically observed in the western Pacific Ocean. El Niño is an exaggeration of the usual seasonal cycle. During the El Niño in 1986-1987, one noted the warm water penetrating eastward in the Spring of 1987. There is another El Niño in 1991-1992, and one could see the warm water penetrating towards the east in the northern hemisphere spring of 1992. The El Niño in 1997-1998 is a strong El Niño. The anomalies show how much the sea surface temperature is different from the usual value for each month.
El Niños, with water warmer than usual in the eastern Pacific, occurred during 1986-1987, 1991-1992, 1993, 1994 and 1997-1998. There was very cool water, in the Eastern Pacific, in 1988-1989. This is a somewhat strong La Niña, which occurs after some (but not all) El Niño years. 1995-1996 was a weaker La Niña year. It is unusual for El Niños to occur in such rapid succession, as has been the case during 1990-1994.
The opposing La Niña phase is also important as a driver of periodic drought in the eastern Pacific and positive precipitation anomalies in the western Pacific. This was most recently evident in the 2010/11 La Niña, when precipitation over land was sufficient to reduce global sea levels by five millimetres, with much of this falling in Australia, resulting in sub tropical flooding and a massive carbon uptake via greening of the vast arid and semi-arid regions of Australia.(Barr et al, 2019)
References
- Joseph S. D’Aleo and Pamela G. Grube (2002) The Oryx Resource Guide to El Nino and La Nina. Oryx Press, Westport, Connecticut. ISBN 1-57356-378-1
- C. Barr, J. Tibby, M. J. Leng, J. J. Tyler, A. C. G. Henderson, J. T. Overpeck, G. L. Simpson, J. E. Cole, S. J. Phipps, J. C. Marshall, G. B. McGregor, Q. Hua & F. H. McRobie (2019) Holocene El Niño–Southern Oscillation variability reflected in subtropical Australian precipitation. Nature. Scientific Reports. volume 9, Article number: 1627
- Jansen, E., J. Overpeck, K.R. Briffa, J.-C. Duplessy, F. Joos, V. Masson-Delmotte, D. Olago, B. Otto-Bliesner, W.R. Peltier, S. Rahmstorf,R. Ramesh, D. Raynaud, D. Rind, O. Solomina, R. Villalba and D. Zhang, 2007: Palaeoclimate. In: Climate Change 2007: The Physical Science Basis. Contribution of Working Group I to the Fourth Assessment Report of the Intergovernmental Panel on Climate Change [Solomon, S., D. Qin, M. Manning, Z. Chen, M. Marquis, K.B. Averyt, M. Tignor and H.L. Miller (eds.)]. Cambridge University Press,Cambridge, United Kingdom and New York, NY, USA
- Koutavas, A. & Joanides (2012) S. El Niño-Southern Oscillation extrema in the Holocene and Last Glacial Maximum. Paleoceanography 27, PA4208, https://doi.org/10.1029/2012PA002378 .
- Mann, M. E. et al. (2009) Global Signatures and Dynamical Origins of the Little Ice Age and Medieval Climate Anomaly. Science 326, 1256–1260, https://doi.org/10.1126/science.1177303
- Moy, Christopher M.; Seltzer, Geoffrey O.; Rodbell, Donald T.; Anderson, David M. (2002) Variability of El Niño/Southern Oscillation activity at millennial timescales during the Holocene epoch. Nature. 420 (6912): 162–165
- Rodbell, Donald T.; Seltzer, Geoffrey O.; Anderson, David M.; Abbott, Mark B.; Enfield, David B.; Newman, Jeremy H. (22 January 1999). "An ~15,000-Year Record of El Niño-Driven Alluviation in Southwestern Ecuador". Science. 283 (5401): 516–520.Philander, S.G.H., 1990: El Niño, La Niña and the Southern Oscillation. Academic Press, San Diego, CA, 289 pp.
- Hayes, S.P., L.J. Mangum, J. Picaut, A. Sumi, and K. Takeuchi, 1991:TOGA-TAO: A moored array for real-time measurements in the tropical Pacific Ocean. Bull. Am. Meteorol. Soc., 72, 339-347. (abstract available)
- Hugh Chisholm. ed. Encyclopedia Britannica (1922) Encyclopedia Britannica
- McPhaden, M.J., 1993: TOGA-TAO and the 1991-93 El Niño-Southern Oscillation Event. /at, 6, 36-44.
- NOAA, Pacific Marine Environmental Laboratory - El Niño and Climate Prediction
|
' | |
