Ecosystems and Human Well-being Synthesis: Key Questions in the Millennium Ecosystem Assessment

This is part of the Millenium Ecosystem Assessment report Ecosystems and Human Well-Being Synthesis
Contents
- 1 How have ecosystems changed?
- 2 How have ecosystem services and their uses changed?
- 3 How have ecosystem changes affected human well-being and poverty alleviation?
- 4 What are the most critical factors causing ecosystem changes?
- 5 How might ecosystems and their services change in the future under various plausible scenarios?
- 6 What can be learned about the consequences of ecosystem change for human well-being at sub-global scales?
- 7 What is known about time scales, inertia, and the risk of nonlinear changes in ecosystems?
- 8 What options exist to manage ecosystems sustainably?
- 9 What are the most important uncertainties hindering decision-making concerning ecosystems?
How have ecosystems changed?
Ecosystem Structure
The structure of the world’s ecosystems changed more rapidly in the second half of the twentieth century than at any time in recorded human history, and virtually all of Earth’s ecosystems have now been significantly transformed through human actions. The most significant change in the structure of ecosystems has been the transformation of approximately one quarter (24%) of Earth’s terrestrial surface to cultivated systems (C26.1.2). (See Box 1.1.) More land was converted to cropland in the 30 years after 1950 than in the 150 years between 1700 and 1850 (C26).

Between 1960 and 2000, reservoir storage capacity quadrupled (C7.2.4); as a result, the amount of water stored behind large dams is estimated to be three to six times the amount held by natural river channels (this excludes natural lakes) (C7.3.2). (See Figure 1.1.) In countries for which sufficient multi-year data are available (encompassing more than half of the present-day mangrove area), approximately 35% of mangroves were lost in the last two decades (C19.2.1). Roughly 20% of the world’s coral reefs were lost and an additional 20% degraded in the last several decades of the twentieth century (C19.2.1). Box 1.1 and Table 1.1 summarize important characteristics and trends in different ecosystems.
Although the most rapid changes in ecosystems are now taking place in developing countries, industrial countries historically experienced comparable rates of change. Croplands expanded rapidly in Europe after 1700 and in North America and the former Soviet Union particularly after 1850 (C26.1.1). Roughly 70% of the original temperate forests and grasslands and Mediterranean forests had been lost by 1950, largely through conversion to agriculture (C4.4.3). Historically, deforestation has been much more intensive in temperate regions than in the tropics, and Europe is the continent with the smallest fraction of its original forests remaining (C21.4.2). However, changes prior to the industrial era seemed to occur at much slower rates than current transformations.
|
|
|
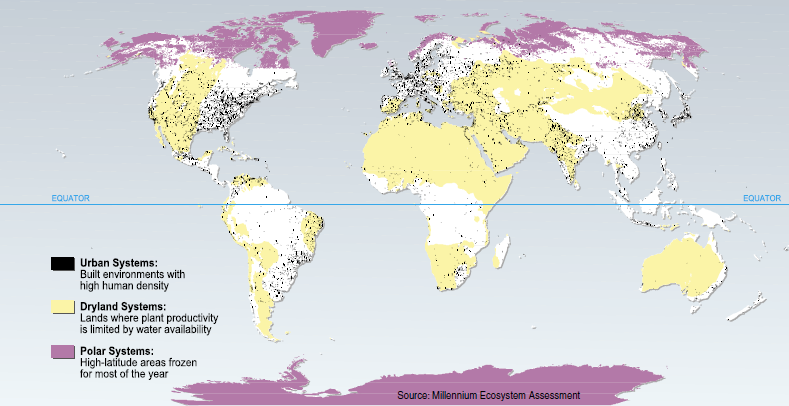
We report assessment findings for 10 categories of the land and marine surface, which we refer to as “systems”: forest, cultivated, dryland, coastal, marine, urban, polar, inland water, island, and mountain. Each category contains a number of ecosystems. However, ecosystems within each category share a suite of biological, climatic, and social factors that tend to be similar within categories and differ across categories. The MA reporting categories are not spatially exclusive; their areas often overlap. For example, transition zones between forest and cultivated lands are included in both the forest system and cultivated system reporting categories. These reporting categories were selected because they correspond to the regions of responsibility of different government ministries (such as agriculture, water, forestry, and so forth) and because they are the categories used within the Convention on Biological Diversity. Marine, Coastal, and Island Systems
Urban, Dryland, and Polar Systems
Forest Systems
Cultivated Systems
Inland Water and Mountain Systems
|


The ecosystems and biomes that have been most significantly altered globally by human activity include marine and freshwater ecosystems, temperate broadleaf forests (Biome), temperate grasslands (Biome), Mediterranean forests, and tropical dry forests. (See Figure 1.2 and C18, C20.) Within marine systems, the world’s demand for food and animal feed over the last 50 years has resulted in fishing pressure so strong that the biomass of both targeted species and those caught incidentally (the “bycatch”) has been reduced in much of the world to one tenth of the levels prior to the onset of industrial fishing (C18.ES). Globally, the degradation of fisheries is also reflected in the fact that the fish being harvested are increasingly coming from the less valuable lower trophic levels as [[population]s] of higher trophic level species are depleted. (See Figure 1.3.)

Freshwater ecosystems have been modified through the creation of dams and through the withdrawal of water for human use. The construction of dams and other structures along rivers has moderately or strongly affected flows in 60% of the large river systems in the world (C20.4.2). Water removal for human uses has reduced the flow of several major rivers, including the Nile, Yellow, and Colorado Rivers, to the extent that they do not always flow to the sea. As water flows have declined, so have sediment flows, which are the source of nutrients important for the maintenance of estuaries. Worldwide, although human activities have increased sediment flows in rivers by about 20%, reservoirs and water diversions prevent about 30% of sediments from reaching the oceans, resulting in a net reduction of sediment delivery to estuaries of roughly 10% (C19.ES).
Within terrestrial ecosystems, more than two thirds of the area of 2 of the world’s 14 major [[terrestrial] biomes] (temperate grasslands and Mediterranean forests) and more than half of the area of 4 other biomes (tropical dry forests, temperate broadleaf forests, tropical grassland, and flooded grasslands) had been converted (primarily to agriculture) by 1990, as Figure 1.3 indicated. Among the major biomes, only tundra and boreal forests show negligible levels of loss and conversion, although they have begun to be affected by climate change.
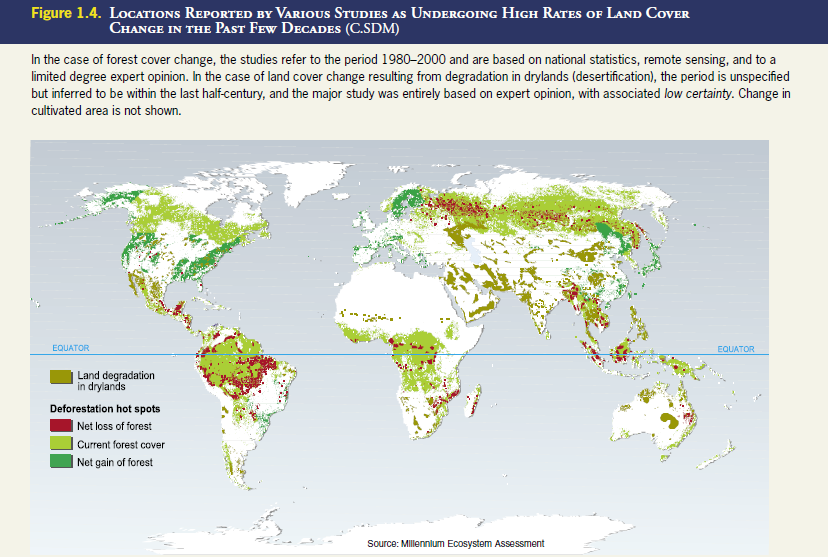
Globally, the rate of conversion of ecosystems has begun to slow largely due to reductions in the rate of expansion of cultivated land, and in some regions (particularly in temperate zones) ecosystems are returning to conditions and species compositions similar to their pre-conversion states. Yet rates of ecosystem conversion remain high or are increasing for specific ecosystems and regions. Under the aegis of the MA, the first systematic examination of the status and trends in terrestrial and coastal land cover was carried out using global and regional datasets. The pattern of deforestation, afforestation, and dryland degradation between 1980 and 2000 is shown in Figure 1.4. Opportunities for further expansion of cultivation are diminishing in many regions of the world as most of the land well-suited for intensive agriculture has been converted to cultivation (C26. ES). Increased agricultural productivity is also diminishing the need for agricultural expansion.

As a result of these two factors, a greater fraction of land in cultivated systems (areas with at least 30% of land cultivated) is actually being cultivated, the intensity of cultivation of land is increasing, fallow lengths are decreasing, and management practices are shifting from monocultures to polycultures. Since 1950, cropland areas have stabilized in North America and decreased in Europe and China (C26.1.1). Cropland areas in the Former Soviet Union have decreased since 1960 (C26.1.1). Within temperate and boreal zones, forest cover increased by approximately 2.9 million hectares per year in the 1990s, of which approximately 40% was forest plantations (C21.4.2). In some cases, rates of conversion of ecosystems have apparently slowed because most of the ecosystem has now been converted, as is the case with temperate broadleaf forests and Mediterranean forests (C4.4.3)
Ecosystem Processes
Ecosystem processes, including water, nitrogen, carbon, and phosphorus cycling, changed more rapidly in the second half of the twentieth century than at any time in recorded human history. Human modifications of ecosystems have changed not only the structure of the systems (such as what habitats or species are present in a particular location), but their processes and functioning as well. The capacity of ecosystems to provide services derives directly from the operation of natural biogeochemical cycles that in some cases have been significantly modified.
- Water Cycle: Water withdrawals from rivers and lakes for irrigation or for urban or industrial use doubled between 1960 and 2000 (C7.2.4). (Worldwide, 70% of water use is for agriculture (C7.2.2).) Large reservoir construction has doubled or tripled the residence time of river water—the average time, that is, that a drop of water takes to reach the sea (C7.3.2). Globally, humans use slightly more than 10% of the available renewable freshwater supply through household, agricultural, and industrial activities (C7.2.3), although in some regions such as the Middle East and North Africa, humans use 120% of renewable supplies (the excess is obtained through the use of groundwater supplies at rates greater than their rate of recharge) (C7.2.2).
- Carbon Cycle: Since 1750, the atmospheric concentration of carbon dioxide has increased by about 34% (from about 280 parts per million to 376 parts per million in 2003) (S7.3.1). Approximately 60% of that increase (60 parts per million) has taken place since 1959. The effect of changes in terrestrial ecosystems on the carbon cycle reversed during the last 50 years. Those ecosystems were on average a net source of CO2 during the nineteenth and early twentieth centuries (primarily due to deforestation, but with contributions from degradation of agricultural, pasture, and forestlands) and became a net sink sometime around the middle of the last century (although carbon losses from land use change continue at high levels) (high certainty). Factors contributing to the growth of the role of ecosystems in carbon sequestration include afforestation, reforestation, and forest management in North America, Europe, China, and other regions; changed agriculture practices; and the fertilizing effects of nitrogen deposition and increasing atmospheric CO2 (high certainty) (C13.ES).
- Nitrogen Cycle: The total amount of reactive, or biologically available, nitrogen created by human activities increased ninefold between 1890 and 1990, with most of that increase taking place in the second half of the century in association with increased use of fertilizers (S7.3.2). (See Figures 1.5 and 1.6.) A recent study of global human contributions to reactive nitrogen flows projected that flows will increase from approximately 165 teragrams of reactive nitrogen in 1999 to 270 teragrams in 2050, an increase of 64% (R9 Fig 9.1). More than half of all the synthetic nitrogen fertilizer (which was first produced in 1913) ever used on the planet has been used since 1985 (R9.2). Human activities have now roughly doubled the rate of creation of reactive nitrogen on the land surfaces of Earth (R9.2). The flux of reactive nitrogen to the oceans increased by nearly 80% from 1860 to 1990, from roughly 27 teragrams of nitrogen per year to 48 teragrams in 1990 (R9). (This change is not uniform over Earth, however, and while some regions such as Labrador and Hudson’s Bay in Canada have seen little if any change, the fluxes from more developed regions such as the northeastern United States, the watersheds of the North Sea in Europe, and the Yellow River basin in China have increased ten- to fifteenfold.)
- Phosphorus Cycle: The use of phosphorus fertilizers and the rate of phosphorus accumulation in agricultural soils increased nearly threefold between 1960 and 1990, although the rate has declined somewhat since that time (S7 Fig 7.18). The current flux of phosphorus to the oceans is now triple that of background rates (approximately 22 teragrams of phosphorus per year versus the natural flux of 8 teragrams) (R9.2)

Species
A change in an ecosystem necessarily affects the species in the system, and changes in species affect ecosystem processes.
The distribution of species on Earth is becoming more homogenous. By homogenous, we mean that the differences between the set of species at one location on the planet and the set at another location are, on average, diminishing. The natural process of evolution, and particularly the combination of natural barriers to migration and local adaptation of species, led to significant differences in the types of species in ecosystems in different regions. But these regional differences in the planet’s biota are now being diminished.
Two factors are responsible for this trend. First, the extinction of species or the loss of [[population]s] results in the loss of the presence of species that had been unique to particular regions. Second, the rate of invasion (Invasion fact sheet) or introduction of species into new ranges is already high and continues to accelerate apace with growing trade and faster transportation. (See Figure 1.7.) For example, a high proportion of the roughly 100 non-native species in the Baltic Sea are native to the North American Great Lakes, and 75% of the recent arrivals of about 170 non-native species in the Great Lakes are native to the Baltic Sea (S10.5). When species decline or go extinct as a result of human activities, they are replaced by a much smaller number of expanding species that thrive in human-altered environments. One effect is that in some regions where diversity has been low, the biotic diversity may actually increase—a result of invasions of non-native forms. (This is true in continental areas such as the Netherlands as well as on oceanic islands.)

Across a range of taxonomic groups, either the population size or range or both of the majority of species is currently declining. Studies of amphibians globally, African mammals, birds in agricultural lands, British butterflies, Caribbean corals, and fishery species show the majority of species to be declining in range or number. Exceptions include species that have been protected in reserves, that have had their particular threats (such as overexploitation) eliminated, or that tend to thrive in landscapes that have been modified by human activity (C4.ES).
Between 10% and 30% of mammal, bird, and amphibian species are currently threatened with extinction (medium to high certainty), based on IUCN–World Conservation Union criteria for threats of extinction. As of 2004, comprehensive assessments of every species within major taxonomic groups have been completed for only three groups of animals (mammals, birds, and amphibians) and two plant groups (conifers and cycads, a group of evergreen palm-like plants). Specialists on these groups have categorized species as “threatened with extinction” if they meet a set of quantitative criteria involving their population size, the size of area in which they are found, and trends in population size or area. (Under the widely used IUCN criteria for extinction, the vast majority of species categorized as “threatened with extinction” have approximately a 10% chance of going extinct within 100 years, although some long-lived species will persist much longer even though their small population size and lack of recruitment means that they have a very high likelihood of extinction.) Twelve percent of bird species, 23% of mammals, and 25% of conifers are currently threatened with extinction; 32% of amphibians are threatened with extinction, but information is more limited and this may be an underestimate. Higher levels of threat have been found in the cycads, where 52% are threatened (C4.ES). In general, freshwater habitats tend to have the highest proportion of threatened species (C4.5.2).

Over the past few hundred years, humans have increased the species extinction rate by as much as 1,000 times background rates typical over the planet’s history (medium certainty) (C4.ES, C4.4.2.). (See Figure 1.8.) Extinction is a natural part of Earth’s history. Most estimates of the total number of species today lie between 5 million and 30 million, although the overall total could be higher than 30 million if poorly known groups such as deep-sea organisms, fungi, and microorganisms including parasites have more species than currently estimated. Species present today only represent 2–4% of all species that have ever lived. The fossil record appears to be punctuated by five major mass extinctions, the most recent of which occurred 65 million years ago.
The average rate of extinction found for marine and mammal fossil species (excluding extinctions that occurred in the five major mass extinctions) is approximately 0.1–1 extinctions per million species per year. There are approximately 100 documented extinctions of birds, mammal, and amphibians over the past 100 years, a rate 50–500 times higher than background rates. Including possibly extinct species, the rate is more than 1,000 times higher than background rates. Although the data and techniques used to estimate current extinction rates have improved over the past two decades, significant uncertainty still exists in measuring current rates of extinction because the extent of extinctions of undescribed taxa is unknown, the status of many described species is poorly known, it is difficult to document the final disappearance of very rare species, and there are time lags between the impact of a threatening process and the resulting extinction.

Genes
Genetic diversity has declined globally, particularly among cultivated species. The extinction of species and loss of unique populations has resulted in the loss of unique genetic diversity contained by those species and populations. For wild species, there are few data on the actual changes in the magnitude and distribution of genetic diversity (C4.4), although studies have documented declining genetic diversity in wild species that have been heavily exploited. In cultivated systems, since 1960 there has been a fundamental shift in the pattern of intra-species diversity in farmers’ fields and farming systems as the crop varieties planted by farmers have shifted from locally adapted and developed [[population]s] (land races) to more widely adapted varieties produced through formal breeding systems (modern varieties). Roughly 80% of wheat area in developing countries and three quarters of the rice area in Asia is planted with modern varieties (C26.2.1). (For other crops, such as maize, sorghum and millet, the proportion of area planted to modern varieties is far smaller.) The on-farm losses of genetic diversity of crops and livestock have been partially offset by the maintenance of genetic diversity in seed banks.
How have ecosystem services and their uses changed?

Ecosystem services are the benefits provided by ecosystems. These include provisioning services such as food, water, timber, fiber, and genetic resources; regulating services such as the regulation of climate, floods, disease, and water quality as well as waste treatment; cultural services such as recreation, aesthetic enjoyment, and spiritual fulfillment; and supporting services such as soil formation, pollination, and nutrient cycling. (See Box 2.1.)
Human use of all ecosystem services is growing rapidly. Approximately 60% (15 out of 24) of the ecosystem services evaluated in this assessment (including 70% of regulating and cultural services) are being degraded or used unsustainably. (See Table 2.1.) Of 24 provisioning, cultural, and regulating ecosystem services for which sufficient information was available, the use of 20 continues to increase. The use of one service, capture fisheries (Fisheries and aquaculture), is now declining as a result of a decline in the quantity of fish, which in turn is due to excessive capture of fish in past decades. Two other services (fuelwood and fiber) show mixed patterns. The use of some types of fiber is increasing and others decreasing; in the case of fuelwood, there is evidence of a recent peak in use.
Humans have enhanced production of three ecosystem services – crops, livestock, and aquaculture – through expansion of the area devoted to their production or through technological inputs. Recently, the service of carbon sequestration has been enhanced globally, due in part to the re-growth of forests in temperate regions, although previously deforestation had been a net source of carbon emissions. Half of provisioning services (6 of 11) and nearly 70% (9 of 13) of regulating and cultural services are being degraded or used unsustainably.
- Provisioning Services: The quantity of provisioning ecosystem services such as food, water, and timber used by humans increased rapidly, often more rapidly than population (Population growth rate) growth although generally slower than economic growth, during the second half of the twentieth century. And it continues to grow. In a number of cases, provisioning services are being used at unsustainable rates. The growing human use has been made possible by a combination of substantial increases in the absolute amount of some services produced by ecosystems and an increase in the fraction used by humans. World population doubled between 1960 and 2000, from 3 billion to 6 billion people, and the global economy increased more than sixfold. During this time, food production increased by roughly two-and-a-half times (a 160% increase in food production between 1961 and 2003), water use doubled, wood harvests for pulp and paper tripled, and timber production increased by nearly 60% (C9.ES, C9.2.2, S7, C7.2.3, C8.1). (Food production increased fourfold in developing countries over this period.) The sustainability of the use of provisioning services differs in different locations. However, the use of several provisioning services is unsustainable even in the global aggregate. The current level of use of capture fisheries (marine (Marine fisheries) and freshwater (Fisheries and aquaculture)) is not sustainable, and many fisheries have already collapsed. (See Figure 2.1.) Currently, one quarter of important commercial fish stocks are overexploited or significantly depleted (high certainty) (C8.2.2). From 5% to possibly 25% of global freshwater use exceeds longterm accessible supplies and is maintained only through engineered water transfers or the overdraft of groundwater supplies (low to medium certainty) (C7.ES). Between 15% and 35% of irrigation withdrawals exceed supply rates and are therefore unsustainable (low to medium certainty) (C7.2.2). Current agricultural practices are also unsustainable in some regions due to their reliance on unsustainable sources of water, harmful impacts caused by excessive nutrient or pesticide use, salinization, nutrient depletion, and rates of soil loss that exceed rates of soil formation.
- Regulating Services: Humans have substantially altered regulating services such as disease and climate regulation by modifying the ecosystem providing the service and, in the case of waste processing services, by exceeding the capabilities of ecosystems to provide the service. Most changes to regulating services are inadvertent results of actions taken to enhance the supply of provisioning services. Humans have substantially modified the climate regulation service of ecosystems—first through [[land use change]s] that contributed to increases in the amount of carbon dioxide and other greenhouse gases such as methane and nitrous oxide in the atmosphere and more recently by increasing the sequestration of carbon dioxide (although ecosystems remain a net source of methane and nitrous oxide). Modifications of ecosystems have altered patterns of disease by increasing or decreasing habitat for certain diseases or their vectors (such as dams and irrigation canals that provide habitat for schistosomiasis) or by bringing human [[population]s] into closer contact with various disease organisms. Changes to ecosystems have contributed to a significant rise in the number of floods and major wildfires on all continents since the 1940s. Ecosystems serve an important role in detoxifying wastes introduced into the environment, but there are intrinsic limits to that waste processing capability. For example, aquatic ecosystems “cleanse” on average 80% of their global incident nitrogen loading, but this intrinsic self-purification capacity varies widely and is being reduced by the loss of wetlands (C7.2.5).
- Cultural Services: Although the use of cultural services has continued to grow, the capability of ecosystems to provide cultural benefits has been significantly diminished in the past century (C17). Human cultures are strongly influenced by ecosystems, and ecosystem change can have a significant impact on cultural identity and social stability. Human cultures, knowledge systems, religions, heritage values, social interactions, and the linked amenity services (such as aesthetic enjoyment, recreation, artistic and spiritual fulfillment, and intellectual development) have always been influenced and shaped by the nature of the ecosystem and ecosystem conditions. Many of these benefits are being degraded, either through changes to ecosystems (a recent rapid decline in the numbers of sacred groves and other such protected areas, for example) or through societal changes (such as the loss of languages or of traditional knowledge) that reduce people’s recognition or appreciation of those cultural benefits. Rapid loss of culturally valued ecosystems and landscapes can contribute to social disruptions and societal marginalization. And there has been a decline in the quantity and quality of aesthetically pleasing natural landscapes.
|
|
|
Ecosystem services are the benefits people obtain from ecosystems. These include provisioning, regulating, and cultural services that directly affect people and the supporting services needed to maintain other services (CF2). Many of the services listed here are highly interlinked. (Primary production, photosynthesis, nutrient cycling, and water cycling, for example, all involve different aspects of the same biological processes.) Provisioning Services These are the products obtained from ecosystems, including: Food. This includes the vast range of food products derived from plants, animals, and microbes. Fiber. Materials included here are wood, jute, cotton, hemp, silk, and wool. Fuel. Wood, dung, and other biological materials serve as sources of energy. Genetic resources. This includes the genes and genetic information used for animal and plant breeding and biotechnology. Biochemicals, natural medicines, and pharmaceuticals. Many medicines, biocides, food additives such as alginates, and biological materials are derived from ecosystems. Ornamental resources. Animal and plant products, such as skins, shells, and flowers, are used as ornaments, and whole plants are used for landscaping and ornaments. Fresh water. People obtain fresh water from ecosystems and thus the supply of fresh water can be considered a provisioning service. Fresh water in rivers is also a source of energy. Because water is required for other life to exist, however, it could also be considered a supporting service. Regulating Services These are the benefits obtained from the regulation of ecosystem processes, including: Air quality regulation. Ecosystems both contribute chemicals to and extract chemicals from the atmosphere, influencing many aspects of air quality. Climate regulation. Ecosystems influence climate both locally and globally. At a local scale, for example, changes in land cover can affect both temperature and precipitation. At the global scale, ecosystems play an important role in climate by either sequestering or emitting greenhouse gases. Water regulation. The timing and magnitude of runoff, flooding, and aquifer recharge can be strongly influenced by changes in land cover, including, in particular, alterations that change the water storage potential of the system, such as the conversion of wetlands or the replacement of forests with croplands or croplands with urban areas. Erosion regulation. Vegetative cover plays an important role in soil retention and the prevention of landslides. Water purification and waste treatment. Ecosystems can be a source of impurities (for instance, in fresh water) but also can help filter out and decompose organic wastes introduced into inland waters and coastal and marine ecosystems and can assimilate and detoxify compounds through soil and subsoil processes. Disease regulation. Changes in ecosystems can directly change the abundance of human pathogens, such as cholera, and can alter the abundance of disease vectors, such as mosquitoes. Pest regulation. Ecosystem changes affect the prevalence of crop and livestock pests and diseases. Pollination. Ecosystem changes affect the distribution, abundance, and effectiveness of pollinators. Natural hazard regulation. The presence of coastal ecosystems such as mangroves and coral reefs can reduce the damage caused by hurricanes or large waves. Cultural Services These are the non-material benefits people obtain from ecosystems through spiritual enrichment, cognitive development, reflection, recreation, and aesthetic experiences, including: Cultural diversity. The diversity of ecosystems is one factor influencing the diversity of cultures. Spiritual and religious values. Many religions attach spiritual and religious values to ecosystems or their components. Knowledge systems (traditional and formal). Ecosystems influence the types of knowledge systems developed by different cultures. Educational values. Ecosystems and their components and processes provide the basis for both formal and informal education in many societies. Inspiration. Ecosystems provide a rich source of inspiration for art, folklore, national symbols, architecture, and advertising. Aesthetic values. Many people find beauty or aesthetic value in various aspects of ecosystems, as reflected in the support for parks, scenic drives, and the selection of housing locations. Social relations. Ecosystems influence the types of social relations that are established in particular cultures. Fishing societies, for example, differ in many respects in their social relations from nomadic herding or agricultural societies. Sense of place. Many people value the “sense of place” that is associated with recognized features of their environment, including aspects of the ecosystem. Cultural heritage values. Many societies place high value on the maintenance of either historically important landscapes (“cultural landscapes”) or culturally significant species. Recreation and ecotourism. People often choose where to spend their leisure time based in part on the characteristics of the natural or cultivated landscapes in a particular area. Supporting Services Supporting services are those that are necessary for the production of all other ecosystem services. They differ from provisioning, regulating, and cultural services in that their impacts on people are often indirect or occur over a very long time, whereas changes in the other categories have relatively direct and short-term impacts on people. (Some services, like erosion regulation, can be categorized as both a supporting and a regulating service, depending on the time scale and immediacy of their impact on people.) These services include: Soil Formation. Because many provisioning services depend on soil fertility, the rate of soil formation influences human well-being in many ways. Photosynthesis. Photosynthesis produces oxygen necessary for most living organisms. Primary production. The assimilation or accumulation of energy and nutrients by organisms. Nutrient cycling. Approximately 20 nutrients essential for life, including nitrogen and phosphorus, cycle through ecosystems and are maintained at different concentrations in different parts of ecosystems. Water cycling. Water cycles through ecosystems and is essential for living organisms. |


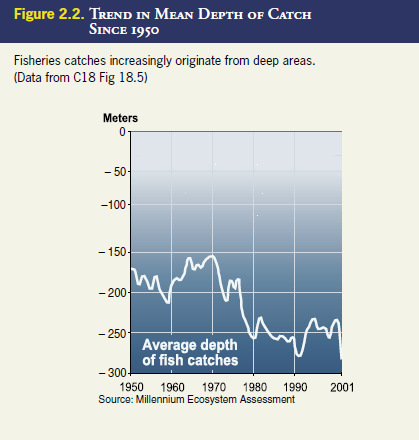
Global gains in the supply of food, water, timber, and other provisioning services were often achieved in the past century despite local resource depletion and local restrictions on resource use by shifting production and harvest to new underexploited regions, sometimes considerable distances away. These options are diminishing. This trend is most distinct in the case of [[marine (Marine fisheries)] fisheries]. As individual stocks have been depleted, fishing pressure has shifted to less exploited stocks (C18.2.1). Industrial fishing fleets have also shifted to fishing further offshore and in deeper water to meet global demand (C18.ES). (See Figure 2.2.) A variety of drivers related to market demand, supply, and government policies have influenced patterns of timber harvest. For example, international trade in forest products increases when a nation’s forests no longer can meet demand or when policies have been established to restrict or ban timber harvest.
 Source: Millennium Ecosystem Assessment
Although human demand for ecosystem services continues to grow in the aggregate, the demand for particular services in specific regions is declining as substitutes are developed For example, kerosene, electricity, and other energy sources are increasingly being substituted for fuelwood (still the primary source of energy for heating and cooking for some 2.6 billion people) (C9.ES). The substitution of a variety of other materials for wood (such as vinyl, plastics, and metal) has contributed to relatively slow growth in global timber consumption in recent years (C9.2.1). While the use of substitutes can reduce pressure on specific ecosystem services, this may not always have positive net environmental benefits. Substitution of fuelwood by fossil fuels, for example, reduces pressure on forests and lowers indoor air pollution, but it may increase net greenhouse gas emissions. Substitutes are also often costlier to provide than the original ecosystem services.
Both the supply and the resilience of ecosystem services are affected by changes in biodiversity. Biodiversity is the variability among living organisms and the ecological complexes of which they are part. When a species is lost from a particular location (even if it does not go extinct globally) or introduced to a new location, the various ecosystem services associated with that species are changed. More generally, when a habitat is converted, an array of ecosystem services associated with the species present in that location is changed, often with direct and immediate impacts on people (S10). Changes in biodiversity also have numerous indirect impacts on ecosystem services over longer time periods, including influencing the capacity of ecosystems to adjust to changing environments (medium certainty), causing disproportionately large and sometimes irreversible changes in ecosystem processes, influencing the potential for infectious disease transmission, and, in [[agricultural] systems], influencing the risk of crop failure in a variable environment and altering the potential impacts of pests and pathogens (medium to high certainty) (C11.ES, C14.ES).
The modification of an ecosystem to alter one ecosystem service (to increase food or timber production, for instance) generally results in changes to other ecosystem services as well (CWG, SG7). Trade-offs among ecosystem services are commonplace. (See Table 2.2.) For example, actions to increase food production often involve one or more of the following: increased water use, degraded water quality, reduced biodiversity, reduced forest cover, loss of forest products, or release of greenhouse gases. Frequent cultivation, irrigated rice production, livestock production, and burning of cleared areas and crop residues now release 1,600±800 million tons of carbon per year in CO2 (C26. ES). Cultivation, irrigated rice production, and livestock production release between 106 million and 201 million tons of carbon per year in methane (C13 Table 13.1). About 70% of anthropogenic nitrous oxide gas emissions are attributable to agriculture, mostly from land conversion and nitrogen fertilizer use (C26. ES). Similarly, the conversion of forest to agriculture can significantly change flood frequency and magnitude, although the amount and direction of this impact is highly dependent on the characteristics of the local ecosystem and the nature of the land cover change (C21.5.2).
Many trade-offs associated with ecosystem services are expressed in areas remote from the site of degradation. For example, conversion of forests to agriculture can affect water quality and flood frequency downstream of where the ecosystem change occurred. And increased application of nitrogen fertilizers to croplands can have negative impacts on [[coast]al water] quality. These trade-offs are rarely taken fully into account in decision-making, partly due to the sectoral nature of planning and partly because some of the effects are also displaced in time (such as long-term climate impacts).
The net benefits gained through actions to increase the productivity or harvest of ecosystem services have been less than initially believed after taking into account negative trade-offs. The benefits of resource management actions have traditionally been evaluated only from the standpoint of the service targeted by the management intervention. However, management interventions to increase any particular service almost always result in costs to other services. Negative trade-offs are commonly found between individual provisioning services and between provisioning services and the combined regulating, cultural, and supporting services and biodiversity. Taking the costs of these negative trade-offs into account reduces the apparent benefits of the various management interventions. For example:
- Expansion of commercial shrimp farming has had serious impacts on ecosystems, including loss of vegetation, deterioration of water quality, decline of capture fisheries (Fisheries and aquaculture), and loss of biodiversity (R6, C19).
- Expansion of livestock production around the world has often led to overgrazing and dryland degradation, rangeland fragmentation, loss of wildlife habitat, dust formation, bush encroachment, deforestation, nutrient overload through disposal of manure, and greenhouse gas emissions (R6.ES).
- Poorly designed and executed agricultural policies led to an irreversible change in the Aral Sea ecosystem. By 1998, the Aral Sea had lost more than 60% of its area and approximately 80% of its volume, and ecosystem-related problems in the region now include excessive salt content of major rivers, contamination of agricultural products with agrochemicals, high levels of turbidity in major water sources, high levels of [[pesticide]s] and phenols in surface waters, loss of soil fertility, extinctions of species, and destruction of commercial fisheries (R6 Box 6.9).
- Forested riparian wetlands adjacent to the Mississippi River in the United States had the capacity to store about 60 days of river discharge. With the removal of the wetlands through canalization, leveeing, and draining, the remaining wetlands have a storage capacity of less than 12 days discharge, an 80% reduction in flood storage capacity (C16.1.1).
However, positive synergies can be achieved as well when actions to conserve or enhance a particular component of an ecosystem or its services benefit other services or stakeholders. Agroforestry can meet human needs for food and fuel, restore soils, and contribute to biodiversity conservation. Intercropping can increase yields, increase biocontrol, reduce soil erosion, and reduce weed invasion in fields. Urban parks and other urban green spaces provide spiritual, aesthetic, educational, and recreational benefits as well as such services such as water purification, wildlife habitat, waste management, and carbon sequestration. Protection of natural forests for biodiversity conservation can also reduce carbon emissions and protect water supplies. Protection of wetlands can contribute to flood control and also help to remove pollutants such as phosphorus and nitrogen from the water. For example, it is estimated that the nitrogen load from the heavily polluted Illinois River basin to the Mississippi River could be cut in half by converting 7% of the basin back to wetlands (R9.4.5). Positive synergies often exist among regulating, cultural, and supporting services and with biodiversity conservation.

How have ecosystem changes affected human well-being and poverty alleviation?
Relationships between Ecosystem Services and Human Well-being
Changes in ecosystem services influence all components of human well-being, including the basic material needs for a good life, health, good social relations, security, and freedom of choice and action (CF3). (See Box 3.1.) Humans are fully dependent on Earth’s ecosystems and the services that they provide, such as food, clean water, disease regulation, climate regulation, spiritual fulfillment, and aesthetic enjoyment. The relationship between ecosystem services and human well-being is mediated by access to manufactured, human, and social capital. Human well-being depends on ecosystem services but also on the supply and quality of social capital, technology, and institutions. These factors mediate the relationship between ecosystem services and human well-being in ways that remain contested and incompletely understood. The relationship between human well- being and ecosystem services is not linear. When an ecosystem service is abundant relative to the demand, a marginal increase in ecosystem services generally contributes only slightly to human well-being (or may even diminish it). But when the service is relatively scarce, a small decrease can substantially reduce human well-being (S.SDM, SG3.4).
Ecosystem services contribute significantly to global employment and economic activity (Global economy). The ecosystem service of food production contributes by far the most to economic activity and employment. In 2000, the market value of food production was $981 billion, or roughly 3% of gross world product, but it is a much higher share of GDP within developing countries (C8 Table 8.1). That year, for example, agriculture (including forest (Forestry)ry and fishing) represented 24% of total GDP in countries with per capita incomes less than $765 (the low-income developing countries, as defined by the World Bank) (C26.5.1). The agricultural labor force contained 1.3 billion people globally—approximately a fourth (22%) of the world’s population and half (46%) of the total labor force—and some 2.6 billion people, more than 40% of the world, lived in agriculturally based households (C26.5.1). Significant differences exist between developing and industrial countries in these patterns. For example, in the United States only 2.4% of the labor force works in agriculture.
Other ecosystem services (or commodities based on ecosystem services) that make significant contributions to national economic activity include timber (around $400 billion), [[marine (Marine fisheries)] fisheries] (around $80 billion in 2000), marine aquaculture ($57 billion in 2000), recreational hunting and fishing ($50 billion and $24–37 billion annually respectively in the United States alone), as well as edible forest products, botanical medicines, and medicinal plants (C9.ES, C18.1, C20.ES). And many other industrial products and commodities rely on ecosystem services such as water as inputs.
The degradation of ecosystem services represents a loss of a capital asset (C5.4.1). (See Figure 3.1.) Both renewable resources such as ecosystem services and nonrenewable resources such as mineral deposits, soil nutrients, and fossil fuels are capital assets. Yet traditional national accounts do not include measures of resource depletion or of the degradation of renewable resources. As a result, a country could cut its forests and deplete its fisheries, and this would show only as a positive gain to GDP despite the loss of the capital asset. Moreover, many ecosystem services are available freely to those who use them (fresh water in aquifers, for instance, or the use of the atmosphere as a sink for pollutants (Air pollution)), and so again their degradation is not reflected in standard economic measures.
When estimates of the economic losses associated with the depletion of natural assets are factored into measurements of the total wealth of nations, they significantly change the balance sheet of those countries with economies especially dependent on natural resources. For example, countries such as Ecuador, Ethiopia, Kazakhstan, Republic of Congo, Trinidad and Tobago, Uzbekistan, and Venezuela that had positive growth in net savings (reflecting a growth in the net wealth of the country) in 2001 actually experienced a loss in net savings when depletion of natural resources (energy and forests) and estimated damages from carbon emissions (associated with contributions to climate change) were factored into the accounts. In 2001, in 39 countries out of the 122 countries for which sufficient data were available, net national savings (expressed as a percent of gross national income) were reduced by at least 5% when costs associated with the depletion of natural resources (unsustainable forestry, depletion of fossil fuels) and damage from carbon emissions were included.

|
|
|
Human well-being has five main components: the basic material needs for a good life, health, good social relations, security, and freedom of choice and action. (See Box Figure A.) This last component is influenced by other constituents of well-being (as well as by other factors including, notably, education) and is also a precondition for achieving other components of well-being, particularly with respect to equity and fairness. Human well-being is a continuum— from extreme deprivation, or poverty, to a high attainment or experience of well-being. Ecosystems underpin human well-being through supporting, provisioning, regulating, and cultural services. Well-being also depends on the supply and quality of human services, technology, and institutions.
Basic Materials for a Good Life This refers to the ability to have a secure and adequate livelihood, including income and assets, enough food and water at all times, shelter, ability to have energy to keep warm and cool, and access to goods. Changes in provisioning services such as food, water, and fuelwood have very strong impacts on the adequacy of material for a good life. Access to these materials is heavily mediated by socioeconomic circumstances. For the wealthy, local changes in ecosystems may not cause a significant change in their access to necessary material goods, which can be purchased from other locations, sometimes at artificially low prices if governments provide subsidies (for example, water delivery systems). Changes in regulating services influencing water supply, pollination and food production, and climate have very strong impacts on this element of human well-being. These, too, can be mediated by socioeconomic circumstances, but to a smaller extent. Changes in cultural services have relatively weak linkages to material elements of well-being. Changes in supporting services have a strong influence by virtue of their influence on provisioning and regulating services. The following are some examples of material components of well-being affected by ecosystem change.
Health By health, we refer to the ability of an individual to feel well and be strong, or in other words to be adequately nourished and free from disease, to have access to adequate and clean drinking water and clean air, and to have the ability to have energy to keep warm and cool. Human health is both a product and a determinant of well-being. Changes in provisioning services such as food, water, medicinal plants, and access to new medicines and changes in regulating services that influence air quality, water quality, disease regulation, and waste treatment also have very strong impacts on health. Changes in cultural services can have strong influences on health, since they affect spiritual, inspirational, aesthetic, and recreational opportunities, and these in turn affect both physical and emotional states. Changes in supporting services have a strong influence on all of the other categories of services. These benefits are moderately mediated by socioeconomic circumstances. The wealthy can purchase substitutes for some health benefits of ecosystems (such as medicinal plants or water quality), but they are more susceptible to changes affecting air quality. The following are some examples of health components of well-being affected by ecosystem change.
Good Social Relations Good social relations refer to the presence of social cohesion, mutual respect, and the ability to help others and provide for children. Changes in provisioning and regulating ecosystem services can affect social relations, principally through their more direct impacts on material well-being, health, and security. Changes in cultural services can have a strong influence on social relations, particularly in cultures that have retained strong connections to local environments. Changes in provisioning and regulating services can be mediated by socioeconomic factors, but those in cultural services cannot. Even a wealthy country like Sweden or the United Kingdom cannot readily purchase a substitute to a cultural landscape that is valued by the people in the community. Changes in ecosystems have tended to increase the accessibility that people have to ecosystems for recreation and ecotourism. There are clear examples of declining ecosystem services disrupting social relations or resulting in conflicts. Indigenous societies whose cultural identities are tied closely to particular habitats or wildlife suffer if habitats are destroyed or wildlife populations decline. Such impacts have been observed in coastal fishing communities, Arctic populations, traditional forest societies, and pastoral nomadic societies (C5.4.4).
Security By security, we refer to safety of person and possessions, secure access to necessary resources, and security from natural and human-made disasters. Changes in regulating services such as disease regulation, climate regulation, and flood regulation have very strong influences on security. Changes in provisioning services such as food and water have strong impacts on security, since degradation of these can lead to loss of access to these essential resources. Changes in cultural services can influence security since they can contribute to the breakdown or strengthening of social networks within society. Changes in supporting services have a strong influence by virtue of their influence on all the other categories of services. These benefits are moderately mediated by socioeconomic circumstances. The wealthy have access to some safety nets that can minimize the impacts of some ecosystem changes (such as flood or drought insurance). Nevertheless, the wealthy cannot entirely escape exposure to some of these changes in areas where they live. One example of an aspect of security affected by ecosystem change involves influences on the severity and magnitude of floods and major fires. The incidence of these has increased significantly over the past 50 years. Changes in ecosystems and in the management of ecosystems have contributed to these trends. The canalization of rivers, for example, tends to decrease the incidence and impact of small flood events and increase the incidence and severity of large ones. On average, 140 million people are affected by floods each year—more than all other natural or technological disasters put together. Between 1990 and 1999, more than 100,000 people were killed in floods, which caused a total of $243 billion in damages (C7.4.4). Freedom of Choice and Action Freedom of choice and action refers to the ability of individuals to control what happens to them and to be able to achieve what they value doing or being. Freedom and choice cannot exist without the presence of the other elements of well-being, so there is an indirect influence of changes in all categories of ecosystem services on the attainment of this constituent of well-being. The influence of ecosystem change on freedom and choice is heavily mediated by socioeconomic circumstances. The wealthy and people living in countries with efficient governments and strong civil society can maintain freedom and choice even in the face of significant ecosystem change, while this would be impossible for the poor if, for example, the ecosystem change resulted in a loss of livelihood. In the aggregate, the state of our knowledge about the impact that changing ecosystem conditions have on freedom and choice is relatively limited. Declining provision of fuelwood and drinking water have been shown to increase the amount of time needed to collect such basic necessities, which in turn reduces the amount of time available for education, employment, and care of family members. Such impacts are typically thought to be disproportionately experienced by women (although the empirical foundation for this view is relatively limited) (C5.4.2). |


The degradation of ecosystem services often causes significant harm to human well-being(C5 Box 5.2). The information available to assess the consequences of changes in ecosystem services for human well-being is relatively limited. Many ecosystem services have not been monitored and it is also difficult to estimate the relative influence of changes in ecosystem services in relation to other social, cultural, and economic factors that also affect human well-being. Nevertheless, the following evidence demonstrates that the harmful effects of the degradation of ecosystem services on livelihoods, health, and local and national economies are substantial.
- Most resource management decisions are most strongly influenced by ecosystem services entering markets; as a result, the non-marketed benefits are often lost or degraded. Many ecosystem services, such as the purification of water, regulation of floods, or provision of aesthetic benefits, do not pass through markets. The benefits they provide to society, therefore, are largely unrecorded: only a portion of the total benefits provided by an ecosystem make their way into statistics, and many of these are mis-attributed (the water regulation benefits of wetlands, for example, do not appear as benefits of wetlands but as higher profits in water-using sectors). Moreover, for ecosystem services that do not pass through markets there is often insufficient incentive for individuals to invest in maintenance (although in some cases common property management systems provide such incentives). Typically, even if individuals are aware of the services provided by an ecosystem, they are neither compensated for providing these services nor penalized for reducing them. These non-marketed benefits are often high and sometimes more valuable than the marketed benefits. For example:
- Total economic value of forests. One of the most comprehensive studies to date, which examined the marketed and non-marketed economic values associated with forests in eight Mediterranean countries, found that timber and fuelwoodgenerally accounted for less than a third of total economic value in each country. (See Figure 3.2.)
- Recreational benefits of protected areas: The annual recreational value of the coral reefs of each of six Marine Management Areas in the Hawaiian Islands in 2003 ranged from $300,000 to $35 million.
- Water quality: The net present value in 1998 of protecting water quality in the 360-kilometer Catawba River in the United States for five years was estimated to be $346 million.
- Water purification service of wetlands: About half of the total economic value of the Danube River Floodplain in 1992 could be accounted for in its role as a nutrient sink.
- Native pollinators: A study in Costa Rica found that forest- based pollinators increased coffee yields by 20% within 1 kilometer of the forest (as well as increasing the quality of the coffee). During 2000–03, pollination services from two forest fragments (of 46 and 111 hectares) thus increased the income of a 1,100-hectare farm by $60,000 a year, a value commensurate with expected revenues from competing land uses.
- Flood control: Muthurajawela Marsh, a 3,100-hectare coastal peat bog in Sri Lanka, provides an estimated $5 mil- lion in annual benefits ($1,750 per hectare) through its role in local flood control.
- The total economic value associated with managing ecosystems more sustainably is often higher than the value associated with the conversion of the ecosystem through farming, clear-cut logging, or other intensive uses. Relatively few studies have compared the total economic value (including values of both marketed and non-marketed ecosystem services) of ecosystems under alternate management regimes, but a number of studies that do exist have found that the benefit of managing the ecosystem more sustainably exceeded that of converting the ecosystem (see Figure 3.3), although the private benefits—that is, the actual monetary benefits captured from the services entering the market—would favor conversion or unsustainable management. These studies are consistent with the understanding that market failures associated with ecosystem services lead to greater conversion of ecosystems than is economically justified. However, this finding would not hold at all locations. For example, the value of conversion of an ecosystem in areas of prime agricultural land or in urban regions often exceeds the total economic value of the intact ecosystem. (Although even in dense urban areas, the total economic value of maintaining some “green space” can be greater than development of these sites.)

- The economic and public health costs associated with damage to ecosystem services can be substantial.
- The early 1990s collapse of the Newfoundland cod fishery due to overfishing (see Figure 3.4) resulted in the loss of tens of thousands of jobs and has cost at least $2 billion in income support and retraining.
- The cost of U.K. agriculture in 1996 resulting from the damage that agricultural practices cause to water (pollution (Water pollution), eutrophication), air (emissions of greenhouse gases), soil (off-site erosion damage, carbon dioxide loss), and biodiversity was $2.6 billion, or 9% of average yearly gross farm receipts for the 1990s. Similarly, the damage costs of freshwater eutrophication alone in England and Wales was estimated to be $105–160 million per year in the 1990s, with an additional $77 million per year being spent to address those damages.
- The burning of 10 million hectares of Indonesia’s forests in 1997/98 cost an estimated $9.3 billion in increased health care, lost production, and lost tourism revenues and affected some 20 million people across the region.
- The total damages for the Indian Ocean region over 20 years (with a 10% discount rate) resulting from the long-term impacts of the massive 1998 coral bleaching episode are estimated to be between $608 million (if there is only a slight decrease in tourism-generated income and employment results) and $8 billion (if tourism income and employment and fish productivity drop significantly and reefs cease to function as a protective barrier).
- The net annual loss of economic value associated with invasive species in the fynbos vegetation of the Cape Floral region of South Africa in 1997 was estimated to be $93.5 million, equivalent to a reduction of the potential economic value without the invasive species of more than 40%. The invasive species have caused losses of biodiversity, water, soil, and scenic beauty, although they also provide some benefits, such as provision of firewood.
- The incidence of diseases of marine organisms and emergence of new pathogens is increasing, and some of these, such as ciguatera, harm human health (C19.3.1). Episodes of harmful (including toxic) algal blooms in [[coast]al waters] are increasing in frequency and intensity, harming other marine resources such as fisheries and harming human health (R16 Figure 16.3). In a particularly severe outbreak in Italy in 1989, harmful algal blooms cost the coastal aquaculture industry $10 million and the Italian tourism industry $11.4 million (C19.3.1).
- The number of both floods and fires has increased significantly, in part due to ecosystem changes, in the past 50 years. Examples are the increased susceptibility of coastal populations to tropical storms when mangrove forests are cleared and the increase in downstream flooding that followed [[land use change]s] in the upper Yangtze River (C.SDM). Annual economic losses from extreme events increased tenfold from the 1950s to approximately $70 billion in 2003, of which natural catastrophes—floods, fires, storms, drought, and earthquakes—accounted for 84% of insured losses.
- Significant investments are often needed to restore or maintain non-marketed ecosystem services.
- In South Africa, invasive tree species threaten both native species and water flows by encroaching into natural habitats, with serious impacts for economic growth and human well-being. In response, the South African government established the “Working for Water Programme.” Between 1995 and 2001 the program invested $131 million (at 2001 exchange rates) in clearing programs to control the invasive species.
- The state of Louisiana has put in place a $14-billion wetland restoration plan to protect 10,000 square kilometers of marsh, swamp, and barrier islands in part to reduce storm surges generated by hurricanes.

Although degradation of ecosystem services could be significantly slowed or reversed if the full economic value of the services were taken into account in decision-making, economic considerations alone would likely lead to lower levels of biodiversity (medium certainty) (CWG). Although most or all biodiversity has some economic value (the option value of any species is always greater than zero), that does not mean that the protection of all biodiversity is always economically justified. Other utilitarian benefits often “compete” with the benefits of maintaining greater diversity. For example, many of the steps taken to increase the production of ecosystem services involve the simplification of natural systems. (Agriculture, for instance, typically has involved the replacement of relatively diverse systems with more simplified production systems.) And protecting some other ecosystem services may not necessarily require the conservation of biodiversity. (For example, a forested watershed could provide clean water whether it was covered in a diverse native forest or in a single-species plantation.) Ultimately, the level of biodiversity that survives on Earth will be determined not just by utilitarian considerations but to a significant extent by ethical concerns, including considerations of the intrinsic values of species.
Even wealthy populations cannot be fully insulated from the degradation of ecosystem services (CWG). The degradation of ecosystem services influences human well-being in industrial regions as well as wealthy populations in developing countries.
- The physical, economic, or social impacts of ecosystem service degradation may cross boundaries. (See Figure 3.5.) Land degradation and fires in poor countries, for example, have contributed to air quality degradation (dust and smoke) in wealthy ones.
- Degradation of ecosystem services exacerbates poverty in developing countries, which can affect neighboring industrial countries by slowing regional economic growth and contributing to the outbreak of conflicts or the migration of refugees.
- Changes in ecosystems that contribute to greenhouse gas emissions contribute to global climate changes that affect all countries.
- Many industries still depend directly on ecosystem services. The collapse of fisheries (Fisheries and aquaculture), for example, has harmed many communities in industrial countries. Prospects for the forest (Forestry), agriculture, fishing, and ecotourism industries are all directly tied to ecosystem services, while other sectors such as insurance, banking, and health are strongly, if less directly, influenced by changes in ecosystem services.
- Wealthy populations are insulated from the harmful effects of some aspects of ecosystem degradation, but not all. For example, substitutes are typically not available when cultural services are lost.

While traditional natural resource sectors such as agriculture, forestry, and fisheries are still important in industrial-country economies, the relative economic and political significance ofother sectors has grown as a result of the ongoing transition from agricultural to industrial and service economies (S7). Over the past two centuries, the economic structure of the world’s largest economies has shifted significantly from agricultural production to industry and, in particular, to service industries. (See Figure 3.6.) These changes increase the relative significance of the industrial and service sectors (using conventional economic measures that do not factor in non-marketed costs and benefits) in comparison to agriculture, forestry, and fisheries, although natural resource–based sectors often still dominate in developing countries. In 2000, agriculture accounted for 5% of gross world product, industry 31%, and service industries 64%. At the same time, the importance of other non-marketed ecosystem services has grown, although many of the benefits provided by these services are not captured in national economic statistics. The economic value of water from forested ecosystems near urban populations, for example, now sometimes exceeds the value of timber in those ecosystems. Economic and employment contributions from ecotourism, recreational hunting, and fishing have all grown.
Increased trade has often helped meet growing demand for ecosystem services such as grains, fish, and timber in regions where their supply is limited. While this lessens pressures on ecosystem services within the importing region, it increases pressures in the exporting region. Fish products are heavily traded, and approximately 50% of exports are from developing countries. Exports from these nations and the Southern Hemisphere presently offset much of the shortfall of supply in European, North American, and East Asian markets (C18.ES). Trade has increased the quantity and quality of fish supplied to wealthy countries, in particular the United States, those in Europe, and Japan, despite reductions in marine fish catch (C18.4.1).
The value of international trade in forest products has increased much faster than increases in harvests. (Roundwood harvests grew by 60% between 1961 and 2000, while the value of international timber trade increased twenty-five-fold (C9.ES).) The United States, Germany, Japan, United Kingdom, and Italy were the destination of more than half of the imports in 2000, while Canada, United States, Sweden, Finland, and Germany account for more than half of the exports.
Trade in commodities such as grain, fish, and timber is accompanied by a “virtual trade” in other ecosystem services that are required to support the production of these commodities. Globally, the international virtual water trade in crops has been estimated between 500 and 900 cubic kilometers per year, and 130–150 cubic kilometers per year is traded in livestock and livestock products. For comparison, current rates of water consumption for irrigation total 1,200 cubic kilometers per year (C7.3.2).

Changes in ecosystem services affect people living in urban ecosystems both directly and indirectly. Likewise, urban populations have strong impacts on ecosystem services both in the local vicinity and at considerable distances from urban centers (C27). Almost half of the world’s population now lives in urban areas, and this proportion is growing. Urban development often threatens the availability of water, air and water quality, waste processing, and many other qualities of the ambient environment that contribute to human well-being, and this degradation is particularly threatening to vulnerable groups such as poor people. A wide range of ecosystem services are still important to livelihoods. For example, agriculture practiced within urban boundaries contributes to food security in urban sub-Saharan Africa. Urban populations affect distant ecosystems through trade and consumption and are affected by changes in distant ecosystems that affect the local availability or price of commodities, air or water quality, or global climate, or that affect socioeconomic conditions in those countries in ways that influence the economy, demographic, or security situation in distant urban areas.
Spiritual and cultural values of ecosystems are as important as other services for many local communities. Human cultures, knowledge systems, religions, heritage values, and social interactions have always been influenced and shaped by the nature of the ecosystem and ecosystem conditions in which culture is based. People have benefited in many ways from cultural ecosystem services, including aesthetic enjoyment, recreation, artistic and spiritual fulfillment, and intellectual development (C17.ES). Several of the MA sub-global assessments highlighted the importance of these cultural services and spiritual benefits to local communities (SG.SDM). For example, local villages in India preserve selected sacred groves of forest for spiritual reasons, and urban parks provide important cultural and recreational services in cities around the world.
Ecosystem Services, Millennium Development Goals, and Poverty Reduction
The degradation of ecosystem services poses a significant barrier to the achievement of the Millennium Development Goals and to the MDG targets for 2015. (See Box 3.2.) Many of the regions facing the greatest challenges in achieving the MDGs overlap with the regions facing the greatest problems related to the sustainable supply of ecosystem services (R19.ES). Among other regions, this includes sub-Saharan Africa, Central Asia, and parts of South and Southeast Asia as well as some regions in Latin America. Sub-Saharan Africa has experienced increases in maternal deaths and income poverty (those living on less than $1 a day), and the number of people living in poverty there is forecast to rise from 315 million in 1999 to 404 million by 2015 (R19.1). Per capita food production has been declining in southern Africa, and relatively little gain is projected in the MA scenarios. Many of these regions include large areas of drylands, in which a combination of growing populations and land degradation are increasing the vulnerability of people to both economic and environmental change. In the past 20 years, these same regions have experienced some of the highest rates of forest and land degradation in the world.
|
|
|
The eight Millennium Development Goals were endorsed by governments at the United Nations in September 2000. The MDGs aim to improve human well-being by reducing poverty, hunger, and child and maternal mortality; ensuring education for all; controlling and managing diseases; tackling gender disparity; ensuring sustainable development; and pursuing global partnerships. For each MDG, governments have agreed to between 1 and 8 targets (a total of 15 targets) that are to be achieved by 2015. Slowing or reversing the degradation of ecosystem services will contribute significantly to the achievement of many of the MDGs.
|
Despite the progress achieved in increasing the production and use of some ecosystem services, levels of poverty remain high, inequities are growing, and many people still do not have a sufficient supply of or access to ecosystem services (C5).
- In 2001, some 1.1 billion people survived on less than $1 per day of income, most of them (roughly 70%) in rural areas where they are highly dependent on agriculture, grazing, and hunting for subsistence (R19.2.1).
- Inequality in income and other measures of human well-being has increased over the past decade (C5.ES). A child born in sub-Saharan Africa is 20 times more likely to die before age five than a child born in an industrial country, and this ratio is higher than it was a decade ago. During the 1980s, only four countries experienced declines in their rankings in the Human Development Index (an aggregate measure of economic well-being, health, and education); during the 1990s, 21 countries showed declines, and 14 of them were in sub-Saharan Africa.
- Despite the growth in per capita food production in the past four decades, an estimated 852 million people were undernourished in 2000–02, up 37 million from 1997–99. Of these, nearly 95% live in developing countries (C8.ES). South Asia and sub-Saharan Africa, the regions with the largest numbers of undernourished people, are also the regions where growth in per capita food production has lagged the most. Most notably, per capita food production has declined in sub-Saharan Africa (C28.5.1).
- Some 1.1 billion people still lack access to improved water supply and more than 2.6 billion have no access to improved sanitation. Water scarcity affects roughly 1–2 billion people worldwide. Since 1960, the ratio of water use to accessible supply has grown by 20% per decade (C7.ES, C7.2.3).
The degradation of ecosystem services is harming many of the world’s poorest people and is sometimes the principal factor causing poverty. This is not to say that ecosystem changes such as increased food production have not also helped to lift hundreds of millions of people out of poverty. But these changes have harmed many other communities, and their plight has been largely over- looked. Examples of these impacts include:
- Half of the urban population in Africa, Asia, Latin America, and the Caribbean suffers from one or more diseases associated with inadequate water and sanitation (C.SDM). Approximately 1.7 million people die annually as a result of inadequate water, sanitation, and hygiene (C7.ES).
- The declining state of capture fisheries (Fisheries and aquaculture) is reducing a cheap source of protein in developing countries. Per capita fish consumption in developing countries, excluding China, declined between 1985 and 1997 (C18.ES).
- Desertification affects the livelihoods of millions of people, including a large portion of the poor in drylands (C22).
The pattern of “winners” and “losers” associated with ecosystem changes, and in particular the impact of ecosystem changes on poor people, women, and indigenous peoples, has not been adequately taken into account in management decisions (R17). Changes in ecosystems typically yield benefits for some people and exact costs on others, who may either lose access to resources or livelihoods or be affected by externalities associated with the change. For several reasons, groups such as the poor, women, and indigenous communities have tended to be harmed by these changes.
- Many changes have been associated with the privatization of what were formerly common pool resources, and the individuals who are dependent on those resources have thus lost rights to them. This has been particularly the case for indigenous peoples, forest-dependent communities, and other groups relatively marginalized from political and economic sources of power.
- Some of the people and places affected by changes in ecosystems and ecosystem services are highly vulnerable and poorly equipped to cope with the major ecosystem changes that may occur (C6.ES). Highly vulnerable groups include those whose needs for ecosystem services already exceed the supply, such as people lacking adequate clean water supplies and people living in areas with declining per capita agricultural production. Vulnerability has also been increased by the growth of populations in ecosystems at risk of disasters such as floods or drought, often due to inappropriate policies that have encouraged this growth (Population growth rate). Populations are growing in low-lying [[coast]al areas] and dryland ecosystems. In part due to the growth in these vulnerable populations, the number of natural disasters (floods, droughts, earthquakes, and so on) requiring international assistance has quadrupled over the past four decades. Finally, vulnerability has been increased when the resilience in either the social or ecological system has been diminished, as for example through the loss of drought-resistant crop varieties.
- Significant differences between the roles and rights of men and women in many societies lead to women’s increased vulnerability to changes in ecosystem services. Rural women in developing countries are the main producers of staple crops like rice, wheat, and maize (R6 Box 6.1). Because the gendered division of labor within many societies places responsibility for routine care of the household with women, even when women also play important roles in agriculture, the degradation of ecosystem services such as water quality or quantity, fuelwood, agricultural or rangeland productivity often results in increased labor demands on women. This can affect the larger household by diverting time from food preparation, child care, education of children, and other beneficial activities (C6.3.3).Yet gender bias persists in agricultural policies in many countries, and rural women involved in agriculture tend to be the last to benefit from—or in some cases are negatively affected by— development policies and new technologies.
- The reliance of the rural poor on ecosystem services is rarely measured and thus typically overlooked in national statistics and in poverty assessments, resulting in inappropriate strategies that do not take into account the role of the environment in poverty reduction. For example, a recent study that synthesized data from 17 countries found that 22% of household income for rural communities in forested regions comes from sources typically not included in national statistics, such as harvesting wild food, fuelwood, fodder, medicinal plants, and timber. These activities generated a much higher proportion of poorer families’ total income than wealthy families’—income that was of particular significance in periods of both predictable and unpredictable shortfalls in other livelihood sources (R17).
Poor people have historically lost access to ecosystem services disproportionately as demand for those services has grown. Coastal habitats are often converted to other uses, frequently for aquaculture ponds or cage culturing of highly valued species such as shrimp and salmon. Despite the fact that the area is still used for food production, local residents are often displaced, and the food produced is usually not for local consumption but for export (C18.4.1). Many areas where overfishing is a concern are also low-income, food-deficit countries. For example, significant quantities of fish are caught by large distant water fleets in the exclusive economic zones of Mauritania, Senegal, Gambia, Guinea Bissau, and Sierra Leone. Much of the catch is exported or shipped directly to Europe, while compensation for access is often low compared with the value of the product landed overseas. These countries do not necessarily benefit through increased fish supplies or higher government revenues when foreign distant water fleets ply their waters (C18.5.1).
Diminished human well-being tends to increase immediate dependence on ecosystem services, and the resultant additional pressure can damage the capacity of those ecosystems to deliver services (SG3.ES). As human well-being declines, the options available to people that allow them to regulate their use of natural resources at sustainable levels decline as well. This in turn increases pressure on ecosystem services and can create a downward spiral of increasing poverty and further degradation of ecosystem services.

Dryland ecosystems tend to have the lowest levels of human well-being (C5.3.3). Drylands have the lowest per capita GDP and the highest infant mortality rates of all of the MA systems Nearly 500 million people live in rural areas in dry and semiarid lands, mostly in Asia and Africa but also in regions of Mexico and northern Brazil (C5 Box 5.2). The small amount of precipitation and its high variability limit the productive potential of drylands for settled farming and nomadic pastoralism, and many ways of expanding production (such as reducing fallow periods, overgrazing pasture areas, and cutting trees for fuelwood) result in environmental degradation. The combination of high variability in environmental conditions and relatively high levels of poverty leads to situations where human populations can be extremely sensitive to changes in the ecosystem (although the presence of these 1950s to the mid-1960s that had attracted people to the region, an estimated 250,000 people died, along with nearly all their cattle, sheep, and goats (C5 Box 5.1).
Although population (Population growth rate) growth has historically been higher in high-productivity ecosystems or urban areas, during the 1990s it was highest in less productive ecosystems (C5.ES, C5.3.4). In that decade dryland systems (encompassing both rural and urban regions of drylands) experienced the highest, and mountain systems the second highest, population growth rate of any of the systems examined in the MA. (See Figure 3.7.) One factor that has helped reduce relative population growth in marginal lands has been migration of some people out of marginal lands to cities or to agriculturally productive regions; today the opportunities for such migration are limited due to a combination of factors, including poor economic growth in some cities, tighter immigration restrictions in wealthy countries, and limited availability of land in more productive regions.
What are the most critical factors causing ecosystem changes?

Natural or human-induced factors that directly or indirectly cause a change in an ecosystem are referred to as “drivers.” A direct driver unequivocally influences ecosystem processes. An indirect driver operates more diffusely, by altering one or more direct drivers.
Drivers affect ecosystem services and human well-being at different spatial and temporal scales, which makes both their assessment and their management complex (SG7). Climate change may operate on a global or a large regional spatial scale; political change may operate at the scale of a nation or a municipal district. Sociocultural change typically occurs slowly, on a time scale of decades (although abrupt changes can sometimes occur, as in the case of wars or political regime changes), while economic changes tend to occur more rapidly. As a result of this spatial and temporal dependence of drivers, the forces that appear to be most significant at a particular location and time may not be the most significant over larger (or smaller) regions or time scales.
Indirect Drivers
In the aggregate and at a global scale, there are five indirect drivers of changes in ecosystems and their services: population change, change in economic activity, sociopolitical factors, cultural factors, and technological change. Collectively these factors influence the level of production and consumption of ecosystem services and the sustainability of production. Both economic growth and population (Population growth rate) growth lead to increased consumption of ecosystem services, although the harmful environmental impacts of any particular level of consumption depend on the efficiency of the technologies used in the production of the service. These factors interact in complex ways in different locations to change pressures on ecosystems and uses of ecosystem services. Driving forces are almost always multiple and interactive, so that a one-to-one linkage between particular driving forces and particular changes in ecosystems rarely exists. Even so, changes in any one of these indirect drivers generally result in changes in ecosystems. The causal linkage is almost always highly mediated by other factors, thereby complicating statements of causality or attempts to establish the proportionality of various contributors to changes. There are five major indirect drivers:
- Demographic Drivers: Global population doubled in the past 40 years and increased by 2 billion people in the last 25 years, reaching 6 billion in 2000 (S7.2.1). Developing countries have accounted for most recent population growth in the past quarter-century, but there is now an unprecedented diversity of demographic patterns across regions and countries. Some high-income countries such as the United States are still experiencing high rates of population growth, while some developing countries such as China, Thailand, and North and South Korea have very low rates. In the United States, high population growth is due primarily to high levels of immigration. About half the people in the world now live in urban areas (although urban areas cover less than 3% of the terrestrial surface), up from less than 15% at the start of the twentieth century (C27.1). High-income countries typically have populations that are 70–80% urban. Some developing-country regions, such as parts of Asia, are still largely rural, while Latin America, at 75% urban, is indistinguishable from high-income countries in this regard (S7.2.1).
- Economic Drivers: Global economic activity increased nearly sevenfold between 1950 and 2000 (S7.SDM). With rising per capita income, the demand for many ecosystem services grows. At the same time, the structure of consumption changes. In the case of food, for example, as income grows the share of additional income spent on food declines, the importance of starchy staples (such as rice, wheat, and potatoes) declines, diets include more fat, meat and fish, and fruits and vegetables, and the proportionate consumption of industrial goods and services rises (S7.2.2). In the late twentieth century, income was distributed unevenly, both within countries and around the world. The level of per capita income was highest in North America, Western Europe, Australasia, and Northeast Asia, but both GDP growth rates and per capita GDP growth rates were highest in South Asia, China, and parts of South America (S7.2.2). (See Figures 4.1 and 4.2.) Growth in international trade flows has exceeded growth in global production for many years, and the differential may be growing. In 2001, international trade in goods was equal to 40% of gross world product. (S7.2.2). Taxes and subsidies are important indirect drivers of ecosystem change. Fertilizer taxes or taxes on excess nutrients, for example, provide an incentive to increase the efficiency of the use of fertilizer applied to crops and thereby reduce negative externalities. Currently, many subsidies substantially increase rates of resource consumption and increase negative externalities. Annual subsidies to conventional energy, which encourage greater use of fossil fuels and consequently emissions of greenhouse gases, are estimated to have been $250–300 billion in the mid-1990s (S7.ES). The 2001–03 average subsidies paid to the agricultural sectors of OECD countries were over $324 billion annually (S7.ES), encouraging greater food production and associated water consumption and nutrient and pesticide release. At the same time, many developing countries also have significant agricultural production subsidies.
- Sociopolitical Drivers: Sociopolitical drivers encompass the forces influencing decision-making and include the quantity of public participation in decision-making, the groups participating in public decision-making, the mechanisms of dispute resolution, the role of the state relative to the private sector, and levels of education and knowledge (S7.2.3). These factors in turn influence the institutional arrangements for ecosystem management, as well as property rights over ecosystem services. Over the past 50 years there have been significant changes in sociopolitical drivers. There is a declining trend in centralized authoritarian governments and a rise in elected democracies. The role of women is changing in many countries, average levels of formal education are increasing, and there has been a rise in civil society (such as increased involvement of NGOs and grassroots organizations in decision-making processes). The trend toward democratic institutions has helped give power to local communities, especially women and resource-poor households (S7.2.3). There has been an increase in multilateral environmental agreements. The importance of the state relative to the private sector—as a supplier of goods and services, as a source of employment, and as a source of innovation—is declining.

- Cultural and Religious Drivers: To understand culture as a driver of ecosystem change, it is most useful to think of it as the values, beliefs, and norms that a group of people share. In this sense, culture conditions individuals’ perceptions of the world, influences what they consider important, and suggests what courses of action are appropriate and inappropriate (S7.2.4). Broad comparisons of whole cultures have not proved useful because they ignore vast variations in values, beliefs, and norms within cultures. Nevertheless, cultural differences clearly have important impacts on direct drivers. Cultural factors, for example, can influence consumption behavior (what and how much people consume) and values related to environmental stewardship, and they may be particularly important drivers of environmental change.
- Science and Technology: The development and diffusion of scientific knowledge and technologies that exploit that knowledge has profound implications for ecological systems and human well-being. The twentieth century saw tremendous advances in understanding how the world works physically, chemically, biologically, and socially and in the applications of that knowledge to human endeavors. Science and technology are estimated to have accounted for more than one third of total GDP growth in the United States from 1929 to the early 1980s, and for 16–47% of GDP growth in selected OECD countries in 1960–95 (S7.2.5). The impact of science and technology on ecosystem services is most evident in the case of food production. Much of the increase in agricultural output over the past 40 years has come from an increase in yields per hectare rather than an expansion of area under cultivation. For instance, wheat yields rose 208%, rice yields rose 109%, and maize yields rose 157% in the past 40 years in developing countries (S7.2.5). At the same time, technological advances can also lead to the degradation of ecosystem services. Advances in fishing technologies, for example, have contributed significantly to the depletion of marine fish stocks.
Consumption of ecosystem services is slowly being decoupled from economic growth. Growth in the use of ecosystem services over the past five decades was generally much less than the growth in GDP. This change reflects structural changes in economies, but it also results from new technologies and new management practices and policies that have increased the efficiency with which ecosystem services are used and provided substitutes for some services. Even with this progress, though, the absolute level of consumption of ecosystem services continues to grow, which is consistent with the pattern for the consumption of energy and materials such as metals: in the 200 years for which reliable data are available, growth of consumption of energy and materials has outpaced increases in materials and energy efficiency, leading to absolute increases of materials and energy use (S7.ES).
Global trade magnifies the effect of governance, regulations, and management practices on ecosystems and their services, enhancing good practices but worsening the damage caused by poor practices (R8, S7). Increased trade can accelerate degradation of ecosystem services in exporting countries if their policy, regulatory, and management systems are inadequate. At the same time, international trade enables comparative advantages to be exploited and accelerates the diffusion of more-efficient technologies and practices. For example, the increased demand for forest products in many countries stimulated by growth in forest products trade can lead to more rapid degradation of forests in countries with poor systems of regulation and management, but can also stimulate a “virtuous cycle” if the regulatory framework is sufficiently robust to prevent resource degradation while trade, and profits, increase. While historically most trade related to ecosystems has involved provisioning services such as food, timber, fiber, genetic resources, and biochemicals, one regulating service—climate regulation, or more specifically carbon sequestration—is now also traded internationally.
Urban demographic and economic growth has been increasing pressures on ecosystems globally, but affluent rural and sub- urban living often places even more pressure on ecosystems (C27.ES). Dense urban settlement is considered to be less environmentally burdensome than urban and suburban sprawl. And the movement of people into urban areas has significantly lessened pressure on some ecosystems and, for example, has led to the reforestation of some parts of industrial countries that had been deforested in previous centuries. At the same time, urban centers facilitate human access to and management of ecosystem services through, for example, economies of scale related to the construction of piped water systems in areas of high population density.

Direct Drivers
Most of the direct drivers of change in ecosystems and biodiversity currently remain constant or are growing in intensity in most ecosystems. (See Figure 4.3.) The most important direct drivers of change in ecosystems are habitat change (land use change and physical modification of rivers or water withdrawal from rivers), overexploitation, invasive alien species, pollution, and climate change.
For [[terrestrial] ecosystems], the most important direct drivers of change in ecosystem services in the past 50 years, in the aggregate, have been land cover change (in particular, conversion to cropland) and the application of new technologies (which have contributed significantly to the increased supply of services such as food, timber, and fiber) (CWG, S7.2.5, SG8.ES). In 9 of the 14 terrestrial biomes examined in the MA, between one half and one fifth of the area has been transformed, largely to croplands (C4.ES). Only biomes relatively unsuited to crop plants, such as deserts, boreal forests (Forest biome), and tundra (Biome), have remained largely untransformed by human action. Both land cover changes and the management practices and technologies used on lands may cause major changes in ecosystem services. New technologies have resulted in significant increases in the supply of some ecosystem services, such as through increases in agricultural yield. In the case of cereals, for example, from the mid-1980s to the late 1990s the global area under cereals fell by around 0.3% a year, while yields increased by about 1.2% a year (C26.4.1).
For marine ecosystems and their services, the most important direct driver of change in the past 50 years, in the aggregate, has been fishing (C18). At the beginning of the twenty-first century, the biological capability of commercially exploited fish stocks was probably at a historical low. FAO estimates that about half of the commercially exploited wild marine fish stocks for which information is available are fully exploited and offer no scope for increased catches, and a further quarter are over exploited. (C8.2.2). As noted in Key Question 1, fishing pressure is so strong in some marine systems that the biomass of some targeted species, especially larger fishes, and those caught incidentally has been reduced to one tenth of levels prior to the onset of industrial fishing (C18.ES). Fishing has had a particularly significant impact in [[coast]al areas] but is now also affecting the open oceans.
For freshwater ecosystems and their services, depending on the region, the most important direct drivers of change in the past 50 years include modification of water regimes, invasive species, and pollution, particularly high levels of nutrient loading. It is speculated that 50% of inland water ecosystems (excluding large lakes and closed seas) were converted during the twentieth century (C20.ES). Massive changes have been made in water regimes: in Asia, 78% of the total reservoir volume was constructed in the last decade, and in South America almost 60% of all reservoirs have been built since the 1980s (C20.4.2). The introduction of non-native invasive species is one of the major causes of species extinction in freshwater systems. While the presence of nutrients such as phosphorus and nitrogen is necessary for biological systems, high levels of nutrient loading cause significant eutrophication of water bodies and contribute to high levels of nitrate in drinking water in some locations. (The nutrient load refers to the total amount of nitrogen or phosphorus entering the water during a given time.) Non-point pollution sources such as storm water runoff in urban areas, poor or nonexistent sanitation facilities in rural areas, and the flushing of livestock manure by rainfall and snowmelt are also causes of contamination (C20.4.5). Pollution from point sources such as mining has had devastating local and regional impacts on the biota of inland waters.
Coastal ecosystems are affected by multiple direct drivers. Fishing pressures in coastal ecosystems are compounded by a wide array of other drivers, including land-, river-, and ocean- based pollution, habitat loss, invasive species, and nutrient loading. Although human activities have increased sediment flows in rivers by about 20%, reservoirs and water diversions prevent about 30% of sediments from reaching the oceans, resulting in a net reduction of 10% in the sediment delivery to estuaries, which are key nursery areas and fishing grounds (C19.ES). Approximately 17% of the world lives within the boundaries of the MA coastal system (up to an elevation of 50 meters above sea level and no further than 100 kilometers from a coast), and approximately 40% live in the full area within 50 kilometers of a coast. And the absolute number is increasing through a combination of in-migration, high reproduction rates, and tourism (C.SDM). Demand on coastal space for shipping, waste disposal, military and security uses, recreation, and aquaculture is increasing.
The greatest threat to coastal systems is the development- related conversion of coastal habitats such as forests, wetlands, and coral reefs through coastal urban sprawl, resort and port development, aquaculture, and industrialization. Dredging, reclamation and destructive fishing also account for widespread, effectively irreversible destruction. Shore protection structures and engineering works (beach armoring, causeways, bridges, and so on), by changing coastal dynamics, have impacts extending beyond their direct footprints. Nitrogen loading to the [[coast]al zone] has increased by about 80% worldwide and has driven coral reef community shifts (C.SDM).
Over the past four decades, excessive nutrient loading has emerged as one of the most important direct drivers of ecosystem change in terrestrial, freshwater (Freshwater biomes), and marine ecosystems. (See Table 4.1.) While the introduction of nutrients into ecosystems can have both beneficial effects (such as increased crop productivity) and adverse effects (such as eutrophication of inland and coastal waters), the beneficial effects will eventually reach a plateau as more nutrients are added (that is, additional inputs will not lead to further increases in crop yield), while the harmful effects will continue to grow.
Synthetic production of nitrogen fertilizer has been an important driver for the remarkable increase in food production that has occurred during the past 50 years (S7.3.2). World consumption of nitrogenous fertilizers grew nearly eightfold between 1960 and 2003, from 10.8 million tons to 85.1 million tons. As much as 50% of the nitrogen fertilizer applied may be lost to the environment, depending on how well the application is managed. Since excessive nutrient loading is largely the result of applying more nutrients than crops can use, it harms both farm incomes and the environment (S7.3.2).
Excessive flows of nitrogen contribute to eutrophication of freshwater and coastal marine ecosystems and acidification of freshwater and terrestrial ecosystems (with implications for biodiversity in these ecosystems). To some degree, nitrogen also plays a role in the creation of ground-level ozone (which leads to loss of agricultural and forest productivity), destruction of ozone in the stratosphere (which leads to depletion of the ozone layer and increased UV-B radiation on Earth, causing increased incidence of skin cancer), and climate change. The resulting health effects include the consequences of ozone pollution on asthma and respiratory function, increased allergies and asthma due to increased pollen production, the risk of blue-baby syndrome, increased risk of cancer and other chronic diseases from nitrates in drinking water, and increased risk of a variety of pulmonary and cardiac diseases from production of fine particles in the atmosphere (R9.ES).
Phosphorus application has increased threefold since 1960, with a steady increase until 1990 followed by a leveling off at a level approximately equal to applications in the 1980s. While phosphorus use has increasingly concentrated on phosphorus-deficient soils, the growing phosphorus accumulation in soils contributes to high levels of phosphorus runoff. As with nitrogen loading, the potential consequences include eutrophication of coastal and [[freshwater (Freshwater biomes)] ecosystems], which can lead to degraded habitat for fish and decreased quality of water for consumption by humans and livestock.
Many ecosystem services are reduced when inland waters and coastal ecosystems become eutrophic. Water from lakes that experience algal blooms is more expensive to purify for drinking or other industrial uses. Eutrophication can reduce or eliminate fish populations. Possibly the most apparent loss in services is the loss of many of the cultural services provided by lakes. Foul odors of rotting algae, slime-covered lakes, and toxic chemicals produced by some blue-green algae during blooms keep people from swimming, boating, and otherwise enjoying the aesthetic value of lakes (S7.3.2).

Climate change in the past century has already had a measurable impact on ecosystems. Earth’s climate system has changed since the preindustrial era, in part due to human activities, and it is projected to continue to change throughout the twenty-first century. During the last 100 years, the global mean surface temperature has increased by about 0.6o Celsius, precipitation patterns have changed spatially and temporally, and global average sea level rose by 0.1–0.2 meters (S7.ES). Observed changes in climate, especially warmer regional temperatures, have already affected biological systems in many parts of the world. There have been changes in species distributions, population (Population growth rate) sizes, and the timing of reproduction or migration events, as well as an increase in the frequency of pest and disease outbreaks, especially in [[forest]ed systems]. The growing season in Europe has lengthened over the last 30 years (R13.1.3). Although it is not possible to determine whether the extreme temperatures were a result of human-induced climate change, many coral reefs have undergone major, although often partially reversible, bleaching episodes when sea surface temperatures have increased during one month by 0.5–1o Celsius above the average of the hottest months. Extensive coral mortality has occurred with observed local increases in temperature of 3o Celsius (R13.1.3).
How might ecosystems and their services change in the future under various plausible scenarios?

The MA developed four global scenarios to explore plausible futures for ecosystems and human well-being. (See Box 5.1.) The scenarios were developed with a focus on conditions in 2050, although they include some information through the end of the century. They explored two global development paths, one in which the world becomes increasingly globalized and the other in which it becomes increasingly regionalized, as well as two different approaches to ecosystem management, one in which actions are reactive and most problems are addressed only after they become obvious and the other in which ecosystem management is proactive and policies deliberately seek to maintain ecosystem services for the long term:
- Global Orchestration: This scenario depicts a globally connected society that focuses on global trade and economic liberalization and takes a reactive approach to ecosystem problems but that also takes strong steps to reduce poverty and inequality and to invest in public goods such as infrastructure and education. Economic growth is the highest of the four scenarios, while this scenario is assumed to have the lowest population in 2050.
- Order from Strength: This scenario represents a regionalized and fragmented world that is concerned with security and protection, emphasizes primarily regional markets, pays little attention to public goods, and takes a reactive approach to ecosystem problems. Economic growth rates are the lowest of the scenarios (particularly low in developing countries) and decrease with time, while population (Population growth rate) growth is the highest.
- Adapting Mosaic: In this scenario, regional watershed-scale ecosystems are the focus of political and economic activity. Local institutions are strengthened and local ecosystem management strategies are common; societies develop a strongly proactive approach to the management of ecosystems. Economic growth rates are somewhat low initially but increase with time, and the population in 2050 is nearly as high as in Order from Strength.
- TechnoGarden: This scenario depicts a globally connected world relying strongly on environmentally sound technology, using highly managed, often engineered, ecosystems to deliver ecosystem services, and taking a proactive approach to the management of ecosystems in an effort to avoid problems. Economic growth is relatively high and accelerates, while population in 2050 is in the mid-range of the scenarios.
The scenarios are not predictions; instead, they were developed to explore the unpredictable and uncontrollable features of change in ecosystem services and a number of socioeconomic factors. No scenario represents business as usual, although all begin from current conditions and trends. The future will represent a mix of approaches and consequences described in the scenarios, as well as events and innovations that have not yet been imagined. No scenario is likely to match the future as it actually occurs. These four scenarios were not designed to explore the entire range of possible futures for ecosystem services—other scenarios could be developed with either more optimistic or more pessimistic outcomes for ecosystems, their services, and human well-being.
The scenarios were developed using both quantitative models and qualitative analysis. For some drivers (such as land use change and carbon emissions) and some ecosystem services (such as water withdrawals and food production), quantitative projections were calculated using established, peer-reviewed global models. Other drivers (such as economic growth and rates of technological change), ecosystem services (particularly supporting and cultural services such as soil formation and recreational opportunities), and human well-being indicators (such as human health and social relations) were estimated qualitatively. In general, the quantitative models used for these scenarios addressed incremental changes but failed to address thresholds, risk of extreme events, or impacts of large, extremely costly, or irreversible changes in ecosystem services. These phenomena were addressed qualitatively, by considering the risks and impacts of large but unpredictable ecosystem changes in each scenario.
|
Box 5.1. MA Scenarios |
|
Global Orchestration The Global Orchestration scenario depicts a globally connected society in which policy reforms that focus on global trade and economic liberalization are used to reshape economies and governance, emphasizing the creation of markets that allow equitable participation and provide equitable access to goods and services. These policies, in combination with large investments in global public health and the improvement of education worldwide, generally succeed in promoting economic expansion and lifting many people out of poverty into an expanding global middle class. Supranational institutions in this globalized scenario are well placed to deal with global environmental problems such as climate change and fisheries decline. However, the reactive approach to ecosystem management makes people vulnerable to surprises arising from delayed action. While the focus is on improving the well-being of all people, environmental problems that threaten human well-being are only considered after they become apparent. Growing economies, expansion of education, and growth of the middle class lead to demands for cleaner cities, less pollution, and a more beautiful environment. Rising income levels bring about changes in global consumption patterns, boosting demand for ecosystem services, including agricultural products such as meat, fish, and vegetables. Growing demand for these services leads to declines in other ones, as forests are converted into cropped area and pasture and the services they formerly provided decline. The problems related to increasing food production, such as loss of wildlands, are not apparent to most people who live in urban areas. They therefore receive only limited attention. global economyGlobal economic expansion expropriates or degrades many of the ecosystem services poor people once depended on for survival. While economic growth more than compensates for these losses in some regions by increasing the ability to find substitutes for particular ecosystem services, in many other places, it does not. An increasing number of people are affected by the loss of basic ecosystem services essential for human life. While risks seem manageable in some places, in other places there are sudden, unexpected losses as ecosystems cross thresholds and degrade irreversibly. Loss of potable water supplies, crop failures, floods, species invasions (Invasion fact sheet), and outbreaks of environmental pathogens increase in frequency. The expansion of abrupt, unpredictable changes in ecosystems, many with harmful effects on increasingly large numbers of people, is the key challenge facing managers of ecosystem services.
Order from Strength The Order from Strength scenario represents a regionalized and fragmented world that is concerned with security and protection, emphasizes primarily regional markets, and pays little attention to common goods. Nations see looking after their own interests as the best defense against economic insecurity, and the movement of goods, people, and information is strongly regulated and policed. The role of government expands as oil companies, water utilities, and other strategic businesses are either nationalized or subjected to more state oversight. Trade is restricted, large amounts of money are invested in security systems, and technological change slows due to restrictions on the flow of goods and information. Regionalization exacerbates global inequality. Treaties on global climate change, international fisheries, and trade in endangered species are only weakly and haphazardly implemented, resulting in degradation of the global commons. Local problems often go unresolved, but major problems are sometimes handled by rapid disaster relief to at least temporarily resolve the immediate crisis. Many powerful countries cope with local problems by shifting burdens to other, less powerful ones, increasing the gap between rich and poor. In particular, natural resource–intensive industries are moved from wealthier nations to poorer, less powerful ones. Inequality increases considerably within countries as well. Ecosystem services become more vulnerable, fragile, and variable in Order from Strength. For example, parks and reserves exist within fixed boundaries, but [[climate change]s] around them, leading to the unintended extirpation of many species. Conditions for crops are often suboptimal, and the ability of societies to import alternative foods is diminished by trade barriers. As a result, there are frequent shortages of food and water, particularly in poor regions. Low levels of trade tend to restrict the number of invasions by exotic species; ecosystems are less resilient, however, and invaders are therefore more often successful when they arrive.
Adapting Mosaic In the Adapting Mosaic scenario, regional watershed-scale ecosystems are the focus of political and economic activity. This scenario sees the rise of local ecosystem management strategies and the strengthening of local institutions. Investments in human and social capital are geared toward improving knowledge about ecosystem functioning and management, which results in a better understanding of resilience, fragility, and local flexibility of ecosystems. There is optimism that we can learn, but humility about preparing for surprises and about our ability to know everything about managing ecosystems. There is also great variation among nations and regions in styles of governance, including [[management] of ecosystem services]. Some regions explore actively adaptive management, investigating alternatives through experimentation. Others use bureaucratically rigid methods to optimize ecosystem performance. Great diversity exists in the outcome of these approaches: some areas thrive, while others develop severe inequality or experience ecological degradation. Initially, trade barriers for goods and products are increased, but barriers for information nearly disappear (for those who are motivated to use them) due to improving communication technologies and rapidly decreasing costs of access to information. Eventually, the focus on local governance leads to failures in managing the global commons. Problems like climate change, [[marine (Marine fisheries)] fisheries], and pollution grow worse, and global environmental problems intensify. Communities slowly realize that they cannot manage their local areas because global and regional problems are infringing on them, and they begin to develop networks among communities, regions, and even nations to better manage the global commons. Solutions that were effective locally are adopted among networks. These networks of regional successes are especially common in situations where there are mutually beneficial opportunities for coordination, such as along river valleys. Sharing good solutions and discarding poor ones eventually improves approaches to a variety of social and environmental problems, ranging from urban poverty to agricultural water pollution. As more knowledge is collected from successes and failures, provision of many services improves.
TechnoGarden The TechnoGarden scenario depicts a globally connected world relying strongly on technology and highly managed, often engineered ecosystems to deliver ecosystem services. Overall efficiency of ecosystem service provision improves, but it is shadowed by the risks inherent in large-scale human-made solutions and rigid control of ecosystems. Technology and market-oriented institutional reform are used to achieve solutions to environmental problems. These solutions are designed to benefit both the economy and the environment. These changes co-develop with the expansion of property rights to ecosystem services, such as requiring people to pay for pollution they create or paying people for providing key ecosystem services through actions such as preservation of key watersheds. Interest in maintaining, and even increasing, the economic value of these property rights, combined with an interest in learning and information, leads to a flowering of ecological engineering approaches for managing ecosystem services. Investment in green technology is accompanied by a significant focus on economic development and education, improving people’s lives and helping them understand how ecosystems make their livelihoods possible. A variety of problems in global agriculture are addressed by focusing on the multi-functional aspects of agriculture and a global reduction of agricultural subsidies (Perverse subsidies) and trade barriers. Recognition of the role of agricultural diversification encourages farms to produce a variety of ecological services rather than simply maximizing food production. The combination of these movements stimulates the growth of new markets for ecosystem services, such as tradable nutrient runoff permits, and the development of technology for increasingly sophisticated ecosystem management. Gradually, environmental entrepreneurship expands as new property rights and technologies co-evolve to stimulate the growth of companies and cooperatives providing reliable ecosystem services to cities, towns, and individual property owners. Innovative capacity expands quickly in developing nations. The reliable provision of ecosystem services as a component of economic growth, together with enhanced uptake of technology due to rising income levels, lifts many of the world’s poor into a global middle class. Elements of human well-being associated with social relations decline in this scenario due to great loss of local culture, customs, and traditional knowledge and the weakening of civil society institutions as an increasing share of interactions take place over the Internet. While the provision of basic ecosystem services improves the well-being of the world’s poor, the reliability of the services, especially in urban areas, become more critical and is increasingly difficult to ensure. Not every problem has succumbed to technological innovation. Reliance on technological solutions sometimes creates new problems and vulnerabilities. In some cases, societies seem to be barely ahead of the next threat to ecosystem services. In such cases new problems often seem to emerge from the last solution, and the costs of managing the environment are continually rising. Environmental breakdowns that affect large numbers of people become more common. Sometimes new problems seem to emerge faster than solutions. The challenge for the future is to learn how to organize socio-ecological systems so that ecosystem services are maintained without taxing society’s ability to implement solutions to novel, emergent problems. |


Projected Changes in Indirect and Direct Drivers under MA Scenarios

In the four MA scenarios, during the first half of the twenty- first century the array of both indirect and direct drivers affecting ecosystems and their services is projected to remain largely the same as over the last half-century, but the relative importance of different drivers will begin to change. Some factors (such as global population (Population growth rate) growth) will begin to decline in importance and others (distribution of people, climate change, and changes to nutrient cycles) will gain more importance. (See Tables 5.1, 5.2, and 5.3.)
Statements of certainty associated with findings related to the MA scenarios are conditional statements; they refer to level of certainty or uncertainty in the particular projection should that scenario and its associated changes in drivers unfold. They do not indicate the likelihood that any particular scenario and its associated projection will come to pass. With that caveat in mind, the four MA scenarios describe these changes between 2000 and 2050 (or in some cases 2100):
- Population is projected to grow to 8.1–9.6 billion in 2050 (medium to high certainty) and to 6.8–10.5 billion in 2100, depending on the scenario (S7.2.1). (See Figure 5.1.) The rate of global population growth has already peaked, at 2.1% per year in the late 1960s, and had fallen to 1.35% per year in 2000, when global population reached 6 billion (S7.ES). Population growth over the next several decades is expected to be concentrated in the poorest, urban communities in sub-Saharan Africa, South Asia, and the Middle East (S7.ES).
- Per capita income is projected to increase two- to fourfold, depending on the scenario (low to medium certainty) (S7.2.2). Gross world product is projected to increase roughly three to sixfold in the different scenarios. Increasing income leads to increasing per capita consumption in most parts of the world for most resources and it changes the structure of consumption. For example, diets tend to become higher in animal protein as income rises.


- Land use change (primarily the continuing expansion of agriculture) is projected to continue to be a major direct driver of change in terrestrial and [[freshwater (Freshwater biomes)] ecosystems] (medium to high certainty) (S9.ES). At the global level and across all scenarios, land use change is projected to remain the dominant driver of biodiversity change in terrestrial ecosystems, consistent with the pattern over the past 50 years, followed by changes in climate and nitrogen deposition (S10.ES). However, other direct drivers may be more important than land use change in particular biomes. For example, climate change is likely to be the dominant driver of biodiversity change in tundra (Biome) and deserts. Species invasions and water extraction are important drivers for freshwater ecosystems.
- Nutrient loading is projected to become an increasingly severe problem, particularly in developing countries. Nutrient loading already has major adverse effects on freshwater ecosystems and coastal regions in both industrial and developing countries. These impacts include toxic algae blooms, other human health problems, fish kills, and damage to habitats such as coral reefs. Three out of the four MA scenarios project that the global flux of nitrogen to coastal ecosystems will increase by 10–20% by 2030 (medium certainty) (S9.3.7.2). (See Figure 5.2.) River nitrogen will not change in most industrial countries, while a 20– 30% increase is projected for developing countries, particularly in Asia.


Climate change and its impacts (such as sea level rise) are projected to have an increasing effect on biodiversity and ecosystem services (medium certainty) (S9.ES). Under the four MA scenarios, global temperature is expected to increase significantly—1.5– 2.0o Celsius above preindustrial level in 2050 and 2.0–3.5o Celsius above it in 2100, depending on the scenario and using a median estimate for climate sensitivity (2.5oC for a doubling of the CO2 concentration) (medium certainty). The IPCC reported a range of temperature increase for the scenarios used in the Third Assessment Report of 2.0–6.4o Celsius compared with preindustrial levels, with about half of this range attributable to the differences in scenarios and the other half to differences in climate models. The smaller, somewhat lower, range of the MA scenarios is thus partly a result of using only one climate model (and one estimate of climate sensitivity) but also the result of including climate policy responses in some scenarios as well as differences in assumptions for economic and population (Population growth rate) growth. The scenarios project an increase in global average precipitation (medium certainty), but some areas will become more arid while others will become more moist. Climate change will directly alter ecosystem services, for example, by causing changes in the productivity and growing zones of cultivated and non-cultivated vegetation (Land-cover). It is also projected to change the frequency of extreme events, with associated risks to ecosystem services. Finally, it is projected to indirectly affect ecosystem services in many ways, such as by causing sea level to rise, which threatens mangroves and other vegetation that now protect shorelines.
Climate change is projected to further adversely affect key development challenges, including providing clean water, energy services, and food; maintaining a healthy environment; and conserving ecological systems, their biodiversity, and their associated ecological goods and services (R13.1.3).
- Climate change is projected to exacerbate the loss of biodiversity and increase the risk of extinction for many species, especially those already at risk due to factors such as low population numbers, restricted or patchy habitats, and limited climatic ranges (medium to high certainty).
- Water availability and quality are projected to decrease in many arid and semiarid regions (high certainty).
- The risk of floods and droughts is projected to increase (high certainty).
- Sea level is projected to rise by 8–88 centimeters.
- The reliability of hydropower and biomass production is projected to decrease in some regions (high certainty).
- The incidence of vector-borne diseases such as malaria and dengue and of waterborne diseases such as cholera is projected to increase in many regions (medium to high certainty), and so too are heat stress mortality and threats of decreased nutrition in other regions, along with severe weather traumatic injury and death (high certainty).
- Agricultural productivity is projected to decrease in the tropics and sub-tropics for almost any amount of warming (low to medium certainty), and there are projected adverse effects on fisheries (Fisheries and aquaculture).
- Projected changes in climate during the twenty-first century are very likely to be without precedent during at least the past 10,000 years and, combined with land use change and the spread of exotic or alien species, are likely to limit both the capability of species to migrate and the ability of species to persist in fragmented habitats.
Changes in Ecosystems
Rapid conversion of ecosystems is projected to continue under all MA scenarios in the first half of the twenty-first century. Roughly 10–20% (low to medium certainty) of current grassland and forestland is projected to be converted to other uses between now and 2050, mainly due to the expansion of agriculture and, secondarily, because of the expansion of cities and infrastructure (S9.ES). The biomes projected to lose habitat and local species at the fastest rate in the next 50 years are warm mixed forests, savannas, scrub, tropical forests, and tropical woodlands (S10.ES). Rates of conversion of ecosystems are highly dependent on future development scenarios and in particular on changes in population (Population growth rate), wealth, trade, and technology.
Habitat loss in [[terrestrial] environments] is projected to accelerate decline in local diversity of native species in all four scenarios by 2050 (high certainty) (S.SDM). Loss of habitat results in the immediate extirpation of local populations and the loss of the services that these populations provided.

The habitat losses projected in the MA scenarios will lead to global extinctions as numbers of species approach equilibrium with the remnant habitat (high certainty) (S.SDM, S10.ES). The equilibrium number of plant species is projected to be reduced by roughly 10–15% as a result of habitat loss from 1970 to 2050 in the MA scenarios (low certainty). Other terrestrial taxonomic groups are likely to be affected to a similar extent. The pattern of extinction through time cannot be estimated with any precision, because some species will be lost immediately when their habitat is modified but others may persist for decades or centuries. Time lags between habitat reduction and extinction provide an opportunity for humans to deploy restoration practices that may rescue those species that otherwise may be in a trajectory toward extinction. Significant declines in freshwater fish species diversity are also projected due to the combined effects of climate change, water withdrawals, eutrophication, acidification, and increased invasions by non-indigenous species (low certainty). Rivers that are expected to lose fish species are concentrated in poor tropical and sub-tropical countries.
Changes in Ecosystem Services and Human Well-being
In three of the four MA scenarios, ecosystem services show net improvements in at least one of the three categories of provisioning, regulating, and cultural services (S.SDM). These three categories of ecosystem services are all in worse condition in 2050 than they are today in only one MA scenario—Order from Strength. (See Figure 5.3.) However, even in scenarios showing improvement in one or more categories of ecosystem services, biodiversity loss continues at high rates.
The following changes to ecosystem services and human well- being were common to all four MA scenarios and thus may be likely under a wide range of plausible futures (S.SDM):
- Human use of ecosystem services increases substantially under all MA scenarios during the next 50 years. In many cases this is accompanied by degradation in the quality of the service and sometimes, in cases where the service is being used unsustainably, a reduction in the quantity of the service available. (See Appendix A.) The combination of growing populations and growing per capita consumption increases the demand for ecosystem services, including water and food. For example, demand for food crops (measured in tons) is projected to grow by 70–85% by 2050 (S9.4.1) and global water withdrawals increase by 20–85% across the MA scenarios (S9 Fig 9.35). Water withdrawals are projected to increase significantly in developing countries but to decline in OECD countries (medium certainty) (S.SDM). In some cases, this growth in demand will be met by unsustainable uses of the services, such as through continued depletion of [[marine (Marine fisheries)] fisheries]. Demand is dampened somewhat by increasing efficiency in use of resources. The quantity and quality of ecosystem services will change dramatically in the next 50 years as productivity of some services is increased to meet demand, as humans use a greater fraction of some services, and as some services are diminished or degraded. Ecosystem services that are projected to be further impaired by ecosystem change include fisheries (Fisheries and aquaculture), food production in drylands, quality of fresh waters, and cultural services.
- Food security is likely to remain out of reach for many people. Child malnutrition will be difficult to eradicate even by 2050 (low to medium certainty) and is projected to increase in some regions in some MA scenarios, despite increasing food supply under all four scenarios (medium to high certainty) and more diversified diets in poor countries (low to medium certainty) (S.SDM). Three of the MA scenarios project reductions in child undernourishment by 2050 of between 10% and 60%, but undernourishment increases by 10% in Order from Strength (low certainty) (S9.4.1). (See Figure 5.4.) This is due to a combination of factors related to food supply systems (inadequate investments in food production and its supporting infrastructure resulting in low productivity increases, varying trade regimes) and food demand and accessibility (continuing poverty in combination with high [[population (Population growth rate) growth] rates], lack of food infrastructure investments).
- Vast, complex changes with great geographic variability are projected to occur in world freshwater resources and hence in their provisioning of ecosystem services in all scenarios (S.SDM). Climate change will lead to increased precipitation over more than half of Earth’s surface, and this will make more water available to society and ecosystems (medium certainty). However, increased precipitation is also likely to increase the frequency of flooding in many areas (high certainty). Increases in precipitation will not be universal, and climate change will also cause a substantial decrease in precipitation in some areas, with an accompanying decrease in water availability (medium certainty). These areas could include highly populated arid regions such as the Middle East and Southern Europe (low to medium certainty). While water withdrawals decrease in most industrial countries, they are expected to increase substantially in Africa and some other developing regions, along with wastewater discharges, overshadowing the possible benefits of increased water availability (medium certainty).
- A deterioration of the services provided by freshwater resources (such as aquatic habitat, fish production, and water supply for households, industry, and agriculture) is expected in developing countries under the scenarios that are reactive to environmental problems (S9.ES). Less severe but still important declines are expected in the scenarios that are more proactive about environmental problems (medium certainty).
- Growing demand for fish and fish products leads to an increasing risk of a major and long-lasting collapse of regional [[marine (Marine fisheries)] fisheries] (low to medium certainty) (S.SDM). Aquaculture may relieve some of this pressure by providing for an increasing fraction of fish demand. However, this would require aquaculture to reduce its current reliance on marine fish as a feed source.
The future contribution of [[terrestrial] ecosystems] to the regulation of climate is uncertain (S9.ES). Carbon release or uptake by ecosystems affects the CO2 and CH4 content of the atmosphere at the global scale and thereby affects global climate. Currently, the biosphere is a net sink of carbon, absorbing about 1–2 gigatons a year, or approximately 20% of fossil fuel emissions. It is very likely that the future of this service will be greatly affected by expected land use change. In addition, a higher atmospheric CO2 concentration is expected to enhance net productivity, but this does not necessarily lead to an increase in the carbon sink. The limited understanding of soil respiration processes generates uncertainty about the future of the carbon sink. There is medium certainty that climate change will increase terrestrial fluxes of CO2 and CH4 in some regions (such as in Arctic tundra).

Dryland ecosystems are particularly vulnerable to changes over the next 50 years. The combination of low current levels of human well-being (high rates of poverty, low per capita GDP, high infant mortality rates), a large and growing population, high variability of environmental conditions in dryland regions, and high sensitivity of people to changes in ecosystem services means that continuing land degradation could have profoundly negative impacts on the well-being of a large number of people in these regions (S.SDM). Subsidies of food and water to people in vulnerable drylands can have the unintended effect of increasing the risk of even larger breakdowns of ecosystem services in future years. Local adaptation and conservation practices can mitigate some losses of dryland ecosystem services, although it will be difficult to reverse trends toward loss of food production capacity, water supplies, andbiodiversity in drylands.
While human health improves under most MA scenarios, under one plausible future health and social conditions in the North and South could diverge (S11). In the more promising scenarios related to health, the number of undernourished children is reduced, the burden of epidemic diseases such as HIV/ AIDS, malaria, and tuberculosis would be lowered, improved vaccine development and distribution could allow populations to cope comparatively well with the next influenza pandemic, and the impact of other new diseases such as SARS would also be limited by well-coordinated public health measures.
Under the Order from Strength scenario, however, it is plausible that the health and social conditions for the North and South could diverge as inequality increases and as commerce and scientific exchanges between industrial and developing countries decrease. In this case, health in developing countries could become worse, causing a negative spiral of poverty, declining health, and degraded ecosystems. The increased population in the South, combined with static or deteriorating nutrition, could force increased contact between humans and nonagricultural ecosystems, especially to obtain bushmeat and other forest goods. This could lead to more outbreaks of hemorrhagic fever and zoo-noses. It is possible, though with low probability, that a more chronic disease could cross from a non-domesticated animal species into humans, at first slowly but then more rapidly colonizing human populations.

Each scenario yields a different package of gains, losses, and vulnerabilities to components of human well-being in different regions and [[population]s] (S.SDM). Actions that focus on improving the lives of the poor by reducing barriers to international flows of goods, services, and capital tend to lead to the most improvement in health and social relations for the currently most disadvantaged people. But human vulnerability to ecological surprises is high. Globally integrated approaches that focus on technology and property rights for ecosystem services generally improve human well-being in terms of health, security, social relations, and material needs. If the same technologies are used globally, however, local culture can be lost or undervalued. High levels of trade lead to more rapid spread of emergent diseases, somewhat reducing the gains in health in all areas. Locally focused, learning-based approaches lead to the largest improvements in social relations.
Order from Strength, which focuses on reactive policies in a regionalized world, has the least favorable outcomes for human well-being, as the global distribution of ecosystem services and human resources that underpin human well-being are increasingly skewed. (See Figure 5.5.) Wealthy populations generally meet most material needs but experience psychological unease. Anxiety, depression, obesity, and diabetes have a greater impact on otherwise privileged populations in this scenario. Disease creates a heavy burden for disadvantaged populations.
Proactive or anticipatory management of ecosystems is generally advantageous in the MA scenarios, but it is particularly beneficial under conditions of changing or novel conditions (S.SDM). (See Table 5.4.) Ecological surprises are inevitable because of the complexity of the interactions and because of limitations in current understanding of the dynamic properties of ecosystems. Currently well understood phenomena that were surprises of the past century include the ability of pests to evolve resistance to biocides, the contribution to desertification of certain types of land use, biomagnification of toxins, and the increase in vulnerability of ecosystem to eutrophication and unwanted species due to removal of predators. While we do not know which surprises lie ahead in the next 50 years, we can be certain that there will be some.
In general, proactive action to manage systems sustainably and to build resilience into systems will be advantageous, particularly when conditions are changing rapidly, when surprise events are likely, or when uncertainty is high. This approach is beneficial largely because the restoration of ecosystems or ecosystem services following their degradation or collapse is generally more costly and time-consuming than preventing degradation, if that is possible at all. Nevertheless, there are costs and benefits to both proactive and reactive approaches, as Table 5.4 indicated.

What can be learned about the consequences of ecosystem change for human well-being at sub-global scales?

The MA included a sub-global assessment component to assess differences in the importance of ecosystem services for human well-being around the world (SG.SDM). The Sub-global Working Group included 33 assessments around the world. (See Figure 6.1.) These were designed to consider the importance of ecosystem services for human well-being at local, national, and regional scales. The areas covered in these assessments range from small villages in India and cities like Stockholm and São Paulo to whole countries like Portugal and large regions like southern Africa. In a few cases, the sub-global assessments were designed to cover multiple nested scales. For example, the Southern Africa study included assessments of the entire region of Africa south of the equator, of the Gariep and Zambezi river basins in that region, and of local communities within those basins. This nested design was included as part of the overall design of the MA to analyze the importance of scale on ecosystem services and human well-being and to study cross-scale interactions. Most assessments, however, were conducted with a focus on the needs of users at a single spatial scale—a particular community, watershed, or region.
The scale at which an assessment is undertaken significantly influences the problem definition and the assessment results (SG.SDM). Findings of assessments done at different scales varied due to the specific questions posed or the information analyzed. Local communities are influenced by global, regional, and local factors. Global factors include commodity prices (global trade asymmetries that influence local production patterns, for instance) and global climate change (such as sea level rise). Regional factors include water supply regimes (safe piped water in rural areas), regional climate (desertification), and geomorphological processes (soil erosion and degradation). Local factors include market access (distance to market), disease prevalence (malaria, for example), or localized climate variability (patchy thunderstorms). Assessments conducted at different scales tended to focus on drivers and impacts most relevant at each scale, yielding different but complementary findings. This provides some of the benefit of a multi-scale assessment process, since each component assessment provides a different perspective on the issues addressed.
Although there is overall congruence in the results from global and sub-global assessments for services like water and biodiversity, there are examples where local assessments showed the condition was either better or worse than expected from the global assessment (SG.SDM). For example, the condition of water resources was significantly worse than expected in places like São Paulo and the Laguna Lake Basin in the Philippines. There were more mismatches for biodiversity than for water provisioning because the concepts and measures of biodiversity were more diverse in the sub-global assessments.
Drivers of change act in very distinct ways in different regions (SG7.ES). Though similar drivers might be present in various assessments, their interactions—and thus the processes leading to ecosystem change—differed significantly from one assessment to another. For example, although the Amazon, Central Africa, and Southeast Asia in the Tropical Forest Margins assessment have the same set of individual drivers of land use change (deforestation, road construction, and pasture creation), the interactions among these drivers leading to change differ. Deforestation driven by swidden agriculture is more widespread in upland and foothill zones of Southeast Asia than in other regions. Road construction by the state followed by colonizing migrant settlers, who in turn practice slash-and-burn agriculture, is most frequent in lowland areas of Latin America, especially in the Amazon Basin. Pasture creation for cattle ranching is causing deforestation almost exclusively in the humid lowland regions of mainland South America. The spontaneous expansion of small-holder agriculture and fuelwood extraction for domestic uses are important causes of deforestation in Africa.

The assessments identified inequities in the distribution of the costs and benefits of ecosystem change, which are often displaced to other places or future generations (SG.SDM). For example, the increase in urbanization in countries like Portugal is generating pressures on ecosystems and services in rural areas. The increase in international trade is also generating additional pressures around the world, illustrated by the cases of the mining industries in Chile and Papua New Guinea. In some situations, the costs of transforming ecosystems are simply deferred to future generations. An example reported widely across sub-global assessments in different parts of the world is tropical deforestation, which caters to current needs but leads to a reduced capacity to supply services in the future.
Declining ecosystem trends have sometimes been mitigated by innovative local responses. The “threats” observed at an aggregated, global level may be both overestimated and underestimated from a sub-global perspective (SG.SDM). Assessments at an aggregated level often fail to take into account the adaptive capacity of sub-global actors. Through collaboration in social networks, actors can develop new institutions and reorganize to mitigate declining conditions. On the other hand, sub- global actors tend to neglect drivers that are beyond their reach of immediate influence when they craft responses. Hence, it is crucial for decision-makers to develop institutions at the global, regional, and national levels that strengthen the adaptive capacity of actors at the sub-national and local levels to develop context-specific responses that do address the full range of relevant drivers. The Biodiversity Management Committees in India are a good example of a national institution that enables local actors to respond to biodiversity loss. This means neither centralization nor decentralization but institutions at multiple levels that enhance the adaptive capacity and effectiveness of sub-national and local responses.
Multi-scale assessments offer insights and results that would otherwise be missed (SG.SDM). The variability among sub- global assessments in problem definition, objectives, scale criteria, and systems of explanation increased at finer scales of assessment (for example, social equity issues became more visible from coarser to finer scales of assessment). The role of biodiversity as a risk avoidance mechanism for local communities is frequently hidden until local assessments are conducted (as in the Indian local, Sinai, and Southern African livelihoods studies).

Failure to acknowledge that stakeholders at different scales perceive different values in various ecosystem services can lead to unworkable and inequitable policies or programs at all scales (SGWG). Ecosystem services that are of considerable importance at global scales, such as carbon sequestration or waste regulation, are not necessarily seen to be of value locally. Similarly, services of local importance, such as the cultural benefits of ecosystems, the availability of manure for fuel and fertilizer, or the presence of non-wood forest products, are often not seen as important globally. Responses designed to achieve goals related to global or regional concerns are likely to fail unless they take into account the different values and concerns motivating local communities.
There is evidence that including multiple knowledge systems increases the relevance, credibility, and legitimacy of the assessment results for some users (SG.SDM). For example, in Bajo Chirripó in Costa Rica, the involvement of non-scientists added legitimacy and relevance to assessment results for a number of potential users at the local level. In many of the sub-global assessments, however, local resource users were one among many groups of decision-makers, so the question of legitimacy needs to be taken together with that of empowerment.
Integrated assessments of ecosystems and human well-being need to be adapted to the specific needs and characteristics of the groups undertaking the assessment (SG.SDM, SG11.ES). Assessments are most useful to decision-makers if they respond to the needs of those individuals. As a result, the MA sub-global assessments differed significantly in the issues they addressed. At the same time, given the diversity of assessments involved in the MA, the basic approach had to be adapted by different assessments to ensure its relevance to different user groups. (See Box 6.1.) Several community-based assessments adapted the MA framework to allow for more dynamic interplays between variables, to capture fine-grained patterns and processes in complex systems, and to leave room for a more spiritual world-view. In Peru and Costa Rica, for example, other conceptual frameworks were used that incorporated both the MA principles and local cosmologies. In southern Africa, various frameworks were used in parallel to offset the shortcomings of the MA framework for community assessments. These modifications and adaptations of the framework are an important outcome of the MA.
|
|
|
The MA framework was applied in a wide range of assessments at multiple scales. Particularly for the more local assessments, the framework needed to be adapted to better reflect the needs and concerns of local communities. In the case of an assessment conducted by and for indigenous communities in the Vilcanota region of Peru, the framework had to be recreated from a base with the Quechua understanding of ecological and social relationships. (See Figure.) Within the Quechua vision of the cosmos, concepts such as reciprocity (Ayni), the inseparability of space and time, and the cyclical nature of all processes (Pachakuti) are important components of the Inca definition of ecosystems. Love (Munay) and working (Llankay) bring humans to a higher state of knowledge (Yachay) about their surroundings and are therefore key concepts linking Quechua communities to the natural world. Ayllu represents the governing institutions that regulate interactions between all living beings. The resulting framework has similarities with the MA Conceptual Framework, but the divergent features are considered to be important to the Quechua people conducting the assessment. The Vilcanota conceptual framework also includes multiple scales (Kaypacha, Hananpacha, Ukupacha); however, these represent both spatial scales and the cyclical relationship between the past, present, and future. Inherent in this concept of space and time is the adaptive capacity of the Quechua people, who welcome change and have become resilient to it through an adaptive learning process. (It is recognized that current rates of change may prove challenging to the adaptive capacities of the communities.) The cross shape of the Vilcanota framework diagram represents the “Chakana,” the most recognized and sacred shape to Quechua people, and orders the world through deliberative and collective decision-making that emphasizes reciprocity (Ayni). Pachamama is similar to a combination of the “ecosystem goods and services” and “human well-being” components of the MA framework. Pachakuti is similar to the MA “drivers” (both direct and indirect). Ayllu (and Munay, Yachay, and Llankay) may be seen as responses and are more organically integrated into the cyclic process of change and adaptation. In the Vilcanota assessment, the Quechua communities directed their work process to assess the conditions and trends of certain aspects of the Pachamama (focusing on water, soil, and agrobiodiversity), how these goods and services are changing, the reasons behind the changes, the effects on the other elements of the Pachamama, how the communities have adapted and are adapting to the changes, and the state of resilience of the Quechua principles and institutions for dealing with these changes in the future. Developing the local conceptual framework from a base of local concepts and principles, as opposed to simply translating the MA framework into local terms, has allowed local communities to take ownership of their assessment process and given them the power both to assess the local environment and human [[population]s] using their own knowledge and principles of well-being and to seek responses to problems within their own cultural and spiritual institutions. |

What is known about time scales, inertia, and the risk of nonlinear changes in ecosystems?
The time scale of change refers to the time required for the effects of a perturbation of a process to be expressed. Time scales relevant to ecosystems and their services are shown in Figure 7.1. Inertia refers to the delay or slowness in the response of a system to factors altering their rate of change, including continuation of change in the system after the cause of that change has been removed. Resilience refers to the amount of disturbance or stress that a system can absorb and still remain capable of returning to its pre-disturbance state.

Time Scales and Inertia
Many impacts of humans on ecosystems (both harmful and beneficial) are slow to become apparent; this can result in the costs associated with ecosystem changes being deferred to future generations. For example, excessive phosphorus is accumulating in many agricultural soils, threatening rivers, lakes, and coastal oceans with increased eutrophication. Yet it may take years or decades for the full impact of the phosphorus to become apparent through erosion and other processes (S7.3.2). Similarly, the use of groundwater supplies can exceed the recharge rate for some time before costs of extraction begin to grow significantly. In general, people manage ecosystems in a manner that increases short-term benefits; they may not be aware of, or may ignore, costs that are not readily and immediately apparent. This has the inequitable result of increasing current benefits at costs to future generations.
Different categories of ecosystem services tend to change over different time scales, making it difficult for managers to evaluate trade-offs fully. For example, supporting services such as soil formation and primary production and regulating services such as water and disease regulation tend to change over much longer time scales than provisioning services. As a consequence, impacts on more slowly changing supporting and regulating services are often overlooked by managers in pursuit of increased use of provisioning services (S12.ES).
The inertia of various direct and indirect drivers differs considerably, and this strongly influences the time frame for solving ecosystem-related problems once they are identified (RWG, S7). For some drivers, such as the over-harvest of particular species, lag times are rather short, and the impact of the driver can be minimized or halted within short time frames. For others, such as nutrient loading and, especially, climate change, lag times are much longer, and the impact of the driver cannot be lessened for years or decades.
Significant inertia exists in the process of species extinctions that result from habitat loss; even if habitat loss were to end today, it would take hundreds of years for species numbers to reach a new and lower equilibrium due to the habitat changes that have taken place in the last centuries (S10). Most species that will go extinct in the next several centuries will be driven to extinction as a result of loss or degradation of their habitat (either through [[land cover change]s] or increasingly through climate changes). Habitat loss can lead to rapid extinction of some species (such as those with extremely limited ranges); but for many species, extinction will only occur after many generations, and long-lived species such as some trees could persist for centuries before ultimately going extinct. This “extinction debt” has important implications. First, while reductions in the rate of habitat loss will protect certain species and have significant long-term benefits for species survival in the aggregate, the impact on rates of extinction over the next 10–50 years is likely to be small (medium certainty). Second, until a species does go extinct, opportunities exist for it to be recovered to a viable population size.
Nonlinear Changes in Ecosystems
Nonlinear changes, including accelerating, abrupt, and potentially irreversible changes, have been commonly encountered in ecosystems and their services. Most of the time, change in ecosystems and their services is gradual and incremental. Most of these gradual changes are detectable and predictable, at least in principle (high certainty) (S.SDM). However, many examples exist of nonlinear and sometimes abrupt changes in ecosystems. In these cases, the ecosystem may change gradually until a particular pressure on it reaches a threshold, at which point changes occur relatively rapidly as the system shifts to a new state. Some of these nonlinear changes can be very large in magnitude and have substantial impacts on human well-being. Capabilities for predicting some nonlinear changes are improving, but for most ecosystems and for most potential nonlinear changes, while science can often warn of increased risks of change, it cannot predict the thresholds where the change will be encountered (C6.2, S13.4). Numerous examples exist of nonlinear and relatively abrupt changes in ecosystems:
- Disease emergence (S13.4): Infectious diseases regularly exhibit nonlinear behavior. If, on average, each infected person infects at least one other person, then an epidemic spreads, while if the infection is transferred on average to less than one person the epidemic dies out. High human population densities in close contact with animal reservoirs of infectious disease facilitate rapid exchange of pathogens, and if the threshold rate of infection is achieved—that is, if each infected person on average transmits the infection to at least one other person—the resulting infectious agents can spread quickly through a worldwide contiguous, highly mobile, human population with few barriers to transmission. The almost instantaneous outbreak of SARS in different parts of the world is an example of such potential, although rapid and effective action contained its spread. During the 1997/98 El Niño, excessive flooding caused cholera epidemics in Djibouti, Somalia, Kenya, Tanzania, and Mozambique. Warming of the African Great Lakes due to climate change may create conditions that increase the risk of cholera transmission in surrounding countries (C14.2.1). An event similar to the 1918 Spanish flu pandemic, which is thought to have killed 20–40 million people worldwide, could now result in over 100 million deaths within a single year. Such a catastrophic event, the possibility of which is being seriously considered by the epidemiological community, would probably lead to severe economic disruption and possibly even rapid collapse in a world economy dependent on fast global exchange of goods and services.
- Algal blooms and fish kills (S13.4): Excessive nutrient loading fertilizes freshwater and coastal ecosystems. While small increases in nutrient loading often cause little change in many ecosystems, once a threshold of nutrient loading is achieved, the changes can be abrupt and extensive, creating harmful algal blooms (including blooms of toxic species) and often leading to the domination of the ecosystem by one or a few species. Severe nutrient overloading can lead to the formation of oxygen-depleted zones, killing all animal life.
- Fisheries (Fisheries and aquaculture) collapses (C18): Fish population collapses have been commonly encountered in both freshwater and [[marine (Marine fisheries)] fisheries]. Fish populations are generally able to withstand some level of catch with a relatively small impact on their overall population size. As the catch increases, however, a threshold is reached after which too few adults remain to produce enough offspring to support that level of harvest, and the population may drop abruptly to a much smaller size. For example, the Atlantic cod stocks of the east coast of Newfoundland collapsed in 1992, forcing the closure of the fishery after hundreds of years of exploitation, as shown in Figure 3.4 (CF2 Box 2.4). Most important, the stocks may take years to recover or not recover at all, even if harvesting is significantly reduced or eliminated entirely.
- Species introductions and losses: Introductions (or removal) of species can cause nonlinear changes in ecosystems and their services. For example, the introduction of the zebra mussel (see photo above) into U.S. aquatic systems resulted in the extirpation of native clams in Lake St. Clair, large changes in energy flow and ecosystem function, and annual costs of $100 million to the power industry and other users (S12.4.8). The introduction of the comb jelly fish (Mnemiopsis leidyi) in the Black Sea caused the loss of 26 major fisheries (Fisheries and aquaculture) species and has been implicated (along with other factors) in subsequent growth of the anoxic “dead zone” (C28.5). The loss of the sea otters from many coastal ecosystems on the Pacific Coast of North America due to hunting led to the booming populations of sea urchins (a prey species for otters) which in turn led to the loss of kelp forests (which are eaten by urchins).
- Changes in dominant species in coral ecosystems: Some coral reef ecosystems have undergone sudden shifts from coral-dominated to algae-dominated reefs. The trigger for such phase shifts, which are essentially irreversible, is usually multifaceted and includes increased nutrient input leading to eutrophic conditions, and removal of herbivorous fishes that maintain the balance between corals and algae. Once a threshold is reached, the change in the ecosystem takes place within months and the resulting ecosystem, although stable, is less productive and less diverse. One well-studied example is the sudden switch in 1983 from coral to algal domination of Jamaican reef systems. This followed several centuries of overfishing of herbivores, which left the control of algal cover almost entirely dependent on a single species of sea urchin, whose [[population]s] collapsed when exposed to a species-specific pathogen. As a result, Jamaica’s reefs shifted (apparently irreversibly) to a new low-diversity, algae-dominated state with very limited capacity to support fisheries (C4.6).
- Regional climate change (C13.3): The vegetation in a region influences climate through albedo (reflectance of radiation from the surface), transpiration (flux of water from the ground to the atmosphere through plants), and the aerodynamic properties of the surface. In the Sahel region of North Africa, [[vegetation (Land-cover)] cover] is almost completely controlled by rainfall. When vegetation is present, rainfall is quickly recycled, generally increasing precipitation and, in turn, leading to a denser vegetation canopy. Model results suggest that land degradation leads to a substantial reduction in water recycling and may have contributed to the observed trend in rainfall reduction in the region over the last 30 years. In tropical regions, deforestation generally leads to decreased rainfall. Since forest existence crucially depends on rainfall, the relationship between tropical forests and precipitation forms a positive feedback that, under certain conditions, theoretically leads to the existence of two steady states: rainforest and savanna (although some models suggest only one stable climate-vegetation state in the Amazon).


There is established but incomplete evidence that changes being made in ecosystems are increasing the likelihood of non- linear and potentially high-impact, abrupt changes in physical and biological systems that have important consequences for human well-being (C6, S3, S13.4, S.SDM). The increased likelihood of these events stems from the following factors:
- On balance, changes humans are making to ecosystems are reducing the resilience of the ecological components of the systems (established but incomplete) (C6, S3, S12). Genetic and species diversity, as well as spatial patterns of landscapes, environmental fluctuations, and temporal cycles with which species evolved, generate the resilience of ecosystems. Functional groups of species contribute to ecosystem processes and services in similar ways. Diversity among functional groups increases the flux of ecosystem processes and services (established but incomplete). Within functional groups, species respond differently to environmental fluctuations. This response diversity derives from variation in the response of species to environmental drivers, heterogeneity in species distributions, differences in ways that species use seasonal cycles or disturbance patterns, or other mechanisms. Response diversity enables ecosystems to adjust in changing environments, altering biotic structure in ways that maintain processes and services (high certainty) (S.SDM). The loss of biodiversity that is now taking place thus tends to reduce the resilience of ecosystems.
- There are growing pressures from various drivers (S7, SG7.5). Threshold changes in ecosystems are not uncommon, but they are infrequently encountered in the absence of human-caused pressures on ecosystems. Many of these pressures are now growing. Increased fish harvests raise the likelihood of fisheries (Fisheries and aquaculture) collapses; higher rates of climate change boost the potential for species extinctions; increased introductions of nitrogen and phosphorus into the environment make the eutrophication of aquatic ecosystems more likely; as human populations become more mobile, more and more species are being introduced into new habitats, and this increases the chance of harmful pests emerging in those regions.
The growing bushmeat trade poses particularly significant threats associated with nonlinear changes, in this case accelerating rates of change (C8.3, S.SDM, C14). Growth in the use and trade of bushmeat is placing increasing pressure on many species, particularly in Africa and Asia. While [[population (Population growth rate)] size] of harvested species may decline gradually with increasing harvest for some time, once the harvest exceeds sustainable levels, the rate of decline of populations of the harvested species will tend to accelerate. This could place them at risk of extinction and also reduce the food supply of the people dependent on these resources. Finally, the bushmeat trade involves relatively high levels of interaction between humans and some relatively closely related wild animals that are eaten. Again, this increases the risk of a nonlinear change, in this case the emergence of new and serious pathogens. Given the speed and magnitude of international travel today, new pathogens could spread rapidly around the world.
A potential nonlinear response, currently the subject of intensive scientific research, is the atmospheric capacity to cleanse itself of air pollution (in particular, hydrocarbons and reactive nitrogen compounds) (C.SDM). This capacity depends on chemical reactions involving the hydroxyl radical, the atmospheric concentration of which has declined by about 10% (medium certainty) since preindustrial times.
Once an ecosystem has undergone a nonlinear change, recovery to the original state may take decades or centuries and may sometimes be impossible. For example, the recovery of overexploited fisheries (Fisheries and aquaculture) that have been closed to fishing is quite variable. Although the cod fishery in Newfoundland has been closed for 13 years (except for a small inshore fishery between 1998 and 2003), there have been few signs of a recovery, and many scientists are not optimistic about its return in the foreseeable future (C18.2.6). On the other hand, the North Sea Herring fishery collapsed due to over-harvesting in the late 1970s, but it recovered after being closed for four years (C18).
What options exist to manage ecosystems sustainably?
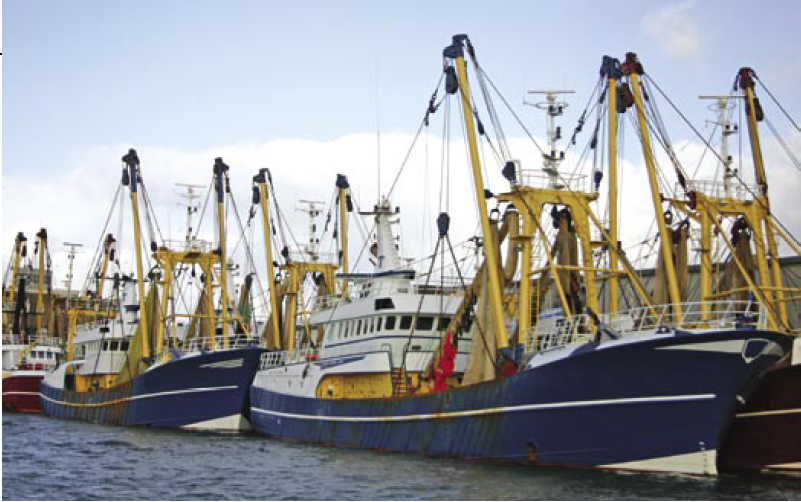
It is a major challenge to reverse the degradation of ecosystems while meeting increasing demands for their services. But this challenge can be met. Three of the four MA scenarios show that changes in policies, institutions, and practices can mitigate some of the negative consequences of growing pressures on ecosystems, although the changes required are large and not currently under way (S.SDM). As noted in Key Question 5, in three of the four MA scenarios at least one of the three categories of provisioning, regulating, and cultural services is in better condition in 2050 than in 2000, although biodiversity loss continues at high rates in all scenarios. The scale of interventions that results in these positive outcomes, however, is very significant. The interventions include major investments in environmentally sound technology, active adaptive management, proactive actions to address environmental problems before their full consequences are experienced, major investments in public goods (such as education and health), strong action to reduce socioeconomic disparities and eliminate poverty, and expanded capacity of people to manage ecosystems adaptively.
More specifically, in Global Orchestration trade barriers are eliminated, distorting subsidies are removed, and a major emphasis is placed on eliminating poverty and hunger. In Adapting Mosaic, by 2010 most countries are spending close to 13% of their GDP on education (compared with an average of 3.5% in 2000), and institutional arrangements to promote transfer of skills and knowledge among regional groups proliferate. In TechnoGarden, policies are put in place to provide payment to individuals and companies that provide or maintain the provision of ecosystem services. For example, in this scenario, by 2015 roughly 50% of European agriculture and 10% of North American agriculture is aimed at balancing the production of food with the production of other ecosystem services. Under this scenario, significant advances occur in the development of environmental technologies to increase production of services, create substitutes, and reduce harmful trade-offs.
Past actions to slow or reverse the degradation of ecosystems have yielded significant benefits, but these improvements have generally not kept pace with growing pressures and demands. Although most ecosystem services assessed in the MA are being degraded, the extent of that degradation would have been much greater without responses implemented in past decades. For example, more than 100,000 protected areas (including strictly protected areas such as national parks as well as areas managed for the [[sustainable] use] of natural ecosystems, including timber harvest or wildlife harvest) covering about 11.7% of the terrestrial surface have now been established (R5.2.1). These play an important role in the conservation of biodiversity and ecosystem services, although important gaps in the distribution of protected areas remain, particularly in marine and freshwater systems.
Technological advances have also helped to lessen the rate of growth in pressure on ecosystems caused per unit increase in demand for ecosystem services. For all developing countries, for instance, yields of wheat, rice, and maize rose between 109% and 208% in the past 40 years. Without this increase, far more habitat would have been converted to agriculture during this time.
An effective set of responses to ensure the sustainable management of ecosystems must address the drivers presented in Key Question 4 and overcome barriers related to (RWG):
- inappropriate institutional and governance arrangements, including the presence of corruption and weak systems of regulation and accountability;
- market failures and the misalignment of economic incentives;
- social and behavioral factors, including the lack of political and economic power of some groups (such as poor people, women, and indigenous groups) who are particularly dependent on ecosystem services or harmed by their degradation;
- underinvestment in the development and diffusion of technologies that could increase the efficiency of use of ecosystem services and reduce the harmful impacts of various drivers of ecosystem change; and
- insufficient knowledge (as well as the poor use of existing knowledge) concerning ecosystem services and management, policy, technological, behavioral and institutional responses that could enhance benefits from these services while conserving resources.
All these barriers are compounded by weak human and institutional capacity related to the assessment and management of ecosystem services, underinvestment in the regulation and management of their use, lack of public awareness, and lack of awareness among decision-makers of the threats posed by the degradation of ecosystem services and the opportunities that more sustainable management of ecosystems could provide.
The MA assessed 74 response options for ecosystem services, integrated ecosystem management, conservation and [[sustainable] use] of biodiversity, and climate change. (See Appendix B.) Many of these options hold significant promise for conserving or sustainably enhancing the supply of ecosystem services. Examples of promising responses that address the barriers just described are presented in the remainder of this section (RWG, R2). The stakeholder groups that would need to take decisions to implement each response are indicated as follows: G for government, B for business and industry, and N for nongovernmental organizations and other civil society organizations such as community-based and indigenous peoples organizations.
Institutions and Governance
|
|
|


Changes in institutional and environmental governance frameworks are sometimes required in order to create the enabling conditions for effective management of ecosystems, while in other cases existing institutions could meet these needs but face significant barriers. Many existing institutions at both the global and the national level have the mandate to address the degradation of ecosystem services but face a variety of challenges in doing so related to the need for greater cooperation across sectors and the need for coordinated responses at multiple scales. However, since a number of the issues identified in this assessment are recent concerns and were not specifically taken into account in the design of today’s institutions, changes in existing institutions and the development of new ones may sometimes be needed, particularly at the national scale.
In particular, existing national and global institutions are not well designed to deal with the management of open access resources, a characteristic of many ecosystem services. Issues of ownership and access to resources, rights to participation in decision-making, and regulation of particular types of resource use or discharge of wastes can strongly influence the sustainability of ecosystem management and are fundamental determinants of who wins and who loses from changes in ecosystems. Corruption—a major obstacle to effective management of ecosystems— also stems from weak systems of regulation and accountability.
Promising interventions include:
- Integration of ecosystem management goals within other sectors and within broader development planning frameworks (G). The most important public policy decisions affecting ecosystems are often made by agencies and in policy arenas other than those charged with protecting ecosystems. Ecosystem management goals are more likely to be achieved if they are reflected in decisions in other sectors and in national development strategies. For example, the Poverty Reduction Strategies prepared by developing-country governments for the World Bank and other institutions strongly shape national development priorities, but in general these have not taken into account the importance of ecosystems to improving the basic human capabilities of the poorest (R17.ES).
- Increased coordination among multilateral environmental agreements and between environmental agreements and other international economic and social institutions (G). International agreements are indispensable for addressing ecosystem-related concerns that span national boundaries, but numerous obstacles weaken their current effectiveness (R17.2). The limited, focused nature of the goals and mechanisms included in most bilateral and multilateral environmental treaties does not address the broader issue of ecosystem services and human well-being. Steps are now being taken to increase coordination among these treaties, and this could help broaden the focus of the array of instruments. However, coordination is also needed between the multilateral environmental agreements and the more politically powerful international legal institutions, such as economic and trade agreements, to ensure that they are not acting at cross-purposes (R.SDM). And implementation of these agreements also needs to be coordinated among relevant institutions and sectors at the national level.
- Increased transparency and accountability of government and private-sector performance in decisions that affect ecosystems, including through greater involvement of concerned stakeholders in decision-making (G, B, N) (RWG, SG9). Laws, policies, institutions, and markets that have been shaped through public participation in decision-making are more likely to be effective and perceived as just. For example, degradation of freshwater and other ecosystem services generally have a disproportionate impact on those who are, in various ways, excluded from participation in the decision-making process (R7.2.3). Stakeholder participation also contributes to the decision-making process because it allows a better understanding of impacts and vulnerability, the distribution of costs and benefits associated with trade-offs, and the identification of a broader range of response options that are available in a specific context. And stakeholder involvement and transparency of decision-making can increase accountability and reduce corruption.
- Development of institutions that devolve (or centralize) decision-making to meet management needs while ensuring effective coordination across scales (G, B, N) (RWG). Problems of ecosystem management have been exacerbated by both overly centralized and overly decentralized decision-making. For example, highly centralized forest management has proved ineffective in many countries, and efforts are now being made to move responsibility to lower levels of decision-making either within the natural resources sector or as part of broader decentralization of governmental responsibilities. At the same time, one of the most intractable problems of ecosystem management has been the lack of alignment between political boundaries and units appropriate for the management of ecosystem goods and services. Downstream communities may not have access to the institutions through which upstream actions can be influenced; alternatively, downstream communities or countries may be stronger politically than upstream regions and may dominate control of upstream areas without addressing upstream needs. A number of countries, however, are now strengthening regional institutions for the management of trans-boundary ecosystems (such as the Danube River, the Mekong River Commission, East African cooperation on Lake Victoria, and the Amazon Cooperation Treaty Organization).
- Development of institutions to regulate interactions between markets and ecosystems (G) (RWG). The potential of policy and market reforms to improve ecosystem management are often constrained by weak or absent institutions. For example, the potential of the Clean Development Mechanism established under the Framework Convention on Climate Change to provide financial support to developing countries in return for greenhouse gas reductions, which would realize climate and biodiversity benefits through payments for carbon sequestration in forests, is constrained by unclear property rights, concerns over the permanence of reductions, and lack of mechanisms for resolving conflicts. Moreover, existing regulatory institutions often do not have ecosystem protection as a clear mandate. For example, independent regulators of privatized water systems and power systems do not necessarily promote resource use efficiency and renewable supply. There is a continuing importance of the role of the state to set and enforce rules even in the context of privatization and market-led growth.
- Development of institutional frameworks that promote a shift from highly sectoral resource management approaches to more integrated approaches (G, B) (R15.ES, R12.ES, R11.ES). In most countries, separate ministries are in charge of different aspects of ecosystems (such as ministries of environment, agriculture, water, and forests) and different drivers of change (such as ministries of energy, transportation, development, and trade). Each of these ministries has control over different aspects of ecosystem management. As a result, there is seldom the political will to develop effective ecosystem management strategies, and competition among the ministries can often result in policy choices that are detrimental to ecosystems. Integrated responses intentionally and actively address ecosystem services and human well-being simultaneously, such as integrated [[coast]al zone] management, integrated river basin management, and national sustainable development strategies. Although the potential for integrated responses is high, numerous barriers have limited their effectiveness: they are resource-intensive, but the potential benefits can exceed the costs; they require multiple instruments for their implementation; and they require new institutional and governance structures, skills, knowledge, and capacity. Thus far, the results of implementation of integrated responses have been mixed in terms of ecological, social, and economic impacts.

Economics and Incentives
Economic and financial interventions provide powerful instruments to regulate the use of ecosystem goods and services (C5 Box 5.2). Because many ecosystem services are not traded in markets, markets fail to provide appropriate signals that might otherwise contribute to the efficient allocation and [[sustainable] use] of the services. Even if people are aware of the services provided by an ecosystem, they are neither compensated for providing these services nor penalized for reducing them. In addition, the people harmed by the degradation of ecosystem services are often not the ones who benefit from the actions leading to their degradation, and so those costs are not factored into management decisions. A wide range of opportunities exists to influence human behavior to address this challenge in the form of economic and financial instruments. Some of them establish markets; others work through the monetary and financial interests of the targeted social actors; still others affect relative prices.
Market mechanisms can only work if supporting institutions are in place, and thus there is a need to build institutional capacity to enable more widespread use of these mechanisms (R17). The adoption of economic instruments usually requires a legal framework, and in many cases the choice of a viable and effective economic intervention mechanism is determined by the socioeconomic context. For example, resource taxes can be a powerful instrument to guard against the overexploitation of an ecosystem service, but an effective tax scheme requires well-established and reliable monitoring and tax collection systems. Similarly, subsidies can be effective to introduce and implement certain technologies or management procedures, but they are inappropriate in settings that lack the transparency and accountability needed to prevent corruption. The establishment of market mechanisms also often involves explicit decisions about wealth distribution and resource allocation, when, for example, decisions are made to establish private property rights for resources that were formerly considered common pool resources. For that reason, the inappropriate use of market mechanisms can further exacerbate problems of poverty.
Promising interventions include:
- Elimination of subsidies (Perverse subsidies) that promote excessive use of ecosystem services (and, where possible, transfer of these subsidies to payments for non-marketed ecosystem services) (G) (S7.ES). Subsidies paid to the [[agricultural] sectors] of OECD countries between 2001 and 2003 averaged over $324 billion annually, or one third the global value of agricultural products in 2000. Many countries outside the OECD also have inappropriate subsidies. A significant proportion of this total involves production subsidies that lead to greater food production in countries with subsidies than the global market conditions warrant, that promote the overuse of water, fertilizers, and [[pesticide]s], and that reduce the profitability of agriculture in developing countries. They also increase land values, adding to landowners’ resistance to subsidy reductions. On the social side, agricultural subsidies make farmers overly dependent on taxpayers for their livelihood, change wealth distribution and social composition by benefiting large corporate farms to the detriment of smaller family farms, and contribute to the dependence of large segments of the developing world on aid. Finally, it is not clear that these policies achieve one of their primary targets—supporting farmers’ income. Only about a quarter of the total expenses in price supports translate into additional income for farm households. Similar problems are created by fishery subsidies, which for the OECD countries were estimated at $6.2 billion in 2002, or about 20% of the gross value of production that year (C8.4.1). Subsidies on fisheries (Fisheries and aquaculture), apart from their distributional impacts, affect the management of resources and their [[sustainable] use] by encouraging overexploitation of the resource, thereby worsening the common property problem present in fisheries. Although some indirect subsidies, such as payments for the withdrawal of individual transferable harvest quotas, could have a positive impact on fisheries management, the majority of subsidies have a negative effect. Inappropriate subsidies are also common in sectors such as water and forest (Forestry)ry. Although removal of production subsidies would produce net benefits, it would not occur without costs. The farmers and fishers benefiting directly from the subsidies (Perverse subsidies) would suffer the most immediate losses, but there would also be indirect effects on ecosystems both locally and globally. In some cases it may be possible to transfer production subsides to other activities that promote ecosystem stewardship, such as payment for the provision or enhancement of regulatory or supporting services. Compensatory mechanisms may be needed for the poor who are adversely affected by the immediate removal of subsidies (R17.5). Reduced subsidies within the OECD may lessen pressures on some ecosystems in those countries, but they could lead to more rapid conversion and intensification of land for agriculture in developing countries and would thus need to be accompanied by policies to minimize the adverse impacts on ecosystems there.
- Greater use of economic instruments and market-based approaches in the [[management] of ecosystem services] (G, B, N) (RWG). Economic instruments and market mechanisms with the potential to enhance the management of ecosystem services include:
- Taxes or user fees for activities with “external” costs (trade-offs not accounted for in the market). These instruments create an incentive that lessens the external costs and provides revenues that can help protect the damaged ecosystem services. Examples include taxes on excessive application of nutrients or ecotourism user fees.
- Creation of markets, including through cap-and-trade systems. Ecosystem services that have been treated as “free” resources, as is often the case for water, tend to be used wastefully. The establishment of markets for the services can both increase the incentives for their conservation and increase the economic efficiency of their allocation if supporting legal and economic institutions are in place. However, as noted earlier, while markets will increase the efficiency of the use of the resource, they can have harmful effects on particular groups of users who may inequitably affected by the change (R17). The combination of regulated emission caps, coupled with market mechanisms for trading pollution rights, often provides an efficient means of reducing emissions harmful to ecosystems. For example, nutrient trading systems may be a low-cost way to reduce water pollution in the United States (R7 Box 7.3). One of the most rapidly growing markets related to ecosystem services is the carbon market. (See Figure 8.1.) Approximately 64 million tons of carbon dioxide equivalent were exchanged through projects from January to May 2004, nearly as much as during all of 2003 (78 million tons) (C5 Box 5.2). The value of carbon dioxide trades in 2003 was approximately $300 million. About one quarter of the trades (by volume of CO2 equivalents) involve investment in ecosystem services (hydropower or biomass). The World Bank has established a fund with a capital of $33.3 million (as of January 2005) to invest in afforestation and reforestation projects that sequester or conserve carbon in forest and agroecosystems while promoting biodiversity conservation and poverty alleviation. It is speculated that the value of the global carbon emissions trading markets may reach $10 billion to $44 billion in 2010 (and involve trades totaling 4.5 billion tons of carbon dioxide or equivalent).
- Payment for ecosystem services. Mechanisms can be established to enable individuals, firms, or the public sector to pay resource owners to provide particular services. For example, in New South Wales, Australia, associations of farmers purchase salinity credits from the State Forests Agency, which in turn contracts with upstream landholders to plant trees, which reduce water tables and store carbon. Similarly, in 1996 Costa Rica established a nationwide system of conservation payments to induce landowners to provide ecosystem services. Under this program, the government brokers contracts between international and domestic “buyers” and local “sellers” of sequestered carbon, biodiversity, watershed services, and scenic beauty. By 2001, more than 280,000 hectares of forests had been incorporated into the program at a cost of about $30 million, with pending applications covering an additional 800,000 hectares (C5 Box 5.2). Other innovative conservation financing mechanisms include “biodiversity offsets” (whereby developers pay for conservation activities as compensation for unavoidable harm that a project causes to biodiversity). An online news site, the Ecosystem Marketplace, has now been established by a consortium of institutions to provide information on the development of markets for ecosystem services and the payments for them.
- Mechanisms to enable consumer preferences to be expressed through markets. Consumer pressure may provide an alternative way to influence producers to adopt more sustainable production practices in the absence of effective government regulation. For example, certification schemes that exist for sustainable fisheries and forest practices provide people with the opportunity to promote sustainability through their consumer choices. Within the forest sector, forest certification has become widespread in many countries and forest conditions; thus far, however, most certified forests are in temperate regions, managed by large companies that export to northern retailers (R8).
Social and Behavioral Responses
Social and behavioral responses—including population policy; public education; empowerment of communities, women, and youth; and civil society actions—can be instrumental in responding to ecosystem degradation. These are generally interventions that stakeholders initiate and execute through exercising their procedural or democratic rights in efforts to improve ecosystems and human well-being.
Promising interventions include:
- Measures to reduce aggregate consumption of unsustainably managed ecosystem services (G, B, N) (RWG). The choices about what individuals consume and how much they consume are influenced not just by considerations of price but also by behavioral factors related to culture, ethics, and values. Behavioral changes that could reduce demand for degraded ecosystem services can be encouraged through actions by governments (such as education and public awareness programs or the promotion of demand-side management), industry (such as improved product labeling or commitments to use raw materials from sources certified as sustainable), and civil society (such as public awareness campaigns). Efforts to reduce aggregate consumption, however, must sometimes incorporate measures to increase the access to and consumption of those same ecosystem services by specific groups such as poor people.
- Communication and education (G, B, N) (RWG, R5). Improved communication and education are essential to achieve the objectives of the environmental conventions, the Johannesburg Plan of Implementation, and the sustainable management of natural resources more generally. Both the public and decision-makers can benefit from education concerning ecosystems and human well-being, but education more generally provides tremendous social benefits that can help address many drivers of ecosystem degradation. Barriers to the effective use of communication and education include a failure to use research and apply modern theories of learning and change. While the importance of communication and education is well recognized, providing the human and financial resources to undertake effective work is a continuing barrier.
- Empowerment of groups particularly dependent on ecosystem services or affected by their degradation, including women, indigenous people, and young people (G, B, N) (RWG). Despite women’s knowledge about the environment and the potential they possess, their participation in decision-making has often been restricted by social and cultural structures. Young people are key stakeholders in that they will experience the longer-term consequences of decisions made today concerning ecosystem services. Indigenous control of traditional homelands can sometimes have environmental benefits, although the primary justification continues to be based on human and cultural rights.
Technological Responses
Given the growing demands for ecosystem services and other increased pressures on ecosystems, the development and diffusion of technologies designed to increase the efficiency of resource use or reduce the impacts of drivers such as climate change and nutrient loading are essential. Technological change has been essential for meeting growing demands for some ecosystem services, and technology holds considerable promise to help meet future growth in demand. Technologies already exist for reducing nutrient pollution at reasonable costs—including technologies to reduce point source emissions, changes in crop management practices, and precision farming techniques to help control the application of fertilizers to a field, for example—but new policies are needed for these tools to be applied on a sufficient scale to slow and ultimately reverse the increase in nutrient loading (recognizing that this global goal must be achieved even while increasing nutrient applications in some regions such as sub-Saharan Africa). Many negative impacts on ecosystems and human well-being have resulted from these technological changes, however (R17.ES). The cost of “retrofitting” technologies once their negative consequences become apparent can be extremely high, so careful assessment is needed prior to the introduction of new technologies.
Promising interventions include:
- Promotion of technologies that increase crop yields without any harmful impacts related to water, nutrient, and pesticide use (G, B, N) (R6). Agricultural expansion will continue to be one of the major drivers of biodiversity loss well into the twenty-first century. Development, assessment, and diffusion of technologies that could increase the production of food per unit area sustainably without harmful trade-offs related to excessive use of water, nutrients, or pesticides would significantly lessen pressure on other ecosystem services. Without the intensification that has taken place since 1950, a further 20 million square kilometers of land would have had to be brought into production to achieve today’s crop production (C.SDM). The challenge for the future is to similarly reduce the pressure for expansion of agriculture without simultaneously increasing pressures on ecosystem services due to water use, excessive nutrient loading, and pesticide use.
- Restoration of ecosystem services (G, B, N) (RWG, R7.4). Ecosystem restoration activities are now common in many countries and include actions to restore almost all types of ecosystems, including wetlands, forests, grasslands, estuaries, coral reefs, and mangroves. Ecosystems with some features of the ones that were present before conversion can often be established and can provide some of the original ecosystem services (such as pollution filtration in wetlands or timber production from forests). The restored systems seldom fully replace the original systems, but they still help meet needs for particular services. Yet the cost of restoration is generally extremely high in relation to the cost of preventing the degradation of the ecosystem. Not all services can be restored, and those that are heavily degraded may require considerable time for restoration.
- Promotion of technologies to increase energy efficiency and reduce greenhouse gas emissions (G, B) (R13). Significant reductions in net greenhouse gas emissions are technically feasible due to an extensive array of technologies in the energy supply, energy demand, and waste management sectors. Reducing projected emissions will require a portfolio of energy production technologies ranging from fuel switching (coal/oil to gas) and increased power plant efficiency to increased use of renewable energy technologies, complemented by more efficient use of energy in the transportation, buildings, and industry sectors. It will also involve the development and implementation of supporting institutions and policies to overcome barriers to the diffusion of these technologies into the marketplace, increased public and private-sector funding for research and development, and effective technology transfer.
Knowledge and Cognitive Responses
Effective management of ecosystems is constrained both by a lack of knowledge and information concerning different aspects of ecosystems and by the failure to use adequately the information that does exist in support of management decisions. Although sufficient information exists to take many actions that could help conserve ecosystems and enhance human well-being, major information gaps exist. In most regions, for example, relatively little is known about the status and economic value of most ecosystem services, and their depletion is rarely tracked in national economic accounts. Limited information exists about the likelihood of nonlinear changes in ecosystems or the location of thresholds where such changes may be encountered. Basic global data on the extent and trend in different types of ecosystems and land use are surprisingly scarce. Models used to project future environmental and economic conditions have limited capability of incorporating ecological “feedbacks” including nonlinear changes in ecosystems.
At the same time, decision-makers do not use all of the relevant information that is available. This is due in part to institutional failures that prevent existing policy-relevant scientific information from being made available to decision-makers. But it is also due to the failure to incorporate other forms of knowledge and information, such as traditional knowledge and practitioners’ knowledge, that are often of considerable value for ecosystem management.
Promising interventions include:
- Incorporate both the market and non-market values of ecosystems in resource management and investment decisions (G, B) (RWG). Most resource management and investment decisions are strongly influenced by considerations of the monetary costs and benefits of alternative policy choices. In the case of ecosystem management, however, this often leads to outcomes that are not in the interest of society, since the non-marketed values of ecosystems may exceed the marketed values. As a result, many existing resource management policies favor sectors such as agriculture, forest (Forestry)ry, and fisheries (Fisheries and aquaculture) at the expense of the use of these same ecosystems for water supply, recreation, and cultural services that may be of greater economic value. Decisions can be improved if they include the total economic value of alternative management options and involve deliberative mechanisms that bring to bear noneconomic considerations as well.
- Use of all relevant forms of knowledge and information in assessments and decision-making, including traditional and practitioners’ knowledge (G, B, N) (RWG, C17.ES). Effective management of ecosystems typically requires “place-based” knowledge—information about the specific characteristics and history of an ecosystem. Formal scientific information is often one source of such information, but traditional knowledge or practitioners’ knowledge held by local resource managers can be of equal or greater value. While that knowledge is used in the decisions taken by those who have it, it is too rarely incorporated into other decision-making processes and is often inappropriately dismissed.
- Enhance and sustain human and institutional capacity for assessing the consequences of ecosystem change for human well-being and acting on such assessments (G, B, N) (RWG). Greater technical capacity is needed for agriculture, forest, and fisheries management. But the capacity that exists for these sectors, as limited as it is in many countries, is still vastly greater than the capacity for effective management of other ecosystem services. Because awareness of the importance of these other services has only recently grown, there is limited experience with assessing ecosystem services fully. Serious limits exist in all countries, but especially in developing countries, in terms of the expertise needed in such areas as monitoring (Environmental monitoring and assessment) changes in ecosystem services, economic valuation or health assessment of ecosystem changes, and policy analysis related to ecosystem services. Even when such assessment information is available, however, the traditional highly sectoral nature of decision-making and resource management makes the implementation of recommendations difficult. This constraint can also be overcome through increased training of individuals in existing institutions and through institutional reforms to build capacity for more integrated responses.
Design of Effective Decision-making Processes
Decisions affecting ecosystems and their services can be improved by changing the processes used to reach those decisions. The context of decision-making about ecosystems is changing rapidly. The new challenge to decision-making is to make effective use of information and tools in this changing context in order to improve the decisions. At the same time, some old challenges must still be addressed. The decision-making process and the actors involved influence the intervention chosen. Decision-making processes vary across jurisdictions, institutions, and cultures. Yet the MA has identified the following elements of decision-making processes related to ecosystems and their services that tend to improve the decisions reached and their outcomes for ecosystems and human well-being (R18.ES):
- Use the best available information, including considerations of the value of both marketed and non-marketed ecosystem services.
- Ensure transparency and the effective and informed participation of important stakeholders.
- Recognize that not all values at stake can be quantified, and thus quantification can provide a false objectivity in decision processes that have significant subjective elements.
- Strive for efficiency, but not at the expense of effectiveness.
- Consider equity and vulnerability in terms of the distribution of costs and benefits.
- Ensure accountability and provide for regular monitoring (Environmental monitoring and assessment) and evaluation.
- Consider cumulative and cross-scale effects and, in particular, assess trade-offs across different ecosystem services.
A wide range of deliberative tools (which facilitate transparency and stakeholder participation), information-gathering tools (which are primarily focused on collecting data and opinions), and planning tools (which are typically used to evaluate potential policy options) can assist decision-making concerning ecosystems and their services (R3 Tables 3.6 to 3.8). Deliberative tools include neighborhood forums, citizens’ juries, community issues groups, consensus conferences, electronic democracy, focus groups, issue forums, and ecosystem service user forums. Examples of information-gathering tools include citizens’ research panels, deliberative opinion polls, environmental impact assessments, participatory rural appraisal, and rapid rural appraisal. Some common planning tools are consensus participation, cost-benefit analysis, multi-criteria analysis, participatory learning and action, stakeholder decision analysis, trade-off analysis, and visioning exercises. The use of decision-making methods that adopt a pluralistic perspective is particularly pertinent, since these techniques do not give undue weight to any particular viewpoint. These tools can be used at a variety of scales, including global, sub-global, and local.
A variety of frameworks and methods can be used to make better decisions in the face of uncertainties in data, prediction, context, and scale (R4.5). Commonly used methods include cost-benefit or multi-criteria analyses, risk assessment, the precautionary principle, and vulnerability analysis. (See Table 8.1.) All these methods have been able to support optimization exercises, but few of them have much to say about equity. Cost-benefit analysis can, for example, be modified to weight the interests of some people more than others. The discount rate can be viewed, in long-term analyses, as a means of weighing the welfare of future generations; and the precautionary principle can be expressed in terms of reducing the exposure of certain [[population]s] or systems whose preferential status may be the result of equity considerations. Only multicriteria analysis was designed primarily to accommodate optimization across multiple objectives with complex interactions, but this can also be adapted to consider equity and threshold issues at national and sub-national scales. Finally, the existence and significance of various thresholds for change can be explored by several tools, but only the precautionary principle was designed explicitly to address such issues.

Scenarios provide one way to cope with many aspects of uncertainty, but our limited understanding of [[ecological] systems (Ecology)] and human responses shrouds any individual scenario in it own characteristic uncertainty (R4.ES). Scenarios can be used to highlight the implications of alternative assumptions about critical uncertainties related to the behavior of human and ecological systems. In this way, they provide one means to cope with many aspects of uncertainty in assessing responses. The relevance, significance, and influence of scenarios ultimately depend on who is involved in their development (SG9.ES).
At the same time, though, there are a number of reasons to be cautious in the use of scenarios. First, individual scenarios represent conditional projections based on specific assumptions. Thus, to the extent that our understanding and representation of the ecological and human systems represented in the scenarios is limited, specific scenarios are characterized by their own uncertainty. Second, there is uncertainty in translating the lessons derived from scenarios developed at one scale—say, global—to the assessment of responses at other scales—say, sub-national. Third, scenarios often have hidden and hard-to-articulate assumptions. Fourth, environmental scenarios have tended to more effectively incorporate state- of-the-art natural science modeling than social science modeling.
Historically, most responses addressing ecosystem services have concentrated on the short-term benefits from increasing the productivity of provisioning services (RWG). Far less emphasis has been placed on managing regulating, cultural, and supporting ecosystem services; on management goals related to poverty alleviation and equitable distribution of benefits from ecosystem services; and on the long-term consequences of ecosystem change on the provision of services. As a result, the current management regime falls far short of the potential for meeting human needs and conserving ecosystems.
Effective management of ecosystems requires coordinated responses at multiple scales (SG9, R17.ES). Responses that are successful at a small scale are often less successful at higher levels due to constraints in legal frameworks and government institutions that prevent their success. In addition, there appear to be limits to scaling up, not only because of these higher-level constraints, but also because interventions at a local level often address only direct drivers of change rather than indirect or underlying ones. For example, a local project to improve livelihoods of communities surrounding a protected area in order to reduce pressure on it, if successful, may increase migration into buffer zones, thereby adding to pressures. Cross-scale responses may be more effective at addressing the higher-level constraints and leakage problems and simultaneously tackling regional and national as well as local-level drivers of change. Examples of successful cross-scale responses include some co-management approaches to natural resource management in fisheries (Fisheries and aquaculture) and forest (Forestry)ry and multi-stakeholder policy processes (R15.ES).
Active adaptive management can be a particularly valuable tool for reducing uncertainty about ecosystem management decisions (R17.4.5). The term “active” adaptive management is used here to emphasize the key characteristic of the original concept (which is frequently and inappropriately used to mean “learning by doing”): the design of management programs to test hypotheses about how components of an ecosystem function and interact and to thereby reduce uncertainty about the system more rapidly than would otherwise occur. Under an adaptive management approach, for example, a fisheries manager might intentionally set harvest levels either lower or higher than the “best estimate” in order to gain information more rapidly about the shape of the yield curve for the fishery. Given the high levels of uncertainty surrounding coupled socio-ecological systems, the use of active adaptive management is often warranted.
What are the most important uncertainties hindering decision-making concerning ecosystems?

The MA was unable to provide adequate scientific information to answer a number of important policy questions related to ecosystem services and human well-being. In some cases, the scientific information may well exist already but the process used and time frame available prevented either access to the needed information or its assessment. But in many cases either the data needed to answer the questions were unavailable or the knowledge of the ecological or social system was inadequate. We identify the following information gaps that, if addressed, could significantly enhance the ability of a process like the MA to answer policy-relevant questions posed by decision- makers (CWG, SWG, RWG, SGWG)
Condition and Trends
- There are major gaps in global and national monitoring systems that result in the absence of well-documented, comparable, time-series information for many ecosystem features and that pose significant barriers in assessing condition and trends in ecosystem services. Moreover, in a number of cases, including hydrological systems, the condition of the monitoring systems that do exist is declining.
- Although for 30 years remote sensing capacity has been available that could enable rigorous global monitoring (Environmental monitoring and assessment) of land cover change, financial resources have not been available to process this information, and thus accurate measurements of land cover change are only available on a case study basis.
- Information on land degradation in drylands is extremely poor. Major shortcomings in the currently available assessments point to the need for a systematic global monitoring program, leading to the development of a scientifically credible, consistent baseline of the state of land degradation and desertification.
- There is little replicable data on global forest extent that can be tracked over time.
- There is no reasonably accurate global map of wetlands.
- There are major gaps in information on non-marketed ecosystem services, particularly regulating, cultural, and supporting services.
- There is no complete inventory of species and limited information on the actual distributions of many important plant and animal species.
- More information is needed concerning:
- the nature of interactions among drivers in particular regions and across scales;
- the responses of ecosystems to changes in the availability of important nutrients and carbon dioxide;
- nonlinear changes in ecosystems, predictability of thresholds, and structural and dynamic characteristics of systems that lead to threshold and irreversible changes; and,
- quantification and prediction of the relationships between biodiversity changes and changes in ecosystem services for particular places and times.
- There is limited information on the economic consequences of changes in ecosystem services at any scale and, more generally, limited information on the details of linkages between human well-being and the provision of ecosystem services, except in the case of food and water.
- There are relatively few models of the relationship between ecosystem services and human well-being.
Scenarios
- There is a lack of analytical and methodological approaches to explicitly nest or link scenarios developed at different geographic scales. This innovation would provide decision-makers with information that directly links local, national, regional, and global futures of ecosystem services in considerable detail.
- There is limited modeling capability related to effects of changes in ecosystems on flows of ecosystem services and effects of changes in ecosystem services on changes in human well-being. Quantitative models linking ecosystem change to many ecosystem services are also needed.
- Significant advances are needed in models that link ecological and social processes, and models do not yet exist for many cultural and supporting ecosystem services.
- There is limited capability to incorporate adaptive responses and changes in human attitudes and behaviors in models and to incorporate critical feedbacks into quantitative models. As food supply changes, for example, so will patterns of land use, which will then feed back on ecosystem services, climate, and food supply.
- There is a lack of theories and models that anticipate thresholds that, once passed, yield fundamental system changes or even system collapse.
- There is limited capability of communicating to nonspecialists the complexity associated with holistic models and scenarios involving ecosystem services, in particular in relation to the abundance of nonlinearities, feedbacks, and time lags in most ecosystems.
Response Options
- There is limited information on the marginal costs and benefits of alternative policy options in terms of total economic value (including non-marketed ecosystem services).
- Substantial uncertainty exists with respect to who benefits from watershed services and how changes in particular watersheds influence those services; information in both of these areas is needed in order to determine whether markets for watershed services can be a fruitful response option.
- There has been little social science analysis of the effectiveness of responses on biodiversity conservation.
- There is considerable uncertainty with regards to the importance people in different cultures place on cultural services, how this changes over time, and how it influences the net costs and benefits of trade-offs and decisions.
Terms of Use
The copyright for material on this page is the property of the World Resources Institute. Click here for the Terms of Use (Ecosystems and Human Well-being Synthesis: Key Questions in the Millennium Ecosystem Assessment).
Disclaimer: This chapter is taken wholly from, or contains information that was originally written for the Millennium Ecosystem Assessment as published by the World Resources Institute. The content has not been modified by the Encyclopedia of Earth.
|
|