Global Environment Outlook (GEO-4): Chapter 2
Climate change affects the warming and
acidification of the global ocean, it influences
the Earth’s surface temperature, the amount,
timing and intensity of precipitation,
including storms and droughts. On land,
these changes affect freshwater availability
and quality, surface water run-off and
groundwater recharge, and the spread of
water-borne disease vectors and it is likely
to play an increasing role in driving changes
in biodiversity and species’ distribution and
relative abundance.
Contents
- 1 Chapter 2: Atmosphere (Global Environment Outlook (GEO-4): Chapter 2)
- 2 Main messages
- 3 Introduction In 1987 the World Commission on Environment and Development (WCED), also known as the Brundtland Commission, recognized problems of regional (Global Environment Outlook (GEO-4): Chapter 2) air pollution, with its impacts on environmental and cultural values (see Chapter 1 (Global Environment Outlook (GEO-4): Chapter 2)). It stated that burning fossil fuels gives rise to carbon dioxide (CO2) emissions, and that the consequent greenhouse effect “may by early next century have increased average global [[temperature]s] enough to shift agricultural production areas, raise sea levels to flood coastal cities and disrupt national economies.” It also said that “Other industrial gases threaten the planet’s protective ozone shield,” and “Industry and agriculture put toxic substances into the human food chain,” highlighting the lack of an approach to effective chemicals management.
- 4 Drivers of Change and Pressures
- 5 Environmental Trends and Responses
- 6 Climate Change
- 7 Stratospheric Ozone Depletion
- 8 Effects of stratospheric ozone depletion
- 9 Challenges and Opportunities
- 10 Contributors Coordinating lead authors: Johan C.I. Kuylenstierna and Trilok S. Panwar Lead authors: Mike Ashmore, Duncan Brack, Hans Eerens, Sara Feresu, Kejun Jiang, Héctor Jorquera, Sivan Kartha, Yousef Meslmani, Luisa T. Molina, Frank Murray, Linn Persson, Dieter Schwela, Hans Martin Seip, Ancha Srinivasan, and Bingyan Wang Chapter review editors: Michael J. Chadwick and Mahmoud A.I. Hewehy Chapter coordinator: Volodymyr Demkine (Global Environment Outlook (GEO-4): Chapter 2)
- 11 Notes This is a chapter from Global Environment Outlook (GEO-4): Environment for Development (e-book). Previous: Chapter 1 (Global Environment Outlook (GEO-4): Chapter 2) 6 (Global Environment Outlook (GEO-4): Chapter 2) |Table of Contents (Global Environment Outlook (GEO-4): Chapter 2)|Next: Chapter 3 (Global Environment Outlook (GEO-4): Chapter 2) 3
Chapter 2: Atmosphere (Global Environment Outlook (GEO-4): Chapter 2)
Main messages
A series of major atmospheric environment issues face the world, with both short- and long-term challenges, that are already affecting human health and well-being. Impacts are changing in their nature, scope and regional distribution, and there is a mixture of both worrying developments and substantial progress.
Climate change is a major global challenge. Impacts are already evident, and changes in water availability, food security and sea-level rise are projected to dramatically affect many millions of people. Anthropogenic greenhouse gas (GHG) emissions (principally CO2) are the main drivers of change. There is now visible and unequivocal evidence of climate change impacts. There is confirmation that the Earth’s average temperature has increased by approximately 0.74°C over the past century. The impacts of this warming include sea-level rise and increasing frequency and intensity of heat waves, storms, floods and droughts. The best estimate for warming over this century is projected by the Intergovernmental Panel on Climate Change (IPCC) to be between a further 1.8 and 4°C. This will intensify the impacts, leading to potentially massive consequences, especially for the most vulnerable, poor and disadvantaged people on the planet. There is increasing concern about the likelihood of changes in rainfall patterns and water availability, thereby affecting food security. Major changes are projected for regions, such as Africa, that are least able to cope. Sea-level rise threatens millions of people and major economic centres in coastal areas and the very existence of small island states. Adaptation to anticipated climate change is now a global priority.
To prevent future severe impacts from climate change, drastic steps are necessary to reduce emissions from energy, transport, forest and agricultural sectors. There has been a remarkable lack of urgency in tackling GHG emissions during most of the past two decades. Since the 1987 report of the World Commission on Environment and Development (Brundtland Commission), there has been a sharp and continuing rise in the emissions. There is an agreement in force, the Kyoto Protocol, but the global response is far from adequate. Recent studies show that the total cost of measures to mitigate climate change would be a small fraction of the global economy. Mainstreaming climate concerns in development planning is urgent, especially in sectors such as energy, transport, agriculture, forests and infrastructure development, at both policy and implementation levels. Likewise, policies facilitating adaptation to climate change in vulnerable sectors, such as agriculture, are crucial to minimize adverse impacts. Transformations in social and economic structures, with broad stakeholder participation toward low carbon societies, are critical.
More than 2 million people globally are estimated to die prematurely each year due to indoor and outdoor air pollution. Although air quality has improved dramatically in some cities, many areas still suffer from excessive air pollution. The situation on air pollution is mixed, with some successes in both developed and developing countries, but major problems remain. Air pollution has decreased in some cities in different parts of the world through a combination of technology improvement and policy measures. However, increasing human activity is offsetting some of the gains. Transport demand increases every year, and is responsible for a substantial part of both anthropogenic GHG emissions and health effects due to air pollution. Many people, especially in Asia where the most polluted cities are now found, still suffer from very high levels of pollutants in the air they breathe, particularly from very fine particulate matter, the main air pollutant affecting human health. This is also related to the massive industrial expansion in many Asian cities that are producing goods for the global economy. This pollution also reduces visibility by creating urban and regional haze. Many poor communities are still dependent on traditional biomass and coal for cooking. The health of women and children in particular suffers as a result of indoor air pollution, and a total of 1.6 million people are estimated to die prematurely each year. Many air pollutants, including sulphur and nitrogen oxides, accelerate damage to materials, including historic buildings. Long-range transport of a variety of air pollutants remains an issue of concern for human and ecosystem health, and for the provision of ecosystem services. Tropospheric (ground-level) ozone is increasing throughout the northern hemisphere, and is a regional pollutant affecting human health and crop yields. Persistent organic pollutants from industrial economies accumulate in the Arctic, affecting people not responsible for the emissions.
The “hole” over the Antarctic in the stratospheric ozone layer that gives protection from harmful ultraviolet radiation is now the largest ever. Emissions of ozone-depleting substances (ODS) have decreased over the last 20 years, yet the concern about the state of stratospheric ozone still persists. On the positive side, precautionary action on stratospheric ozone depletion was taken by some industrialized countries before the impacts were evident. Their leadership was key to making the reductions in the manufacture and consumption of ODS a global success story. Although emissions of ODS have decreased over the last 20 years, it is estimated that the ozone layer over the Antarctic will not fully recover until between 2060 and 2075, assuming full Montreal Protocol compliance.
Rapid growth in energy demand, transport and other forms of consumption continue to result in air pollution, and are responsible for unprecedented absolute growth in anthropogenic GHG emissions. Since the Brundtland Commission emphasized the urgent need for addressing these problems, the situation has changed, in some cases for the better, but in others for the worse. A number of pressures are still building, driving up the emissions. The population is increasing, and people use more and more fossil fuel-based energy, consume more goods and travel further, increasingly using cars as their favourite transport mode. Aviation is growing rapidly and increased trade, as part of the globalized economy, leads to growth in the transport of goods by sea, where fuel quality and emissions are currently not strictly regulated. These pressures are being somewhat offset by increases in efficiency and/or from implementation of new or improved technology.
Measures to address harmful emissions are available and cost-effective, but require leadership and collaboration. Existing mechanisms to tackle ODS are adequate, while air quality management in many parts of the world requires the strengthening of institutional, human and financial resources for implementation. Where air pollution has been reduced, the economic benefits associated with reduced impacts have far outweighed the costs of action. For climate change, more innovative and equitable approaches for mitigation and adaptation are crucial, and will require systemic changes in consumption and production patterns. Many policies and technologies required to address emissions of GHGs and air pollutants are currently available and are cost-effective. Some nations have started to implement changes. While additional research and assessment efforts should continue, dynamic leadership and international collaboration, including technological transfer and effective financial mechanisms, are required to accelerate policy implementation around the world. The long-term risks from emissions of substances with long residence times, especially those that are also GHGs, should strongly encourage the use of a precautionary approach now.
Introduction In 1987 the World Commission on Environment and Development (WCED), also known as the Brundtland Commission, recognized problems of regional (Global Environment Outlook (GEO-4): Chapter 2) air pollution, with its impacts on environmental and cultural values (see Chapter 1 (Global Environment Outlook (GEO-4): Chapter 2)). It stated that burning fossil fuels gives rise to carbon dioxide (CO2) emissions, and that the consequent greenhouse effect “may by early next century have increased average global [[temperature]s] enough to shift agricultural production areas, raise sea levels to flood coastal cities and disrupt national economies.” It also said that “Other industrial gases threaten the planet’s protective ozone shield,” and “Industry and agriculture put toxic substances into the human food chain,” highlighting the lack of an approach to effective chemicals management.
Key conclusions of Our Common Future, the Brundtland Commission report, were that while economic activity, industrial production and consumption have profound environmental impacts, “poverty is a major cause-and-effect of global environmental problems.” Human well-being, especially poverty and equity, are affected by all of the atmospheric environment issues addressed in this chapter. It is clear that air pollution from human activities constitutes one of the most important environmental issues affecting development across the world. Climate change threatens coastal areas, as well as the food security and livelihoods of people in the most vulnerable regions. Indoor air pollution, from burning biomass or coal for cooking, particularly affects women and young children. Outdoor air pollution in cities or near major industries disproportionately kills or harms the health of poorer people. Tackling emissions will contribute to the attainment of the Millennium Development Goals [1], especially the goals of eradicating hunger, ensuring good health for all and ensuring environmental sustainability.
Atmospheric environment issues are complex. Different primary pollutants emitted, and secondary pollutants formed in the atmosphere (Atmospheric composition and structure), have very different residence times, and are transported to varying distances, and this affects the scale at which their impact is felt (see Figure 2.1). Those substances that have very short residence times affect indoor and local air quality. Substances with residence times of days to weeks give rise to local and regional problems, those with residence times from weeks to months give rise to continental and hemispheric problems, and those with residence times of years give rise to global problems. Some [[greenhouse gas]es] may last up to 50,000 years in the atmosphere.
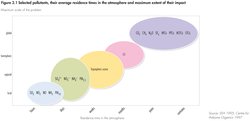 Fig 2.1 selected pollutants, their average residence times in the atmosphere and maximum extent of their impact.[2]
 There is now a consensus amongst the vast majority of scientists that anthropogenic emissions of greenhouse gases, of which CO2 and methane are the most significant, are already causing climate change. The global emissions are still increasing and the impact will be felt by all regions of the world, with changing weather patterns and sea-level rise affecting coastal human settlements, disease patterns, food production and ecosystem services.
Air pollution is still leading to the premature death of a large number of people. Although the air quality of some cities has improved dramatically over the last 20 years, mainly in the richer nations, the air quality of many cities in developing nations has deteriorated to extremely poor levels. Even in richer countries, in recent years, improvements in levels of particulate matter and tropospheric ozone have stagnated, and further measures are needed. Regional air pollution problems of acidification (Acid rain) have been reduced in Europe and North America, but are now a growing policy focus in parts of Asia, where acidic deposition has increased. Tropospheric (ground-level) ozone pollution causes significant reductions in crop yield and quality. The transfer of pollutants across the northern hemisphere, especially tropospheric ozone, is becoming an increasingly important issue. Despite efforts to tackle air pollution since 1987, emissions of various air pollutants to the atmosphere (Atmospheric composition and structure) are still having dramatic impacts on human health, economies and livelihoods, as well as on ecosystem integrity and productivity.
Emissions of ozone-depleting substances (ODS), such as chlorofluorocarbons, lead to thinning of the stratospheric ozone layer, resulting in increased ultraviolet (UV-B) radiation reaching the Earth’s surface. The ozone hole, or seasonal ozone depletion over the Antarctic, still occurs. Increasing UV-B radiation affects skin cancer rates, eyes and immune systems, thus having important public health implications[3]. There are concerns about the UV-B effect on ecosystems, for example through impacts on phytoplankton and marine food webs[4].
Since 1987, it has become clear that there are high levels of persistent organic pollutants (POPs) and mercury in food chains, with the potential to affect the health of humans and wildlife, especially species higher in food chains. POPs represent a global problem. Some have low residence times in the atmosphere, but are re-volatilized, and can migrate over long distances and persist in the environment. Many POPs are transported through the atmosphere, but their impacts are mediated by aquatic and land-based food chains (see Chapters 3 and 4 (Global Environment Outlook (GEO-4): Chapter 2)) and accumulated in Polar Regions (see Chapter 6 (Global Environment Outlook (GEO-4): Chapter 2)).
Drivers of Change and Pressures
Atmospheric composition (Atmospheric composition and structure) is affected by virtually all human activities. Population increases, income growth and the global liberalization of trade in goods-and services all stimulate an increase in energy and transport demand. These are drivers of emissions of substances into the atmosphere and, as many cost-benefit studies have shown[5], the costs to our collective well-being often outweigh the individual benefits of the high-consumption lifestyles people have or aspire to (see [[Chapter 1 (Global Environment Outlook (GEO-4): Chapter 2)]2]). In many cases, emissions result from satisfying the wants of a rising affluent class rather than from fulfilling basic needs (see Box 2.1). Significant downward pressure on emissions has come from increases in efficiency and/or from implementation of new or improved technology.
|
Box 2.1 Energy use in the context of Millennium Development Goals (MDGs)[6] |
|
Currently, access to energy for heating, cooking, transport and electricity is considered a basic human right. Various studies have investigated the consequences of meeting the minimum standards set out in the MDGs, and found that the total amount of primary energy required to meet the minimum standards is negligible on the global scale. Electricity for lighting (in homes, schools and rural health facilities), liquefied petroleum gas (LPG) for cooking fuel (for 1.7 billion urban and rural dwellers), and diesel used in cars and buses for transport (for 1.5 million rural communities) would require less than 1 per cent of total annual global energy demand, and would generate less than 1 per cent of current annual global CO2 emissions. This shows that energy services could be provided to meet the MDGs without significantly increasing the global energy sector’s environmental impacts. |
The developed world is still the main per capita user of fossil fuel, and often exports long-lived, outdated and polluting technology to developing countries. The wealthier nations also “transfer” pollution by purchasing goods that are produced in a less environmentally friendly manner in lower-income countries. As a consequence, vulnerable communities in developing countries are most exposed to the adverse health effects caused by air pollution (see Chapters 6, 7 and 10 (Global Environment Outlook (GEO-4): Chapter 2)).
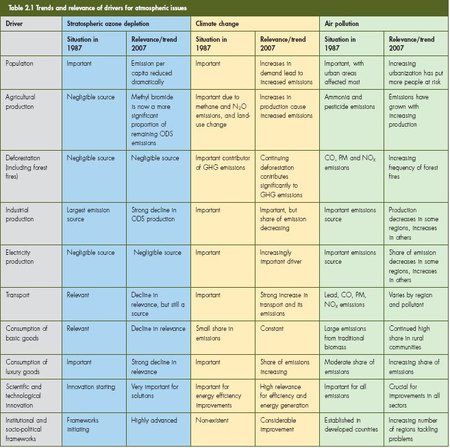
Due to inertia in economic, social, cultural and institutional systems, transitions to more sustainable modes of production and consumption are slow and cumbersome. Typically, it takes 30–50 years or more before such changes are fully implemented, although the first improvements can be seen at a much earlier stage (see Box 2.2). Understanding how policy decisions will affect economic activities, and their associated emissions and impacts can facilitate early warning signals and timely actions. Table 2.1 presents the main drivers affecting the atmosphere (Atmospheric composition and structure).
Production, consumption and population growth
Ultimately, the drivers for atmospheric environment impacts are the increasing scale and changing form of human activity. The increasing population (Human population explosion) on the planet contributes to the scale of activity but, of even greater importance, the continuing expansion of the global economy has led to massive increases in production and consumption (see [[Chapter 1 (Global Environment Outlook (GEO-4): Chapter 2)]3]), indirectly or directly causing emissions to the atmosphere (Atmospheric composition and structure).
|
Box 2.2 Examples of inertia in drivers[7] |
|
Energy supply The energy sector requires massive investments in infrastructure to meet projected demand. The International Energy Agency (IEA) estimates that the investments will total around US$20 trillion from 2005 to 2030, or US$800 billion/year, with the electricity sector absorbing the majority of this investment. Developing countries, where energy demand is expected to increase quickly, will require about half of such investments. Often, these investments are long term. Nuclear plants, for example, are designed for a lifetime of 50 years or more. Decisions made today will have effects well into our future. Transport Production of road vehicles, aircraft and ships are all examples of steadily growing mature markets. It will take time for new concepts, such as hybrid or hydrogen fuel cell cars, or high-speed magnetic trains, to massively penetrate markets. Technology barriers and standards, cost reductions, new production plants and, finally, market penetration are all challenging obstacles. Old production facilities often remain operational until they are economically outdated, and the lifetime of a new car is well over a decade. The penetration time of a new technology, such as the hydrogen fuel cell car will, even under the most optimistic projections, take at least 40 years. |
Since the Brundtland Commission report, the Earth’s population has risen by almost 30 per cent (see [[Chapter 1 (Global Environment Outlook (GEO-4): Chapter 2)]4]), with regional increases ranging from 5.1 per cent in Europe to 57.2 per cent in Africa[8]. Global economic output (measured in purchasing power parity or PPP) has increased by 76 per cent, almost doubling the average per capita gross national income from about US$3 300 to US$6 400. This average increase in per capita income masks large regional variations, ranging from virtual stagnation in Africa to a doubling in some countries in Asia and the Pacific. Over the same period, urban populations have risen to include half of humanity. Although the rate of population growth is expected to continue to slow, the world population is still expected to be 27 per cent above current levels by 2030[9]. Nearly all population growth expected for the world in that period will be concentrated in urban areas (see [[Chapter 1 (Global Environment Outlook (GEO-4): Chapter 2)]5]).
 Fig 2.2 Energy use per US$ 1000 GDP (in PPP for 2000).[10]
 In line with population and GDP growth, there is an increase in production and consumption. Energy use has been partly decoupled from the growth of GDP (see Figure 2.2), due to increased efficiency in energy and electricity production, improved production processes and a reduction in material intensity. Nevertheless, the major proportion of pollutant emissions result from energy-related activities, especially from the use of fossil fuel. The global primary energy supply has increased by 4 percent/ year between 1987 and 2004[11] since Brundtland, and fossil fuels still supply over 80 per cent of our energy needs (see Figure 2.3). The contribution of non-biomass renewable energy sources (solar, wind, tidal, hydro and geothermal) to the total global energy supply has increased very slowly, from 2.4 percent in 1987 to 2.7 percent in 2004[12] (see Chapter 5 (Global Environment Outlook (GEO-4): Chapter 2)).
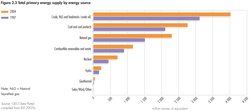 Fig 2.3 Total primary energy supply by energy source.[13]
 The energy intensity of our society (defined as energy use per unit of GDP in PPP units) has decreased since Brundtland by an average of 1.3 percent per year (see Figure 2.2). However, the impact of total GDP growth on energy use has outweighed these mitigating efficiency improvements.
Manufacturing processes can also cause direct emissions, such as CO2 from steel and cement production, SO2 from copper, lead, nickel and zinc production, NOX from nitric acid production, CFCs from refrigeration and air conditioning, SF6 from electricity equipment use, and perfluorocarbons (PFCs) from the electronic industry and aluminium production.
Humanity’s footprint on the planet has grown correspondingly larger. Natural resource demands have expanded, the burden on the environment has grown heavier, and this trend looks set to continue although there have been shifts in the sources of the pressures. The share of total GDP of the agriculture and industry sectors has decreased from 5.3 and 34.2 percent in 1987 to 4 and 28 percent of GDP in 2004[14]. The transport sector has shown a consistently high growth rate over the same period, with a 46.5 percent increase in energy used globally by road transport between 1987 and 2004[15]. Reducing the impacts of these major drivers of atmospheric pollution will involve multiple transitions in sectors such as energy, transport, agricultural land use and urban infrastructure. The right mix of appropriate government regulation, greater use of energy saving technologies and behavioural change can substantially reduce CO2 emissions from the building sector, which accounts for 30–40 percent of global energy use. An aggressive energy efficiency policy in this sector might deliver billions of tonnes of emission reductions annually[16].
Increasing demand for such products and services as refrigeration, air-conditioning, foams, aerosol sprays, industrial solvents and fire suppressants led to increasing production of a variety of chemicals. Some of them, after being released into the atmosphere, can rise into the stratosphere, where they break apart, releasing chlorine or bromine atoms, which can destroy ozone molecules. Though the physical volume of emissions of ozone-depleting substances has never been very large in comparison to other anthropogenic emissions to the atmosphere, the risks associated with potential impacts are enormous. Fortunately, the response to this problem has been a success story.
Sectors and technology
Transport
 Fig 2.4 Number of passenger cars, by region.[17]
 The relatively high growth in passenger car sales reveals that people put a high preference on car ownership as they become more affluent (see Figure 2.4). Moreover, there has been a shift to heavier cars, equipped with an increasing number of energy demanding features (for example air conditioning and power windows), which add to a greater than expected growth in energy use by the transport sector.
Atmospheric emissions from the transport sector depend upon several factors, such as vehicle fleet size, age, technology, fuel quality, vehicle kilometres travelled and driving modes. The low fleet turnover rate, especially for diesel-powered vehicles, and the export of older vehicles from rich to poor countries, slows progress in curbing emissions in developing countries. In some parts of Asia, a majority of road vehicles consist of two- and three-wheelers powered by small engines. They provide mobility for millions of families. Although inexpensive, and with lower fuel consumption than cars or light trucks on a per vehicle basis, they contribute disproportionately to particulate, hydrocarbon and carbon monoxide emissions[18].
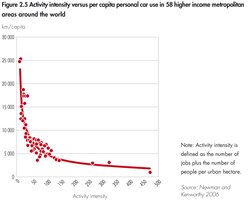 Fig 2.5 Activity intensity versus per capita personal car use in 58 higher income metropolitan areas around the world.[19]
 Shifting from public transport systems to private car use increases congestion and atmospheric emissions. Poor urban land-use planning, which leads to high levels of urban sprawl (spreading the urban population over a larger area), results in more car travel (see Figure 2.5) and higher energy consumption. The lack of adequate infrastructure for walking and cycling, which are the most environmentally-friendly transport modes, also contributes to increased vehicle use. Figure 2.6 shows the relative space required to accommodate people driving cars, using buses or cycling, with clear implications for transport strategy and planning.
Air transport is one the fastest rising transport modes, with an 80 per cent increase in kilometres flown between 1990 and 2003[20]. This dramatic increase was driven by growing affluence, more airports, the rise in low-cost airlines and the promotion of overseas tourism. Economic efficiency is driving improvements in energy efficiency, and new commercial aircraft are claimed to use up to 20 percent less fuel than those sold 10 years ago[21]. Shipping has also grown remarkably since Brundtland, mirroring the increase in global trade. It has risen from 4 billion tonnes in 1990 to 7.1 billion tonnes total goods loaded in 2005[22]. Improvements in the environmental performance of the shipping industry have been less pronounced than for air transport.
Industry
The shift in the regional character of industrial production, which has decreased in developed countries and increased in the developing world, can be illustrated by the changes in secondary energy use by the industrial sector. In the United States, increased energy use in the transport and service sectors has been partially counterbalanced by the decrease (0.48 tonne oil equivalent/capita) in the industrial sector. In contrast, in Asia and the Pacific, and Latin America and the Caribbean, there has been an increase in per capita energy use in all sectors[23].
Atmospheric emissions from large stationary sources in developed countries have been reduced by using cleaner fuels, end-of-pipe controls, relocating or shutting down high-emitting sources and promoting more efficient energy use. In many developing countries such measures have not been fully implemented, but have the potential to rapidly reduce emissions. If 20 percent of energy was saved in existing energy generation and industrial facilities in developing countries through use of currently available technologies, the increase in CO2 emissions from developing countries from 2000 to 2020 would only be about half of what it otherwise be[24]. Industrial sources that use obsolete technology, lack emission controls and are not subject to effective enforcement measures, contribute significantly to the emission load. In general, the implementation of governmental regulations has stimulated the use of technologies that often reduce costs, and result in greater benefits than originally foreseen.
Emissions from small factories and commercial sources are much more difficult to control. Enforcement of compliance with emission standards is politically difficult and expensive. Technology solutions are more challenging, and there is no simple way to check that best management practices are being used.
Energy
In the industrialized world, large power plants are confronted with increasingly tight environmental standards. A wide range of options for the production of clean energy exists, and has started to penetrate the market, often stimulated by government subsidies. High growth rates in clean energy options since 1987 have been observed, especially for solar and wind energy. Energy supply from wind power increased 15 times by 2004, with an average growth of approximately 30 percent per year, although its share in global electricity supply is still very small at about 0.5 percent in 2004[25].
Energy efficiency improvements and energy conservation are given high priority in the energy development strategies of many countries, including developing countries. High efficiency and clean technology will be crucial to achieve a low-emission development path, combined with security of supply. Among the factors that define the level of emissions are fuel quality, technology, emission control measures, and operation and maintenance practices. Energy security considerations and fuel costs often determine the choice of fuels, such as coal and nuclear (see Chapter 7 (Global Environment Outlook (GEO-4): Chapter 2)). Thermal power plants burning coal are major air pollution sources, and emit higher levels of many pollutants than gas-fired power plants to produce the same amount of energy. Clean energy sources, such as geothermal, wind energy and solar power, are still underutilized. With the recent high oil prices, more efficient power plants have become more cost-effective, but still require substantial investment in infrastructure. Many countries in, for example, sub-Saharan Africa, cannot cope with the rising energy demand, and continue to rely on obsolete, low-efficiency power plants that emit high levels of pollutants.
Land-use practices
In rural areas, customary land-use practices also drive atmospheric emissions. The clearance of forested land, and its subsequent use for cattle and crop production, releases carbon stored in the trees and soils, and depletes its potential as a CO2 sink (see Chapter 3 (Global Environment Outlook (GEO-4): Chapter 2)). It may also increase methane, ammonia and nitrogen oxide emissions. Deforestation is known to contribute as much as 20–25 percent to annual atmospheric emissions of CO2[26]. Normal agricultural land-use practices, such as burning crop residues and other intentional fires, increase emissions of CO2, particulate matter and other pollutants[27]. Wildfires and forest fires used for land clearance also release very high levels of particulates. The Southeast Asian haze of 1997, produced by land clearance, cost the people of that region an estimated US$1.4 billion, mostly in short-term health costs[28]. Since 1987, there has been little progress in mitigating these unwanted effects. Fine dust particles from the ground are also a major concern in arid or semi-arid areas subject to seasonal or periodic high winds.
Urban settlements
Emissions in densely populated areas tend to be higher due to the total level of emission-related activity, even though the per capita emissions are reduced by higher efficiency and shorter travel distances using personal transport (see Figure 2.5). In combination with low dispersion conditions, this results in exposure of large populations to poor air quality. Urbanization, seen in such forms as urban population growth in Latin America, Asia and Africa, and urban sprawl in North America and Europe, is continuing as a result of a combination of social and economic drivers. Urban areas concentrate energy demands for transport, heating, cooking, air conditioning, lighting and housing. Despite the obvious opportunities that cities offer, such as their economic and cultural benefits, they are often associated with problems that are aggravated by large increases in population and limited financial means, which force city authorities to accept unsustainable short-term solutions. For example, there is pressure to use land reserved as green areas and for future public transport systems for houses, offices, industrial complexes or other uses with a high economic value. Moreover, cities create heat islands that alter regional meteorological conditions and affect atmospheric chemistry and climate. Reversing the trend of unsustainable development is a challenge for many city authorities.
Technological innovation
Technological innovation, coupled with technology transfer and deployment, is essential for reducing emissions. A broad portfolio of technologies is necessary, as no single technology will be adequate to achieve the desired level of emissions. Desulphurization technologies, low nitrogen combustors and end-of pipe particulate capture devices are examples of technologies that have contributed considerably to SO2, NOX and PM emission reduction. A number of technologies may play key roles in reducing GHG emissions. They include those for improved energy efficiency, renewable energy, integrated gasification combined cycle (IGCC), clean coal, nuclear and carbon sequestration[29].
A “technology push” approach, based on large-scale research and technology deployment programmes and new breakthrough technologies, is needed to achieve deeper GHG emission cuts in the long run (2050 and beyond).
In addition to government and private sector investment in technology research and development, regulations for energy, environment and health are key drivers for stimulating the deployment of cleaner technologies in developing countries. It is also important to lower the risk of locking in more CO2-intensive energy technologies in developing countries.
Environmental Trends and Responses
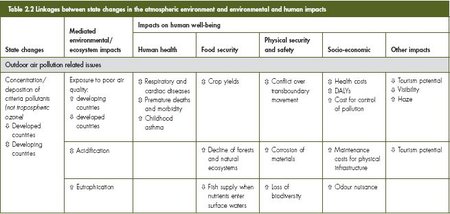
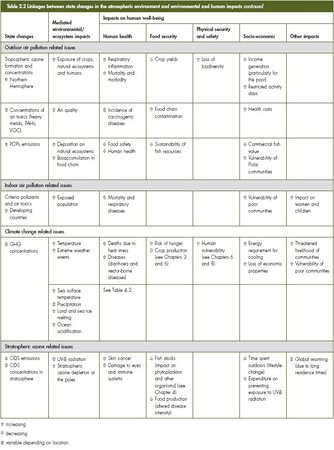
In this chapter, three major atmosphere-related environmental issues are analysed in detail: air pollution, climate change and stratospheric ozone depletion. For each issue the changes in the environmental state are related to the impacts on both the environment and on human well-being for the period since 1987. This is followed by descriptions of what has been done to curb emissions. Table 2.2 below summarizes the interconnections between changes in the atmosphere (Atmospheric composition and structure) and human well-being, including changes in state of the atmosphere, the mechanisms through which impacts occur and changes in well-being over time.
Air Pollution
 Fig 2.7 Premature deaths due to outdoor urban PM10 exposure by region in 2000.[30]
 Human and environmental exposure to air pollution is a major challenge, and an issue of global concern for public health. The World Health Organization (WHO) estimated that about 2.4 million people die prematurely every year due to fine particles[31]. This includes about 800,000 deaths due to outdoor urban PM10 (see Box 2.3 for an explanation), and 1.6 million due to indoor PM10, even though the study did not include all mortality causes likely to be related to air pollution. Figure 2.7 shows the annual mortality that is attributable to outdoor PM10 for different world [[region]s]. The highest number of estimated annual premature deaths occurs in developing countries of Asia and the Pacific[32].
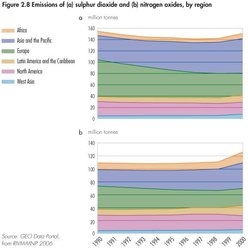 Fig 2.8 Emissions of (a) sulphur dioxide and (b) nitrogen oxides, by region.[33]
 Beside effects on human health, air pollution has adverse impacts on crop yields, forest growth, ecosystem structure and function, materials and visibility. Once released into the atmosphere, air pollutants can be carried by winds, mix with other pollutants, undergo chemical transformations and eventually be deposited on various surfaces (see Box 2.3).
Atmospheric emissions and air pollution trends
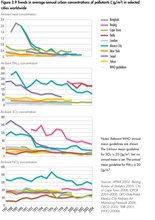 Fig 2.9 Trends in average annual urban concentrations of pollutants [g/m3] in selected cities Worldwide.[34]
 Emissions in the various [[region]s] show different trends for SO2 and NOx (see Figure 2.8). There have been decreases in the national emissions in the more affluent countries of Europe and North America since 1987. More recently Europe is as concerned with unregulated sulphur emissions from international shipping as it is with the regulated land-based sources[35]. For the industrializing nations of Asia, emissions have increased, sometimes dramatically, over the last two decades. There are no aggregate data for regions after 2000, and therefore recent changes in emissions of developing countries are not displayed, especially in Asia. For instance, from 2000 to 2005 the Chinese SO2 emissions increased by approximately 28 per cent[36], and satellite data suggest that NOX emissions in China have grown by 50 per cent between 1996 and 2003[37]. The main result is that global emissions of SO2 and NOX are increasing with respect to 1990 levels. In Africa, and in Latin America and the Caribbean, small increases have been reported.
In many large cities in developing countries, current air pollution concentrations are very high, especially for PM10 (see Figures 2.9 and 2.10). However, pollutant levels are decreasing, usually because of controls on emission sources, changing fuel use patterns, and closures of obsolete industrial facilities. For lead, the trends are decreasing, and ambient levels in most cities are currently below the WHO guideline[38]. In general, PM10 and SO2 levels have been decreasing, although levels of PM10 are still many times higher than the WHO guideline in many developing countries, and SO2 levels are above the WHO guideline in a number of cities and differences are considerable in different regions. Most large cities exceed the WHO guideline for NO2, and the levels are not showing any significant decreases.
|
Box 2.3 Features of different air pollutants [39] |
|
Six common pollutants – suspended particulate matter (SPM), sulphur dioxide (SO2), nitrogen dioxide (NO2), carbon monoxide (CO), tropospheric ozone (O3) and lead (Pb) – harm human health, and are used as indicators of air quality by regulatory agencies. They are known as criteria pollutants, for which health-based ambient air quality guidelines have been recommended by WHO. PM is distinguished as different inhalable fractions that are classified as coarse and fine particulates with aerodynamic diameters below 10 ?m (PM10) and 2.5 ?m (PM2.5) respectively. Air pollutants may be considered primary – emitted directly into the air – or secondary pollutants that are formed in the air by chemical and/or photochemical reactions on primary pollutants. The formation of secondary pollutants, such as tropospheric ozone and secondary aerosols, from primary pollutants such as SO2, NOX, NH3 and volatile organic compounds (VOCs) is strongly dependent on climate and atmospheric composition. Due to atmospheric transport, their impacts can occur far from their sources. The major chemical components of PM are sulphate, nitrate, ammonium, organic carbon, elemental carbon and soil dust (consisting of several mineral elements). Other important primary pollutants include heavy metals, such as mercury, cadmium and arsenic; VOCs, such as benzene, toluene, ethylbenzene and xylenes; polycyclic aromatic hydrocarbons (PAHs); and some persistent organic pollutants (POPs), such as dioxins and furans. These air pollutants result from the burning of fossil fuels, biomass and solid waste. Ammonia (NH3) is emitted primarily from agricultural sources. |
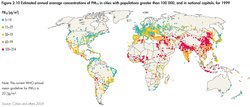 Fig 2.10 Estimated average concentration of PM10 in cities with populations greater than 100,000, and in national capitals, for 1999.[40]
 Modelling indicates the highest levels of tropospheric ozone – a major component of photochemical smog – are in a subtropical belt that includes southeastern parts of North America, southern Europe, northern Africa, the Arabian Peninsula, and the southern and northeastern parts of Asia (see Figure 2.11). However, there is currently a lack of rural measurements in Asia, Africa and Latin America that could validate these results. There is a trend of rising annual mean tropospheric ozone concentrations across the northern hemisphere[41] that implies that several regions may need to cooperate to address the problem.
In addition, clouds of tiny aerosol particles from emissions hang over a number of regions (known as Atmospheric Brown Clouds). These seasonal layers of haze reduce the amount of sunlight that can reach the Earth’s surface, which has potential direct and indirect impacts on the water cycle, agriculture and human health[42]. The aerosols and other particulate air pollutants in the atmosphere absorb solar energy and reflect sunlight back into space[43].
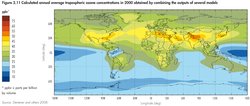 Fig 2.11 Calculated annual average troposheric ozone concentrations in 2000 obtained by combining the outputs of several models.[44]
 Effects of air pollution
Air pollution is one of the major environmental factors causing adverse impacts on human health, crops, ecosystems and materials, with priorities varying among regions (see Box 2.4). Both indoor and outdoor air pollution are associated with a broad range of acute and chronic impacts on health, with the specific type of the impact depending on the characteristics of the pollutant. The developing nations of northeast, southeast and southern Asia are estimated to suffer about two-thirds of the world’s premature deaths due to indoor and outdoor air pollution[45].
The most important air pollutant from a disease perspective is fine particulate matter. WHO estimated that particulates (see Box 2.5) in urban areas worldwide cause about 2 per cent of mortality from cardiopulmonary disease in adults, 5 per cent of mortality from cancers of the trachea, bronchus and lung, and about 1 per cent of mortality from acute respiratory infections in children, amounting to about 1 per cent of premature deaths in the world each year[46]. In addition, the WHO estimated that indoor smoke from solid fuel causes about one-third of lower respiratory infections, about one-fifth of chronic obstructive pulmonary disease, and approximately 1 per cent of cancers of the trachea, bronchus and lung[47]. Figure 2.12 presents global estimates of the burden of disease attributable to indoor and urban PM10 pollution.
|
Box 2.4 Key air pollution issues differ around the world |
|
(See graphs presented throughout this chapter and [[Chapter 6 (Global Environment Outlook (GEO-4): Chapter 2)]2] for details) Africa, Asia and the Pacific, Latin America and the Caribbean and West Asia
Europe and North America
|
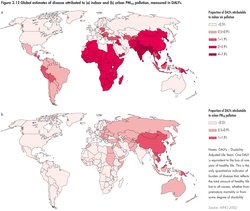 Fig 2.12 Global estimates of disease attributed to (a) Indoor and (b) urban PM10 pollution, measured in DALYs.[48]
 The health impacts of air pollution are closely linked with poverty and gender issues. Women in poor families bear a disproportionate burden of the impacts of air pollution due to their greater exposure to smoke from poor quality fuel for cooking. In general, the poor are more exposed to air pollution due to the location of their residences and workplaces, and their increased susceptibility due to such factors as poor nutrition and medical care[49].
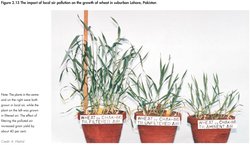
Air pollution also adversely affects agriculture. Measurable, regional-scale impacts on crop yields caused by tropospheric ozone have been estimated to cause economic losses for 23 arable crops in Europe in the range US$5.72–12 billion/year[50]. There is evidence of significant adverse effects on staple crops in some developing countries, such as India, Pakistan and China, which are now starting to deal with this issue[51] (see also the example in Figure 2.13).
In 1987 the regional impacts of acid rain caused by sulphur and nitrogen deposition were of major importance in Europe and North America, causing lake acidification and forest decline, mainly due to soil acidification. More recently, such declines have also been documented in Mexico and China, and are probably occurring in many other countries[52]. There is recent evidence that emission controls led to a reversal of freshwater (Freshwater biomes) acidification[53], and the dire warnings related to widespread forest decline across Europe and North America at the time of the Brundtland Commission have not materialized. There is now a risk of acidification in other areas of the world, particularly Asia[54] (see Chapter 3 and 6 (Global Environment Outlook (GEO-4): Chapter 2)).
| Box 2.5 The health impacts of fine particles[55] |
|
The health impacts of particles depend considerably on their physical and chemical characteristics. Particle size is important, as this influences how easily and deeply the particles get into the lungs. The ability of the body to protect itself against inhaled particles, and the susceptibility of individuals to particles are closely linked with particle size and chemical composition. Particles larger than 10 ?m in diameter generally do not penetrate into the lungs, and have a short residence time in the atmosphere (Atmospheric composition and structure). As a consequence, epidemiological evidence generally links PM10 and PM2.5 particles with adverse effects on health. There has been more interest recently in ultrafine particles (those having a diameter less than 0.1 ?m), because poorly soluble ultrafine particles can move from the lung to the blood, and then to other parts of the body. Scientists know that chemical composition and size of particles are often linked to health effects, and that particle number and surface area are also important factors in assessing the health effects of particles. However, there is little detailed understanding yet of the specific chemical components of particles responsible for adverse health outcomes. |
Over recent decades the eutrophying effect of nitrogen deposition has also caused significant loss of biodiversity in some sensitive, nutrient limited ecosystems, such as heaths, bogs and mires in northern Europe and North America[56]. Nitrogen deposition has been recognized within the Convention on Biological Diversity as a significant driver of species loss. Several major global biodiversity hot spots have been identified as being at significant risk because of nitrogen deposition[57] (see Chapters 4, 5 and 6 (Global Environment Outlook (GEO-4): Chapter 2)).
The built environment is affected by air pollution in several ways. Soot particles and dust from transport are deposited on monuments and buildings, SO2 and acid deposition induces corrosion of stone and metal structures and ozone attacks many synthetic materials, decreasing their useful life, and degrading their appearance. All these effects impose significant costs for maintenance and replacement. In addition, fine particles in urban environments typically reduce visibility by one order of magnitude[58].
Persistent organic pollutants (POPs) and mercury have emerged as important issues since 1987. These toxic substances become volatile when emitted to the environment, and can then be transported over long distances. When pollutants are persistent, concentrations will build up in the environment, causing a risk of bioaccumulation in food chains. Many POPs are now found around the globe, even far from their sources. In the Arctic environment, harmful health effects have been observed in northern wildlife, and the pollution threatens the integrity of traditional food systems and the health of indigenous peoples (see [[Chapter 6 (Global Environment Outlook (GEO-4): Chapter 2)]3]).
Managing air pollution
Progress in managing air pollution presents a mixed picture. Urban air pollution remains a critical issue, affecting people’s health in many developing countries, although progress is evident in high-income countries. Some regional air pollution issues, such as acid rain, have been successfully addressed in Europe, but they pose a threat in parts of Asia. Tropospheric ozone has emerged as a particularly intractable problem, mainly in the northern hemisphere, where it affects crops and health. Burning biomass fuels indoors in developing regions imposes an enormous health burden on poor families, especially women and young children. Action in developing countries has been inadequate to date, but there remains an opportunity to improve health and reduce premature mortality.
The considerable progress that has been made in preventing and controlling air pollution in many parts of the world has been achieved largely through command-and-control measures, both at the national and regional levels. At the national level, many countries have clean air legislation that set emission and ambient air quality standards to protect public health and the environment. At the regional level, examples include the Convention on Long-Range Transboundary Air Pollution[59], the Canada-U.S. Air Quality Agreement[60] and European Union legislation[61]. Other emerging regional intergovernmental agreements include the ASEAN Haze Agreement [62], the Malé Declaration on the Control and Prevention of Air Pollution in South Asia[63], and the Air Pollution Information Network for Africa (APINA), a regional science-policy network. At the global level, the Stockholm Convention on Persistent Organic Pollutants[64] regulates the use and emission of certain pollutants (POPs). Although the Brundtland Commission highlighted the issue of mercury in the environment, no global agreement to limit mercury contamination has been reached. There has been a global mercury programme operational since 2001, and changes in technology and the use of alternative compounds seem to have reduced emissions[65].
Transport emissions
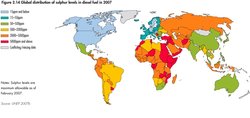 Fig 2.14 Global distribution of sulphur levels in diesel fuel in 2007.[66]
 Fuel and vehicle technologies have improved substantially during the last two decades, driven both by technological and legislative developments. Vehicle emissions have been partially controlled by the removal of lead from gasoline, requirements for catalytic converters, improved evaporative emission controls, fuel improvements, on-board diagnostic systems and other measures. Diesel vehicle emissions have been reduced by improved engine design and, for some vehicles, particle traps. Widespread use of particle traps will await reductions of sulphur in diesel fuel to below 15 ppm. Current diesel fuel sulphur levels differ considerably among regions (see Figure 2.14). Reducing sulphur in gasoline to low levels enables use of more effective catalytic converters, thus leading to improved emission control. Hybrid gasoline-electric vehicles, which tend to be more fuel efficient in urban traffic than gasoline-only vehicles, have been introduced in many developed countries, but their use is still very limited.
Most developed countries have made substantial progress in reducing per vehicle emissions, and many middle-income countries have implemented significant measures to control vehicle emissions. In addition to improved vehicle technologies, effective vehicle inspection and maintenance programmes have helped to control vehicle emissions and enforce emission standards[67]. However, progress in some low-income countries has been slow. Developing countries will not achieve benefits of advanced emission control technologies unless they implement cleaner fuel options.
In some Asian countries motorized two- and three-wheeled vehicles contribute disproportionately to emissions. However, regulations in some nations are reducing emissions from these vehicles. The shift from two-cycle to four-cycle engines, and the introduction of emission standards that effectively ban the sale of new vehicles powered by two-cycle engines will, in time, lead to a significant improvement in vehicle emissions[68].
Mass transport is an important alternative to private vehicles, and has been successfully implemented in many cities by using light rail, underground and rapid bus transit systems[69]. Fuel switching from diesel to compressed natural gas has been implemented for public transport vehicles in cities such as Delhi and Cairo, leading to reductions in emissions of particulate matter and SO2. In many countries, widespread use of mass transport continues to be hampered, however, by inefficiency and negative perceptions.
Industrial and energy sector emissions
In many developed countries emissions from large industrial sources have been controlled by fuel changes and emission control laws. The reduction of SO2 emissions in Europe and North America has been one of the success stories of recent decades. Agreements such as the 1979 UNECE Convention on Long-Range Transboundary Air Pollution played an important role in this success. The ECE convention adopted the concept of critical loads (thresholds in the environment) in 1988 and, in 1999, the Gothenburg Protocol set targets for national emissions of SO2, NOX, NHx and VOCs. In Europe, SO2 has been reduced considerably, partly due to these agreements. It is also the result of policies calling for cleaner fuels, flue gas desulphurization and new industrial processes. Emissions also fell as the result because of the demise of many heavy industries, particularly in Eastern Europe and the former Soviet Union. However, SO2 emissions have increased in many developing country [[region]s].
Stricter environmental regulation and economic instruments, such as emissions trading, have triggered the introduction of cleaner technologies, and promoted further technological innovation.
Economic policies send important signals to producers and consumers. For example, Europe is shifting from taxing labour to taxing energy use to better reflect the impacts of emissions[70]. Other successful examples include cap-and-trade policies in the United States to reduce SO2 emissions from power plants[71]. International use of such economic instruments is growing[72]. Many cleaner technologies and cleaner production options are mature and commercially available, but there is great need for global cooperation regarding technology transfer to make them more widely available.
Indoor air quality
With some 1.6 million people dying prematurely each year from exposure to polluted indoor air [73], many developing countries in Africa, Asia and Latin America have attempted to address the emissions from the burning of biomass fuels and coal indoors. Responses include providing households with improved stoves, cleaner fuels, such as electricity, gas and kerosene, and information and education to make people aware of the impacts of smoke on the health of those exposed, especially women and young children. A modest shift from solid biomass fuels, such as wood, dung and agricultural residues, to cleaner fuels has been achieved, and governments have supported such measures, but further progress along such lines is urgently necessary if any major advances are to be realized[74].
Climate Change
The trend of global warming is virtually certain, with 11 of the last 12 years (1995–2006) ranking among the 12 warmest years since 1850, from which time there has been systematic temperature keeping[75]. The evidence of this warming includes a number of shrinking mountain glaciers[76], thawing permafrost[77], earlier breakup of river and lake ice, lengthening of mid- to high-latitude growing seasons, shifts of plant, insect and animal ranges, earlier tree flowering, insect emergence and egg laying in birds[78], changes in precipitation (Global distribution of precipitation) patterns and ocean currents[79], and, possibly, increasing intensity and lifetimes of tropical storms in some regions[80].
Poor communities are most directly dependent for their livelihoods on a stable and hospitable climate. In developing countries the poor, often relying on rain-fed subsistence agriculture and gathered natural resources, are deeply dependent on climate patterns, such as the monsoons, and are most vulnerable to the devastation of extreme weather events, such as hurricanes. Vulnerable communities already suffer from climate variability, for example due to increasing frequency of droughts in Africa[81] and, as was demonstrated by the effects of Hurricane Katrina in 2005, and by the European heat wave of 2003, it is the poor or vulnerable who suffer most from weather extremes, even within relatively affluent societies.
While the Earth’s climate has varied throughout the prehistoric ages, the last few decades have witnessed a global climate disruption that is unprecedented over the recent millennia, a period of relative climatic stability during which civilization emerged[82]. Some [[region]s], particularly the Arctic, will be more affected by climate change than others closer to the equator (see Polar Regions section of [[Chapter 6 (Global Environment Outlook (GEO-4): Chapter 2)]4]). In many regions, the agricultural sector will be particularly affected. The combination of high [[temperature]s] and decreased soil moisture projected for parts of Africa will be particularly hard to adapt to. With the majority of the world’s population struggling to meet basic development needs, such as those identified in the Millennium Development Goals, humanity can ill afford this additional burden of climate change impacts[83].
Greenhouse gas concentrations and anthropogenic warming
 Fig 2.15 Atmospheric concentrations of CO2 over the last 10 000 years.[84]
 The greatest direct human pressure on the climate system arises from the emission of [[greenhouse gas]es], chief of which is CO2, mainly originating from fossil fuel consumption. Since the dawn of the industrial age, the concentrations of these gases have been steadily increasing in the atmosphere (Atmospheric composition and structure). Figure 2.15 shows the atmospheric concentration of CO2 over the past 10,000 years. The unprecedented recent rise has resulted in a current level of 380 parts per million, much higher than the pre-industrial (18th century) level of 280 ppm. Since 1987, annual global emissions of CO2 from fossil fuel combustion have risen by about one-third (see Figure 2.16), and the present per capita emissions clearly illustrate large differences among regions (see Figure 2.17).
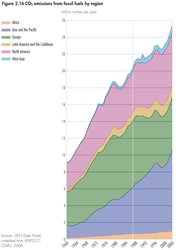 Fig 2.16 CO2 emissions from fossil fuels by region.[85]
 There has also been a sharp rise in the amount of methane, another major greenhouse gas, with an atmospheric level 150 per cent above that of the 19th century[86]. Examination of ice cores has revealed that levels of CO2 and methane are now far outside their ranges of natural variability over the preceding 500,000 years[87].
There are other atmospheric pollutants that affect the planet’s heat balance. They include industrial gases, such as sulphur hexafluoride, hydrofluorocarbons and perfluorocarbons; several ozone-depleting gases that are regulated under the Montreal Protocol; tropospheric ozone; nitrous oxide; particulates; and sulphur- and carbon-based aerosols from burning fossil fuels and biomass. Elemental carbon aerosols (soot or “black carbon”) contribute to global warming by absorbing short-wave radiation, while also contributing to local air pollution. Removing such pollutants will be beneficial both with respect to climate change and health effects. Sulphur-based aerosol pollutants, on the other hand, cool the planet through their influence on the formation of clouds, and by scattering incoming sunlight, and are thus currently “shielding” the planet from the full warming effect of greenhouse gas emissions[88]. In the future, the policy measures needed to reduce public health problems and local environmental impacts associated with sulphur-based pollutants will weaken this unintended but fortunate shielding.
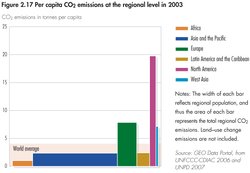 Fig 2.17 per capita CO2 emissions at the regional level in 2003.[89]
 The Earth’s surface temperature has increased by approximately 0.74°C since 1906, and there is very high confidence among scientists that the globally averaged net effect of human activities since 1750 has been one of warming[90]. The warming of the last few decades is exceptionally rapid in comparison to the changes in climate during the past two millennia. It is very likely that the present temperature has not been exceeded during this period. Earlier discrepancies between surface temperature measurements and satellite measurements have been largely resolved[91]. Model calculations including both natural and anthropogenic drivers give quite good agreement with the observed changes since the beginning of the industrial age (see Figure 2.18). Most of the warming over the last century has occurred in recent decades, and this more rapid warming cannot be accounted for by changes in solar radiation or any other effects related to the sun that have been examined[92].
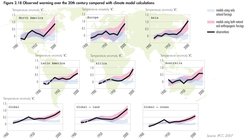 Fig 2.18 Observed warming over the 20th century compared with climate model calculations. [93]
 The climate system possesses intrinsic positive and negative feedback mechanisms that are generally beyond society’s control. The net effect of warming is a strong positive feedback[94], with several processes within the Earth’s complex climate system (see Figure 2.19 for the stocks and flows of carbon on a global scale) acting to accelerate warming once it starts (see Box 2.6 below). The magnitude of such feedbacks is the subject of intense study. What is known is that the Earth’s climate has entered a state that has no parallel in the recent prehistory. The cumulative result of these feedbacks will be far greater than the “direct” warming caused by the increase in greenhouse gas emissions alone.
Effects of climate change
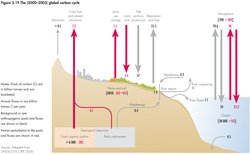 Fig 2.19 The [2000-2005] global carbon cycle.[95]
 Spells of very high [[temperature]s] appear to be increasing as global temperatures increase. A notable recent case is the exceptional heat wave experienced in much of Europe in the summer of 2003, with over 30,000 estimated premature deaths from heat stress and associated air pollution[96]. In the Arctic, average temperatures are rising almost twice as rapidly as in the rest of the world. Widespread melting of glaciers and sea ice, and rising permafrost temperatures present further evidence of strong Arctic warming. Since 1979, satellite observation has allowed scientists to carefully track the extent of seasonal melting of the surface of the Greenland Ice Sheet (see Figure 2.20). There is now also evidence of widespread melting of permafrost, both in Alaska and Siberia, which is expected to increase the release of methane from frozen hydrates, giving rise to a significant positive feedback (see Box 2. 6 above and the Polar Regions section in [[Chapter 6 (Global Environment Outlook (GEO-4): Chapter 2)]5]). This phenomenon has a precedent, as a vast amount of methane was emitted some 55 million years ago, and was associated with a temperature increase of 5–7°C[97]. It took approximately 140,000 years from the start of the emission period to return to a “normal” situation. Trends in global patterns[98] reveal increased variance in precipitation everywhere: wet areas are becoming wetter, and dry and arid areas are becoming dryer. It is notable that the regions with the lowest contribution to anthropogenic GHG emissions, such as Africa, are those projected to be most vulnerable to their negative consequences, especially in the form of water stress[99] (see Chapters 4 and 6 (Global Environment Outlook (GEO-4): Chapter 2)).
|
Box 2.6 Positive feedbacks in the Earth system[100] |
|
A first important positive feedback is the increase in the amount of water vapour in the atmosphere that will result from higher air and ocean temperatures. The ability of air to hold moisture increases exponentially with temperature, so a warming atmosphere will contain more water vapour, which in turn will enhance the greenhouse effect. Recent observations confirm that the atmosphere water vapour concentration increases with a warming planet. Another important feedback is the loss of snow and sea ice that results from rising [[temperature]s], exposing land and sea areas that are less reflective, and hence more effective at absorbing the sun’s heat. Over the last few decades, there is a documented decline in alpine glaciers, Himalayan glaciers and Arctic sea ice, (see Chapters 3 and 6 (Global Environment Outlook (GEO-4): Chapter 2)). A third feedback is the melting of permafrost in boreal [[region]s], resulting in the release of methane, a potent greenhouse gas, and CO2 from soil organic matter. Recent studies in Siberia, North America and elsewhere have documented the melting of permafrost. A fourth important feedback is the release of carbon from ecosystems due to changing climatic conditions. The dieback of high-carbon ecosystems, such as the Amazon, due to changes in regional precipitation patterns, has been predicted from some models, but it has not yet been observed. Laboratory studies have indicated accelerated decomposition of soil organic matter in temperate [[forest]s] and grasslands due to temperature and precipitation changes, or the CO2-induced enhancement of decomposition by mycorrhizae. |
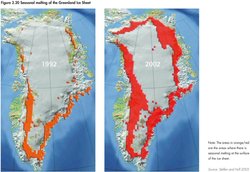 Fig 2.20 Seasonal melting of the Greenland Ice Sheet.[101]
 There is observational evidence for an increase of intense tropical cyclone activity in the North Atlantic since about 1970, correlated with increases in tropical sea surface temperatures. There are also suggestions of more intense tropical cyclone activity in some other regions, where concerns over data quality are greater[102]. The number of the most intense tropical storms (Class 4 and 5) has nearly doubled over the past 35 years, increasing in every ocean basin. This is consistent with model results that suggest this trend will continue in a warming world[103]. If correct, this would suggest an increasing frequency in the future of devastatingly intense hurricanes, such as Katrina (in 2005) and Mitch (in 1998), and cyclones such as the super cyclone of Orissa in India in 1999. However, there has been recent controversy over these conclusions[104], and the IPCC and WMO suggest that more research is necessary[105].
It is believed that the 20th century’s anthropogenic greenhouse gas emissions, which are blamed for most of the warming up to now, have also committed the Earth to an additional 0.1°C of warming per decade that is “in the pipeline,” owing to the climate system’s inertia. Some warming would have occurred even if the concentrations of all greenhouse gases and aerosols in the atmosphere had been kept constant at year 2000 levels, in which case the estimated increase would be 0.3–0.9°C by the end of this century. The actual temperature change will depend critically on choices that society makes regarding the reduction in greenhouse gas emissions. The potential future scenarios span a wide range. The increase in the global mean temperature by 2090–99 is estimated to be 1.8–4.0°C, relative to 1980–99[106]. This is the best estimate, drawing on six emissions marker scenarios, while the likely range is 1.1–6.4°C. If CO2 concentrations in the atmosphere (Atmospheric composition and structure) double, the global average surface warming would likely be in the range 2–4.5°C, with the best estimate of about 3°C above pre-industrial levels, although values substantially higher than 4.5°C cannot be excluded[107]. These figures are for global averages, while the predicted temperature increases will be greater in some regions.
 Fig 2.21 Time scale and sea-level rise.[108]
 Sea-level rise is caused by thermal expansion of water, and melting of glaciers and ice sheets. Projections by IPCC[109] for a rise by the end of this century, corresponding to those for temperature changes described above, range from 0.18–0.59 m. It is important to note that possible future rapid dynamic changes in ice flow are not included in these estimates. (The majority of the impact will, however, be post-2100 (see Figure 2.21). It is estimated that the Greenland Ice Sheet will become unstable if the global average temperature increases above 3°C, which may well occur in this century[110]. The melting would raise sea levels by about 7 metres over the next 1 000 years. However, the mechanisms involved in melting of ice sheets are not well understood, and some scientists argue that melting may be much quicker due to dynamic process not yet incorporated in model predictions (such as Hansen 2005[111]). Research is continuing to evaluate the further potential impacts on sea levels from the West Antarctic Ice Sheet[112]. There are a number of small island states whose very existence is already being threatened by sea-level rise associated with climate change[113].
The future [[temperature]s] in northern Europe are dependent on the fate of the North Atlantic Current (Gulf Stream) that transports warm water to the Norwegian Sea, and further northwards. Model predictions vary, but in general forecast a weakening, but no total shutdown in this century[114]. A significant shift could greatly affect regional weather patterns, with major ramifications for ecosystems and human activities (see Chapter 4 and Chapter 6 (Global Environment Outlook (GEO-4): Chapter 2), Polar Regions).
Over the past 200 years the oceans have absorbed nearly half the CO2 produced by human activities. One effect has been to produce carbonic acid, thus increasing acidity and lowering the pH of surface seawater by 0.1 pH unit. Projections based on different emission scenarios give additional reductions in average global surface ocean pH of between 0.14 and 0.35 units by the year 2100[115]. This seawater acidity is probably higher than has been experienced for hundreds of millennia, and there is convincing evidence that such acidification will impair the process of calcification by which animals, such as corals and molluscs, make their shells from calcium carbonate[116].
Initially a slight warming, together with the fertilizing effects of more atmospheric CO2, may increase crop yields in some areas, but the negative effects are expected to dominate as warming increases[117]. Some sub-regions in Africa (see [[Chapter 6 (Global Environment Outlook (GEO-4): Chapter 2)]6]) are especially vulnerable, and studies warn that there may be an alarming increase in the risk of hunger [118].
Using projections of species distributions for future climate scenarios, Thomas and others[119] assessed extinction risks for 20 per cent of the Earth’s terrestrial surface. They estimated that a climate warming of 2°C by 2050 would cause 15–37 per cent of species and taxa in these regions to be “committed to extinction.” Certain extinctions have already been attributed to climate change, such as the loss of numerous species of Harlequin frog in mountainous parts of South America[120] (see [[Chapter 5 (Global Environment Outlook (GEO-4): Chapter 2)]2]).
Although higher CO2 levels promote photosynthesis, and may help to maintain rain forests in the next few decades, continued warming and drying could eventually lead to abrupt reductions in forest cover[121]. Some models predict a dramatic dieback of Amazonian rain forests, which will release CO2, and cause a positive feedback to climate change. In addition to adding considerably to global CO2 emissions, the loss of large tracts of the Amazon would radically transform the habitat, and threaten the livelihoods of local indigenous communities. Similarly, the melting of the permafrost will dramatically change the ecosystems and livelihoods in northern latitudes (see [[Chapter 6 (Global Environment Outlook (GEO-4): Chapter 2)]7]).
In 2000, climate change was estimated to be responsible for approximately 2.4 per cent of worldwide diarrhoea, and 6 per cent of malaria in some middle-income countries[122]. Diarrhoea and malaria are already devastating forces in developing countries, and the likelihood that they will be exacerbated by climate change is of significant concern. Continued warming is expected to cause shifts in the geographic range (latitude and altitude) and seasonality of certain infectious diseases, including vector-borne infections, such as malaria and dengue fever, and food-borne infections, such as salmonellosis, which peak in the warmer months. Some health impacts will be beneficial. For example, milder winters will reduce the winter peak in deaths that occurs in temperate countries. However, overall it is likely that negative health impacts of climate change will by far outweigh the positive ones. WHO and Patz and others give estimates of changes in morbidity and mortality due to changes in climate by the year 2000, compared with the baseline climate of 1961–1990[123]. They estimated there were 166,000 more deaths worldwide, mostly in Africa and some in Asian countries, and mainly from malnutrition, diarrhoea and malaria. The largest increase in the risks by 2025 will be from flooding, with more modest increases in diseases such as diarrhoea and malaria. The [[region]s] facing the greatest burden from climate sensitive diseases are also the regions with the lowest capacity to adapt to such new hazards.
Managing climate change
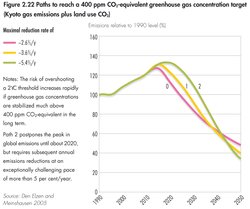 Fig 2.22 paths to reach a 400 ppm CO2- equivalent greenhouse gas concentration target (Kyoto gas emissions plus land use CO2).[124]
 Climate change is a major challenge to society’s existing policy making apparatus, as it presents a threat whose precise magnitude is unknown, but is potentially massive. The conventional cost-benefit framework is difficult to apply to climate policy. Not only are both the costs and impacts highly uncertain, but the cost-benefit analyses are critically sensitive to parameters, such as the choice of discount rate, which reflect the relative importance placed on climate damages suffered by future generations, and the temperature increase expected. There is no consensus on the best approach(es) to use in such cases, and they are inherently value laden[125].
The impacts of decisions made today will continue to emerge for decades or centuries. Faced with such a challenge, a precautionary approach seems inevitable. A minimal response would involve setting a threshold for intolerable impacts. Various scientists, analysts and policy making bodies have identified a 2°C increase in the global mean temperature above pre-industrial levels as a threshold beyond which climate impacts become significantly more severe, and the threat of major, irreversible damage more plausible. Some argue for an even lower threshold[126]. Hare and Meinshausen have concluded that staying under the 2°C threshold will require a very stringent GHG concentration goal, and the longer the delay in implementation, the steeper the reduction trajectory required (see path 2 in Figure 2.22)[127].
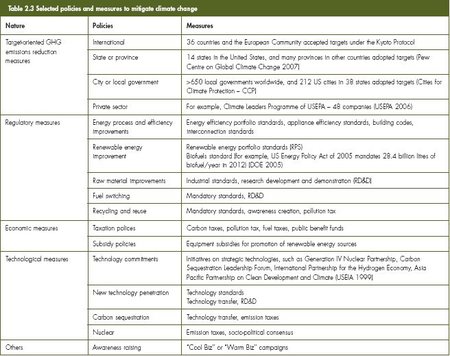
Governments worldwide, in cooperation with the private sector and the public, have been implementing various policies and measures to mitigate climate change (see Table 2.3). These actions comprise a crucial first wave of efforts to limit GHG emissions, and to ultimately achieve a transition away from carbon intensive economies. While there are many important actions to address climate change, such as carbon taxes and carbon trading in Europe, and the coming into force of the Kyoto Protocol, the net effect of current actions is woefully inadequate (see [[Chapter 6 (Global Environment Outlook (GEO-4): Chapter 2)]8]).
A comprehensive system of actions and measures, including public-private partnerships is required (see Chapter 10 (Global Environment Outlook (GEO-4): Chapter 2)). Achieving the required global emission reductions will clearly require a concerted global effort by both industrialized and developing countries. Even though per capita emissions in some rapidly industrializing developing countries are far lower than in industrialized countries, their emissions are rising as their economies grow, and their living standards rise.
Several technologically feasible options are available to address climate change in all countries, and many of them are economically competitive, especially when the co-benefits of increased energy security, reduced energy costs and lower impacts of air pollution on health are considered[128]. These include improvements in energy efficiency and a shift to low-carbon and renewable resources, such as solar, wind, biofuels and geothermal energy. Social changes that make less consumptive, less material-intensive lifestyles possible may also be necessary. Carbon capture and storage, for example by storing CO2 deep underground, and other technological options, such as nuclear energy, may play significant roles in the future, although some questions remain regarding widespread application of such options, such as public concerns and political debate over nuclear energy related to the future of used nuclear fuel, the risk of accidents, high costs and proliferation of nuclear weapons.
Recent studies show that measures to mitigate climate change do not necessarily imply exorbitant costs, and that total cost would remain a very small fraction of the global economy[129]. Azar and Schneider reported that the increase in the global economy expected over the coming century would not be compromised, even by the most stringent stabilization targets (350–550 ppm), and the point at which the global economy would reach its 2100 level of wealth, according to business-as-usual projections, would be delayed by only a few years[130]. DeCanio attributes the common perception of high mitigation costs to the fact that current modelling frameworks tend to be biased strongly towards overestimating costs[131].
Some impacts of climate change are inevitable in the coming decades due to the inertia of the climate system. Adaptation is necessary, even if major mitigation measures are rapidly implemented. Adaptation to climate change is defined as “adjustment in natural or human systems in response to actual or expected climatic stimuli or their effects, which moderates harm or exploits beneficial opportunities”[132]. Developing new varieties of crops that resist droughts and floods, and climate proofing infrastructure to cope with future impacts of climate change are a few examples. Adaptation is often site-specific, and must be designed on the basis of local circumstances. National and international policies and financial mechanisms are crucial to facilitate such efforts. However, weak institutional mechanisms, inadequate financial resources, insufficient research on adaptation and the failure to mainstream adaptation concerns in development planning have so far hampered progress on adaptation. Adaptation responses call for additional financial resources, and the polluter-pays-principle would in general imply that countries should provide resources in proportion to their contribution to climate change.
An extensive multilateral infrastructure exists to address climate change at the international level. The United Nations Framework Convention on Climate Change (UNFCCC) was signed in 1992 at the UN Earth Summit, and has been ratified by 191 counties. It encourages countries to work together to stabilize GHG emissions “at a level that would prevent dangerous anthropogenic interference with the climate system.” Recognizing that binding obligations are necessary to achieve the objective, countries adopted the Kyoto Protocol in 1997, and more than 160 have ratified it. The protocol acknowledges that the industrialized countries must lead efforts to address climate change, and commits those included in Annex B to the protocol to emissions targets. The United States and Australia (both included in Annex B) have chosen not to ratify, so far. The 36 countries with binding commitments comprise roughly 60 per cent of total industrialized country baseline emissions.
Besides the actions and measures to be taken by parties at the national level, the Kyoto Protocol allows for three flexible implementation mechanisms: emissions trading, Joint Implementation and the Clean Development Mechanism (CDM). International emissions trading is an approach under which Annex B countries can supplement domestic reductions. Under the latter two mechanisms, Annex I parties may invest in mitigation activities in other countries, and thereby generate emission reduction credits that can be used toward compliance with their own obligations. Many but not all countries appear to be on track to meet their targets during the 2008–2012 compliance period[133].
The CDM had been advanced as a unique opportunity for promoting sustainable development in developing countries in return for undertaking emission reductions, with financial and technological assistance from developed countries. However, progress to date suggests that the emphasis has been more on reducing the cost of mitigation rather than on facilitating sustainable development. There are growing calls to strengthen the CDM beyond 2012 to secure more sustainable development benefits[134].
Kyoto commitments end in 2012 and early clarification of the post-2012 regime is required. At the second meeting of parties in Nairobi in 2006, countries agreed in principle that there should be no gap between the 2012 commitments and the next period of commitments. To that end, they set a target of completing a review of the Kyoto Protocol by 2008, in preparation for establishing the next set of commitments. With regard to adaptation, the parties agreed on principles for governing the Adaptation Fund – the Kyoto instrument for distributing resources to developing countries to support adaptation – with hopes that funds might be disbursed within the next few years.
The ultimate success of global efforts in mitigation and adaptation can be realized only if climate concerns are mainstreamed in development planning at national and local levels. Since most GHG emissions are from energy, transport and agricultural land use, it is crucial to integrate climate concerns in these sectors, both at policy and operational levels, to achieve maximum co-benefits, such as improvements in air quality, generation of employment and economic gains. Setting mandatory targets for renewable energy and energy efficiency in these sectors may be an example of policy-level mainstreaming. The replacement of fossil fuels with biofuels to reduce air pollution and GHG emissions is an example of mainstreaming at an operational level. Integrating climate concerns in planning for sectors such as agriculture and water resources is crucial to facilitate adaptation of communities and ecosystems.
Although political actions to cut [[greenhouse gas]es] were slow in starting, a major change in the political climate began in late 2006 and early 2007. At least two events played a role in sensitizing public and political opinion: parts of Europe and North America had a very mild winter, and the IPCC released its 2007 assessment report, saying that climate change was real and evident. Many influential speakers were carrying the message, using photographs and images of melting glaciers and thinning ice in the Arctic to present visible evidence of climate warming unprecedented in the Earth’s recent history. In late 2006, the US state of California passed legislation mandating a 25 per cent cut below its current emissions of [[greenhouse gas]es] by 2020.
Stratospheric Ozone Depletion
The ozone layer
Stratospheric ozone depletion (see Box 2.7) is present everywhere to some degree, except over the tropics. Seasonal stratospheric ozone depletion is at its worst over the poles, particularly the Antarctic, and the inhabited areas most affected by the resulting increase in ultraviolet (UV-B) radiation include parts of Chile, Argentina, Australia and New Zealand.
 Fig 2.23 Size of the Antarctic hole over time.[135]
 Antarctic ozone depletion in the southern hemisphere spring has been large and increasing in extent since the Brundtland Commission report. The average area covered by the ozone hole (an area of almost total ozone depletion) has increased, though not as rapidly as it did during the 1980s, before the Montreal Protocol entered into force.
The area under the ozone hole varies from year to year (see Figure 2.23), and it is not yet possible to say whether it has hit its peak. The largest “holes” occurred in 2000, 2003 and 2006. On 25 September 2006, it extended over 29 million square kilometres and the total ozone loss was the largest on record[136]. Chemistry-climate models predict that recovery to pre-1980 Antarctic ozone levels can be expected around 2060–2075[137].
|
Box 2.7 Ozone-depleting substances |
|
Chlorofluorocarbons (CFCs) and other ozone-depleting substances (ODS) include a range of industrial chemicals first developed in the 1920s. They are stable and nontoxic, cheap to produce, easy to store and highly versatile. As a result, they came to be used in a wide range of applications, including as coolants for refrigeration and air conditioning, for blowing foams, as solvents, sterilants and propellants for spray cans. When released, they rise into the stratosphere, where they are broken apart by solar radiation to release chlorine or bromine atoms, which in turn destroy ozone molecules in the protective stratospheric ozone layer. They are slow to disappear, which means the emissions of yesterday and today will contribute to ozone depletion for years to come. |
The atmosphere above the Arctic is not as cold as that above the Antarctic, so ozone depletion there is not as severe. Ozone depletion during the Arctic winter and spring is highly variable, due to changes in stratospheric meteorological conditions from one winter to another, as can be seen from the unexpected ozone losses over central Europe in the summer of 2005. A future Arctic ozone hole as severe as that of the Antarctic appears unlikely, but the population at risk from stratospheric ozone depletion in the Arctic is much higher than in the Antarctic[138].
Effects of stratospheric ozone depletion
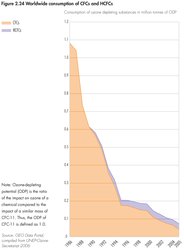 Fig 2.24 World wide consumption of CFCs and HCFCs.[139]
 UV-B radiation (medium wavelength ultraviolet radiation) causes adverse effects on human eyes, skin and immune systems, and the understanding of the mechanism through which UV-B affects health has improved in recent years[140]. Specific mechanisms for the development of skin cancer have been identified. Quantifying the increased incidence of skin cancer cases due to stratospheric ozone depletion is difficult, as other factors, such as lifestyle changes (for example, spending more time outdoors), also have an impact. However, in the case of Australia, where skin reddening radiation is estimated to have increased by 20 per cent from 1980 to 1996, it is deemed probable that some of the increase in cancer incidence is due to stratospheric ozone depletion[141].
Managing stratospheric ozone depletion
The international community reacted to the threat of ozone depletion with the [[Montreal Protocol] on Substances that Deplete the Ozone Layer]. This led to a phase-out of production and consumption of CFCs and other ODS. The protocol was signed by governments in 1987, and entered into force two years later. Initially, it called for a 50 per cent reduction in the manufacture of CFCs by the end of the century. This was strengthened through the London (1990), Copenhagen (1992), Montreal (1997) and Beijing (1999) amendments. It is now widely regarded as one of the most effective multilateral environmental agreements in existence. In addition to CFCs, the protocol covers substances such as halons, carbon tetrachloride, methyl chloroform, hydrochlorofluorocarbons (HCFCs), methyl bromide and bromochloromethane. The latter was added to the protocol’s control schedules in 1999, through the Beijing Amendment. Such amendments require a lengthy process of ratification, and other ODS with no commercial significance have not been added, though five such substances have been identified in recent years[142].
|
Box 2.8 UV-B radiation impacts in the Arctic [143] |
|
Although UV-B radiation impacts will affect both polar [[region]s], the Arctic is particularly at risk because of the extensive wetlands, melt ponds on the pack ice, and many lakes and ponds that are shallow and clear, permitting considerable UV-B radiation penetration. Studies have shown direct, harmful effects of UV-B on freshwater aquatic organisms at all trophic levels, and these effects have the capacity to cascade through the entire food web. Although there is still much to learn about the harmful effects of UV-B radiation, it is generally agreed that it affects many physiological and biochemical processes involved with growth, pigmentation and photosynthesis. Invertebrates in Arctic freshwaters, especially zooplankton, are vulnerable to UV-B, as it can affect productivity, genetic material, developmental and growth rates, and pigmentation. Studies of the effects of UV-B on fish are rare, but laboratory experiments have shown harm at all life stages, including skin damage and sunburns, increased infections, lesions on the brain and reduced growth. Studies have shown that present UV-B levels may already challenge the survival of many fish species. There is some encouraging news from these studies too: many organisms are tolerant of, avoid, repair damage from, or can develop defences against UV-B. Impacts from climate warming may increase the problems associated with UV-B radiation exposure of Arctic [[freshwater (Freshwater biomes)] ecosystems] (see [[Chapter 6 (Global Environment Outlook (GEO-4): Chapter 2)]9]). |
The phase-out schedules under the Montreal Protocol have reduced the consumption of many ODS (see Figure 2.24). The main exceptions are HCFCs (transitional replacements for CFCs, with much lower ozone-depleting potentials) and methyl bromide. Observations in the troposphere confirm a fall in ODS levels over recent years. Changes in the stratosphere lag by a few years, but chlorine levels there are declining. The bromine concentrations in the stratosphere have still not decreased[144].
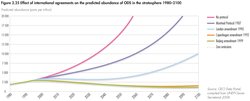 Fig 2.25 Effect of agreements on the predicted abundance of ODS in the stratosphere 1980-2100.[145]
 Other than for a few essential uses, consumption of CFCs in the industrialized world was phased out completely by 1996, except in some countries with economies in transition. By 2005, consumption of all categories of ODS, other than HCFCs and methyl bromide for approved critical uses, ended in industrialized countries. Although the protocol allows developing countries a buffer period for phasing out CFCs and halons, by 2005 they were already significantly ahead of schedule. Among the success factors behind the progress made under the Montreal Protocol (see Figure 2.25) is the principle of common but differentiated responsibility, and the financial mechanism of the protocol[146].
Furthermore it is clear that continued decreases in ODS production and use, following the Montreal Protocol provisions, are important for ozone layer recovery, and such measures will also reduce the ODS contribution to climate change. However, detailed knowledge concerning such interlinkages is still lacking (see Box 2.9 on interlinkages between climate change and ozone depletion below).
Despite the success of the protocol, the struggle against stratospheric ozone depletion is not yet over, and the ozone regime still faces a number of key challenges. Phasing out production and use of methyl bromide, a gaseous pesticide used mainly in agriculture, crop storage, buildings and transport, is one challenge. The development of alternatives to methyl bromide has been more complex than for most other ODS. Although alternatives exist, replacement has been slow. The protocol has a “critical use” exemption process where alternatives are not technologically and economically feasible, and there have been a large number of nominations for such critical uses by industrialized countries for the period after phase-out (2005 onwards).
|
Box 2.9 Climate change and stratospheric ozone – interlinked systems[147] |
|
Stratospheric ozone depletion and global warming share many common physical and chemical processes. Many categories of ODS, and several of their substitutes are, like CFCs, [[greenhouse gas]es] that contribute to climate change. The efforts undertaken under the Montreal Protocol have reduced the atmospheric abundances of CFCs, but global observations confirm increasing atmospheric concentrations of some of the common CFC alternatives, such as HCFCs. Overall, the understanding of the impact of stratospheric ozone depletion on climate change has been strengthened, although there are still many aspects of these complex systems where knowledge is lacking. The same is true for the effects of climate change on stratospheric ozone recovery. Different processes are simultaneously acting in different directions. Climate change is projected to lead to stratospheric cooling, which, in turn, is predicted both to enhance ozone concentrations in the upper stratosphere, but at the same time delay ozone recovery in the lower stratosphere. It is not yet possible to predict the net effect of these two processes. |
Another challenge is the problem of illegal trade in ODS, mostly for servicing air conditioning and refrigeration. As the phase-out of CFCs neared completion in industrialized countries, a thriving black market in these chemicals started in the mid-1990s. It was reduced when the demand from end users for CFCs steadily dropped, and law enforcement improved. Illegal trade is, however, widespread in the developing world, as it proceeds through its own phase-out schedules[148]. The main response at the global level, an amendment of the protocol in 1997 to introduce a system of export and import licenses, has had some effect. The Multilateral Fund and the Global Environment Facility (GEF) have also provided assistance with the establishment of licensing systems and training for customs officers. UNEP’s Green Customs Initiative has established cooperation among the secretariats of the Montreal Protocol and those of other multilateral environmental agreements, such as the Basel, Stockholm and Rotterdam conventions, and CITES. This also involves Interpol and the World Customs Organization[149].
Challenges and Opportunities
Our Common Future, the 1987 Brundtland Commission report, encouraged policy efforts to avoid adverse effects from climate change and air pollution, and it called on the international community to develop follow up activities. The report was followed by renewed commitments to solving these issues at the summits in Rio de Janeiro in 1992 and in Johannesburg in 2002. Agenda 21 and the Johannesburg Plan of Implementation were created to guide the international community. Several global conventions have been developed to deal with the atmospheric environment issues, and all have set targets for the reduction of the causes and impacts of the emissions. In Table 2.4 some of the major targets are summarized. In addition to global and regional policy initiatives, there have been numerous national initiatives.
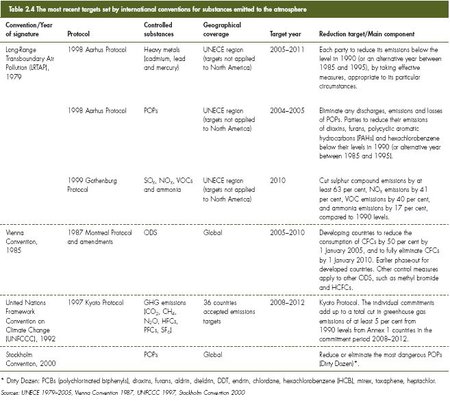 Table 2.4 The most recent targets set by international conventions for substances emitted to the atmosphere.[150]
 Two decades of mixed progress
Despite the many efforts initiated the atmospheric environment issues identified in 1987 still pose problems today. Responses to the challenges of air pollution and climate change have been patchy. The reduction in the emission of the stratospheric ozone-depleting substances has been impressive. Without this rapid and precautionary action, the health and environmental consequences would have been dire. In contrast, there is a remarkable lack of urgency in tackling the anthropogenic emissions of [[greenhouse gas]es]. Every year of delayed effort will entail the need for more drastic annual reductions in the future, if the climate is to be stabilized at a “relatively safe” level. Since the impacts of climate change are already evident on vulnerable communities and ecosystems, more effort on adaptation to climate change is urgent. The means to make rapid progress exist, but if this is to be achieved, political will and leadership will be crucial. The following discussion assesses national and international policy development and other responses to air pollution, climate change and stratospheric ozone depletion.
Comparing the responses to different atmospheric environment issues
Substantial reductions in emissions to the atmosphere (Atmospheric composition and structure) are feasible if all stakeholders act to remove barriers and promote sustainable solutions. The removal of lead from gasoline by almost all nations during the past 20 years is an outstanding example of a successful measure to reduce air pollution, with considerable benefits for human health and the environment (see Box 2.10).
|
Box 2.10 Worldwide ban on leaded gasoline within reach, with progress in sub-Saharan African countries |
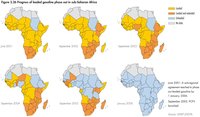 Fig 2.26 Progress of leaded gasoline phase-out in sub-Saharan Africa.[151] Fig 2.26 Progress of leaded gasoline phase-out in sub-Saharan Africa.[151] Emission of lead from gasoline has adverse impacts on human health, especially the intellectual development of children. Countries in North America, Europe and Latin America have phased out leaded gasoline, and the global phase-out of lead in gasoline has accelerated dramatically over the last decade. However, some countries in Asia, West Asia and Africa still use lead additives to boost octane levels in gasoline. Representatives from 28 sub-Saharan countries adopted the Dakar declaration in June 2001, to commit to national programmes to phase out leaded gasoline by 2005 (see Figure 2.26). The refinery conversion costs were often cheaper to implement than first assumed. For example, the Kenya refinery in Mombasa is expected to produce unleaded gasoline for an investment of US$20 million, down from an original estimate of US$160 million. |
The successful reductions in emissions of SO2, mainly in Europe and North America, is also noteworthy. It was achieved through a range of different pollution prevention and control strategies, including changes in fuel type (from coal to natural gas), desulphurization of emissions, coal washing, use of fuels with a lower sulphur content and improved energy efficiency[152]. Despite enormous economic growth in China, India and elsewhere, Figure 2.8a shows that global sulphur emissions have changed little since 1990. NOx has proved to be more difficult to address than sulphur, and Figure 2.8b shows an overall global increase in emissions. Even though vehicle technology has improved, with lower NOx emissions per vehicle, the number of passenger kilometres has increased. As a result, total NOx emissions in different countries have increased, stabilized or, at best, fallen slightly. Shipping and aviation emissions of NOx are increasing globally, while power station emissions have stabilized or reduced.
The Montreal Protocol is a good demonstration of the precautionary approach in action, as governments agreed to respond to stratospheric ozone depletion before its effects were fully clear. Even though CO2 and CFCs are both long-lived gases, and their potential consequences are severe, the precautionary approach has not been sufficiently implemented in the response to climate change. The reasons for this and the factors that affect the successful responses are summarized in Table 2.5.
The timing of negotiations on the Montreal Protocol was fortunate. The 1980s saw growing public concern over the state of the natural environment, and the dramatic illustrations of the [[ozone hole] above the Antarctic] demonstrated the impact of human activities. The number of key actors involved in the negotiations was small, which made agreement easier, and there was a clear leadership role exercised, first by the United States, and, subsequently, by the European Union. The success of the protocol was largely attributable to the flexibility designed into it to allow for its further development with evolving scientific knowledge and technologies. Since entering into force in 1989, the protocol has been adjusted on five occasions, allowing parties to accelerate phase-outs, without the need for repeated amendments to the treaty.
The recognition of the special needs of developing countries through slower phase-out schedules was important in encouraging low-income countries to adhere. In addition, the development of an effective financial mechanism, the Multilateral Fund, which has disbursed almost US$2 billion to developing countries to meet the incremental costs of phase outs, also enabled institutional strengthening to carry out the phase-out process, and was an important contribution to its success[153]. Alongside the financial mechanism, the trade measures of the protocol required signatories not to trade in ODS with non-parties, providing an incentive for countries to join. In addition, the non-compliance mechanism has proved to be flexible and highly effective. In contrast, the climate convention and Kyoto Protocol express intentions for technology transfer and assistance, but, to date, there has been limited implementation or provision of financial and technological resources to enable reductions in developing countries.
An important element underlying the success of the Montreal Protocol lies in the extent to which industry responded to the control schedules. Despite initial resistance, companies raced to compete in the markets for non-ozone-depleting substances and technologies, developing cheaper and more effective alternatives more rapidly and at lower costs than expected. In the case of climate change the same market conditions do not exist. In contrast, after the UNFCCC in 1992, the timing of the Kyoto Protocol was less fortunate, as it coincided with declining public and political interest in global environmental issues in the mid-1990s. The number of key stakeholders was large, and, with powerful opposition in some sectors, it proved difficult to reach an agreement.
Despite the fact that the design of the climate protection regime was broadly similar to that developed for ozone, the level of support from developed to developing countries, in relation to the scale of the task, was less generous. Although alternative, complementary approaches, such as the Asia-Pacific Partnership for Clean Development and Climate, and the G8 Gleneagles Programme of Action, which focus on technological development and deployment, have been put forward, the progress is far from satisfactory.
Only a limited amount of international cooperation has occurred through the CDM, although this could potentially be considerably higher in subsequent periods, if developed country targets are substantially more stringent. A second major weakness was the ease with which countries could opt out of the protocol with no adverse responses. This encouraged “free rider” behaviour, in which nations that chose not to ratify the protocol benefit doubly. They share the climate benefits of mitigation occurring in other countries, and have a competitive advantage that arises from avoiding the sometimes costly implementation measures that some Kyoto signatories are adopting. Thus, some industrial sectors that were unfavourable to the Kyoto Protocol managed successfully to undermine the political will to ratify. Even for signatories, incentives are weak, as the protocol does not yet have a substantial compliance regime.
Finally, the issue of the future evolution of the climate regime has been the focus of considerable discussion, and numerous approaches have been proposed[154] (see Chapter 10). The parties to the UNFCCC have agreed that they should act to protect the climate system “on the basis of equality and in accordance with their common but differentiated responsibilities and respective capabilities,”[155] but are still struggling to put this into practice. It remains the case that those who are primarily responsible for causing climate change are energy users and their customers, while those who will primarily bear the brunt of a changing climate are vulnerable communities with relatively little responsibility. As Agarwal and Narain (1991)[156] expressed it, people have an equal right to the atmospheric commons, and a climate regime must recognize the vast differences between those who gain from overexploiting the atmospheric commons, and those who bear the costs.
The foregoing analysis suggests that existing mechanisms of the Montreal Protocol and its implementation are largely adequate to tackle the remaining emissions of ODS, while air quality management in many parts of the world requires the strengthening of institutional, human and financial resources for implementing policies. For climate change, however, current global approaches are not effective. More innovative and equitable approaches for mitigation and adaptation at all levels of society, including fundamental changes to social and economic structures, will be crucial to adequately address the climate change issue.
Reducing emissions of chemicals with long residence times in the atmosphere
The production and release of these substances constitutes a special challenge. The impacts often manifest themselves long after emissions commenced, as was the case with mercury and POPs. Some GHGs, such as perfluorocarbons and sulphur hexafluoride, have estimated lifetimes of many thousands of years in the atmosphere. The amount of fluorinated gases used is small relative to the emissions of other GHGs. However, their very long lifetimes in the atmosphere together with their high global warming potentials add to their contribution to climate change. The costs of remediation and damage repair, if possible, are often higher than the costs of preventing the release of hazardous substances (see Chapters 3, 4 and 6 (Global Environment Outlook (GEO-4): Chapter 2)).
The global emissions of mercury represent an important issue, with inadequate international and national responses. The most significant releases of mercury are emissions to air, and once added to the global environment, mercury is continuously mobilized, deposited and re-mobilized. Burning coal and waste incineration account for about 70 per cent of total quantified emissions. As combustion of fossil fuels is increasing, mercury emissions can be expected to increase, in the absence of control technologies or prevention[157]. Current concentrations in the environment are already high, and have reached levels in some foods that can cause health impacts (see [[Chapter 6 (Global Environment Outlook (GEO-4): Chapter 2)]10]).
Opportunities to deal with atmospheric environment challenges
The major instrument used to address atmospheric issues has been government regulation. This instrument of policy has achieved considerable successes in some areas, such as the removal of lead from gasoline, reductions in sulphur in diesel fuel, the widespread adoption of tighter emission standards (such as the Euro standards) for vehicles around the world, and, most importantly, the virtual elimination of production of CFCs. However, the use of regulation has many limitations, and there is a growing additional use of other instruments as part of a tool box of policy approaches around the world.
In some circumstances economic instruments have been useful in applying the principle of polluter pays, addressing market failures and harnessing the power of markets to find the cheapest way to achieve policy targets. Examples include the cap-and- trade approach used in the United States as one way to achieve major reductions in emissions of SO2. Other approaches include load-based emissions charges that provide a direct economic incentive to reduce emissions, and the removal of subsidies that encourage use of high-emitting fuels in some countries.
Self-regulation and co-regulation are increasingly being used by large corporations as tools to improve the environmental performance of their operations, wherever they are located. Environmental management systems, such as the ISO 14000 series, and industry codes, such as Responsible Care, are being used as voluntary tools, often going beyond simple compliance with government regulations to reduce impacts of operations on the environment, and at the same time protect corporate brands.
In some circumstances information and education can also be powerful tools to mobilize public opinion, communities, civil society and the private sector to achieve environmental goals. They can be effective where government regulations are weak or not implemented. They are usually most successful when used in combination with other approaches, including regulations and economic instruments, to make selected high-emission activities both expensive, and their negative impacts well-known to the national and international community.
The success of policy development and implementation to control atmospheric emissions is largely determined by effective multi-stakeholder participation at different scales, and mobilization of public-private partnerships. Many countries have extensive regulations, but too often they are not applied effectively because of a lack of proper institutions, legal systems, political will and competent governance. Strong political leadership is essential to develop institutional capacity and effective outreach to the public, to ensure adequate funding, and to increase local, national and international coordination.
Most economic studies following government actions to address air pollution, even using conservative methodologies and cost estimates, generally show that the costs associated with impacts far outweigh the costs of these action, often by an order of magnitude[158]. Furthermore, in most cases the costs of action are considerably lower than anticipated[159]. In addition, the social distribution of the burden of pollution falls on poorer people, children, older people and those with pre-existing health conditions. Emissions can be reduced in a manner that will protect the climate without major disruptions to the socio-economic structures[160].
The future success of efforts to control atmospheric (Atmospheric composition and structure) emissions will ultimately depend on strong involvement of stakeholders at all levels, coupled with suitable mechanisms for facilitating technological and financial flows, and the strengthening of human and institutional capacities. Besides the development of innovative clean technologies, efforts to rapidly deploy currently available technologies in developing countries would go a long way to addressing these issues. Fundamental changes in social and economic structures, including lifestyle changes, are crucial if rapid progress is to be achieved.
Contributors Coordinating lead authors: Johan C.I. Kuylenstierna and Trilok S. Panwar Lead authors: Mike Ashmore, Duncan Brack, Hans Eerens, Sara Feresu, Kejun Jiang, Héctor Jorquera, Sivan Kartha, Yousef Meslmani, Luisa T. Molina, Frank Murray, Linn Persson, Dieter Schwela, Hans Martin Seip, Ancha Srinivasan, and Bingyan Wang Chapter review editors: Michael J. Chadwick and Mahmoud A.I. Hewehy Chapter coordinator: Volodymyr Demkine (Global Environment Outlook (GEO-4): Chapter 2)
Notes This is a chapter from Global Environment Outlook (GEO-4): Environment for Development (e-book). Previous: Chapter 1 (Global Environment Outlook (GEO-4): Chapter 2) 6 (Global Environment Outlook (GEO-4): Chapter 2) |Table of Contents (Global Environment Outlook (GEO-4): Chapter 2)|Next: Chapter 3 (Global Environment Outlook (GEO-4): Chapter 2) 3
Citation
Programme, U. (2012). Global Environment Outlook (GEO-4): Chapter 2. Retrieved from http://editors.eol.org/eoearth/wiki/Global_Environment_Outlook_(GEO-4):_Chapter_2- ↑ UN (2007). UN Millennium Development Goals. United Nations Department of Public Information (last accessed 7 June 2007)
- ↑ EEA (1995). Europe’s Environment - The Dobris Assessment. European Environment Agency, Copenhagen
- ↑ WHO (2006b). Solar ultraviolet radiation: global burden of disease from solar ultraviolet radiation. Environmental Burden of Disease Series No 13. World Health Organization, Geneva
- ↑ UNEP (2003). Environmental effects of ozone depletion and its interactions with climate change: 2002 assessment. In Photochemical & Photobiological Science 2:1-4
- ↑ Stern, N. (2006). The Economics of Climate Change – The Stem Review. Cambridge University Press, Cambridge
- ↑ Porcaro, J. and Takada, M. (eds.) (2005). Achieving the Millennium Development Goals: Case Studies from Brazil, Mali, and the Philippines. United Nations Development Programme, New York, NY—Rockström, J. Axberg, G.N., Falkenmark, M. Lannerstad, M., Rosemarin, A., Caldwell, I., Arvidson, A. and Nordström, M. (2005). Sustainable Pathways to Attain the Millennium Development Goals: Assessing the Key Role of Water, Energy and Sanitation. Stockholm Environment Institute, Stockholm
- ↑ IEA (2006). World Energy Outlook. International Energy Agency, Paris
- ↑ UNPD (2007). World Population Prospects: the 2006 Revision Highlights. United Nations Department of Social and Economic Affairs, Population Division, New York, NY (in GEO Data Portal)
- ↑ UNPD (2007). World Population Prospects: the 2006 Revision Highlights. United Nations Department of Social and Economic Affairs, Population Division, New York, NY (in GEO Data Portal)
- ↑ IEA (2007a). Energy Balances of OECD Countries and Non-OECD Countries 2006 edition. International Energy Agency, Paris (in GEO Data Portal)
- ↑ IEA (2007a). Energy Balances of OECD Countries and Non-OECD Countries 2006 edition. International Energy Agency, Paris (in GEO Data Portal)
- ↑ IEA (2007a). Energy Balances of OECD Countries and Non-OECD Countries 2006 edition. International Energy Agency, Paris (in GEO Data Portal)
- ↑ IEA (2007a). Energy Balances of OECD Countries and Non-OECD Countries 2006 edition. International Energy Agency, Paris (in GEO Data Portal)
- ↑ World Bank (2006). World Development Indicators 2006 (in GEO Data Portal)
- ↑ IEA (2007a). Energy Balances of OECD Countries and Non-OECD Countries 2006 edition. International Energy Agency, Paris (in GEO Data Portal)
- ↑ UNEP (2007a). Buildings and Climate Change: Status, Challenges and Opportunities. United Nations Environment Programme, Nairobi (last accessed 14 April 2007)
- ↑ UNSD (2007a). Transport Statistical Database (in GEO Data Portal)
- ↑ World Bank (2000). Improving Urban Air Quality in South Asia by Reducing Emissions from Two-Stroke Engine Vehicles. The World Bank, Washington, DC (last accessed April 14, 2007)—Faiz, A. and Gautam , S. (2004). Technical and policy options for reducing emissions from 2-stroke engine vehicles in Asia. In International Journal of Vehicle Design 34(1):1-11
- ↑ Newman, P. and Kenworthy, J. (2006). Urban Design to Reduce Automobile Dependence. In Opolis: An International Journal of Suburban and Metropolitan Studies 2(1): Article 3 (last accessed 1 May 2007)
- ↑ UNSD (2007b). International Civil Aviation Yearbook: Civil Aviation Statistics of the World (in GEO Data Portal)
- ↑ IATA (2007). Fuel Efficiency. International Air Transport Association, Montreal and Geneva (last accessed 7 June 2007)
- ↑ UNCTAD (2006). Review of Maritime Transport 2006. United Nations Conference on Trade and Development, New York and Geneva (last accessed 14 April 2007)
- ↑ GEO Data Portal. UNEP’s online core database with national, sub-regional, regional and global statistics and maps, covering environmental and socio-economic data and indicators. United Nations Environment Programme, Geneva (last accessed 7 June 2007)
- ↑ METI (2004). Sustainable future framework on climate change. Interim report by special committee on a future framework for addressing climate change. Global Environmental Sub-Committee, Industrial Structure Council, Japan. Ministry of Economy, Trade and Industry, Tokyo
- ↑ IEA (2007b). International Energy Agency Online Energy Statistics. International Energy Agency, Paris (last accessed June 21 2007)
- ↑ IPCC (2001a). Climate Change 2001: Synthesis Report. Intergovernmental Panel on Climate Change. Cambridge University Press, Cambridge
- ↑ Galanter, M. H., Levy, I. I. and Carmichael, G. R. (2000). Impacts of Biomass Burning on Tropospheric CO, NOX, and O3. In J. Geophysical Research 105:6633-6653
- ↑ ADB (2001). Asian Environmental Outlook 2001. Asian Development Bank, Manilla
- ↑ Goulder, L. H. and Nadreau, B. M. (2002). International Approaches to Reducing Greenhouse Gas Emissions. In Schneider, S. H., Rosencranz, A, and Niles, J.O. (eds.) In Climate Change Policy: A Survey. Island Press, Washington, DC
- ↑ Cohen, A. J., Anderson, H. R., Ostro, B., Pandey, K., Krzyzanowski, M., Künzli, N., Gutschmidt, K., Pope, C. A., Romieu, I., Samet, J. M. and Smith, K. R. (2004). Mortality impacts of urban air pollution. In Comparative quantification of health risks: global and regional burden of disease attributable to selected major risk factor Vol. 2, Chapter 17. World Health Organization, Geneva
- ↑ Cohen, A. J., Anderson, H. R., Ostro, B., Pandey, K., Krzyzanowski, M., Künzli, N., Gutschmidt, K., Pope, C. A., Romieu, I., Samet, J. M. and Smith, K. R. (2004). Mortality impacts of urban air pollution. In Comparative quantification of health risks: global and regional burden of disease attributable to selected major risk factor Vol. 2, Chapter 17. World Health Organization, Geneva
- ↑ WHO (2002). The World Health Report 2002. Reducing risks, promoting healthy life. World Health Organization, Geneva (last accessed 14 April 2007)—WHO (2006c). Fuel of life: household energy and health. World Health Organization, Geneva
- ↑ RIVM-MNP (2006). Emission Database for Global Atmospheric Research - EDGAR 3.2 and EDGAR 32FT2000. The Netherlands Environmental Assessment Agency, Bilthoven (in GEO Data Portal)
- ↑ APMA (2002). Benchmarking Urban Air Quality Management and Practice in Major and Mega Cities of Asia – Stage 1. Air Pollution in the Megacities of Asia Project. Stockholm Environment Institute, York (last accessed 11 April 2007)—Beijing Bureau of Statistics (2005). Beijing Statistical Yearbook 2005. Beijing Bureau of Statistics, Beijing—City of Cape Town (2006). <a href="http://www.capetown.gov.za/airqual/Air" rel="nofollow" title="http://www.capetown.gov.za/airqual/Air">Quality Monitoring Network</a>. City of Cape Town, Cape Town (last accessed 11 April 2007)—CPCB (2001-2006). National Ambient Air Quality- Status & Statistics 1999-2004. Central Pollution Control Board, New Delhi—GEO Data Portal. <a href="http://www.unep.org/geo/data" rel="nofollow" title="http://www.unep.org/geo/data">UNEP’s online core database</a> with national, sub-regional, regional and global statistics and maps, covering environmental and socio-economic data and indicators. United Nations Environment Programme, Geneva (last accessed 7 June 2007)—Mexico City Ambient Air Monitoring Network (2006). <a href="http://www.sma.df.gob.mx/simat/" rel="nofollow" title="http://www.sma.df.gob.mx/simat/">Federal District Government, Mexico DF</a> (last accessed 11 April 2007)—OECD (2002). OECD Environmental Data Compendium 2002. Organisation for Economic Cooperation and Development, Paris—TERI (2001). State of Environment Report for Delhi 2001. Supported by the Department of Environment, Government of National Capital Territory. Tata Energy Research Institute, New Delhi—WHO (2006a). WHO Air quality guidelines for particulate matter, ozone, nitrogen dioxide and sulfur dioxide, Global update 2005: Summary of risk assessment. World Health Organization, Geneva
- ↑ EEA (2005). The European Environment. State and Outlook 2005. European Environment Agency, Copenhagen
- ↑ SEPA (2006). 2005 Report on the State of the Environment in China. State Environmental Protection Agency (last accessed 1 May 2007)
- ↑ Akimoto, H., Oharaa, T., Kurokawa, J. and Horii, N. (2006). Verification of energy consumption in China during 1996–2003 by using satellite observational data. In Atmospheric Environment 40:7663-7667
- ↑ WHO (2006a). WHO Air quality guidelines for particulate matter, ozone, nitrogen dioxide and sulfur dioxide, Global update 2005: Summary of risk assessment. World Health Organization, Geneva
- ↑ Molina, M. J. and Molina, L. T. (2004). Megacities and atmospheric pollution. In Journal of the Air & Waste Management Association 54(6):644-680—WHO (2006a). WHO Air quality guidelines for particulate matter, ozone, nitrogen dioxide and sulfur dioxide, Global update 2005: Summary of risk assessment. World Health Organization, Geneva
- ↑ Cohen, A. J., Anderson, H. R., Ostro, B., Pandey, K., Krzyzanowski, M., Künzli, N., Gutschmidt, K., Pope, C. A., Romieu, I., Samet, J. M. and Smith, K. R. (2004). Mortality impacts of urban air pollution. In Comparative quantification of health risks: global and regional burden of disease attributable to selected major risk factor Vol. 2, Chapter 17. World Health Organization, Geneva
- ↑ Vingarzan, R. (2004). A review of surface ozone background levels and trends. In Atmospheric Environment 38:3431-3442
- ↑ Ramanathan, V., Crutzen, P. J. , Mitra A. P. and Sikka, D. (2002). The Indian Ocean Experiment and the Asian Brown Cloud. In Current Science 83(8):947-955
- ↑ Liepert, B. G. (2002). Observed refuctions of surface solar radiation at sites in the United States and worldwide from 1961 to 1990. In Geophysical Research Letters 29(10):1421
- ↑ Dentener, F., Stevenson, D., Ellingsen, K., van Noije, T., Schultz, M., Amann, M., Atherton, C., Bell, N., Bergmann, D., Bey, I., Bouwman, L., Butler, T., Cofala, J., Collins, B., Drevet, J., Doherty, R., Eickhout, B., Eskes, H., Fiore, A., Gauss, M., Hauglustaine, D., Horowitz, L., Isaksen, I. S. A. , Josse, B., Lawrence, M., Krol, M., Lamarque, J. F., Montanaro, V., Muller, J. F., Peuch, V. H., Pitari, G., Pyle, J., Rast, S., Rodriguez, J., Sanderson, M., Savage, N. H., Shindell, D., Strahan, S., Szopa, S., Sudo, K., Van Dingenen, R., Wild, O. and Zeng, G. (2006). The global atmospheric environment for the next generation. In Environmental Science & Technology 40(11):3586-3594
- ↑ Cohen, A.J., Anderson, H.R., Ostro, B., Pandey, K.D., Krzyzanowski, M., Kunzli, N., Gutschmidt, K., Pope, A., Romieu, I., Samet, J.M. and Smith, K. (2005). The global burden of disease due to outdoor air pollution. In Journal of toxicology and environmental health Part A (68):1–7
- ↑ WHO (2002). The World Health Report 2002. Reducing risks, promoting healthy life. World Health Organization, Geneva (last accessed 14 April 2007)
- ↑ WHO (2002). The World Health Report 2002. Reducing risks, promoting healthy life. World Health Organization, Geneva (last accessed 14 April 2007)
- ↑ WHO (2002). The World Health Report 2002. Reducing risks, promoting healthy life. World Health Organization, Geneva (last accessed 14 April 2007)
- ↑ Martins, M. C. H., Fatigati, F. L., Vespoli, T. C., Martins, L. C., Pereira, L. A. A., Martins, M. A., Saldiva, P. H. N. and Braga, A.L.F. (2004). The influence of socio-economic conditions on air pollution adverse health effects in elderly people: an analysis of six regions in Sao Paulo, Brazil. In Journal of epidemiology and community health 58:41-46
- ↑ Holland, M., Kinghorn, S., Emberson, L., Cinderby, S., Ashmore, M., Mills, G. and Harmens, H. (2006). Development of a framework for probabilistic assessment of the economic losses caused by ozone damage to crops in Europe. CEH project No. C02309NEW. Centre for Ecology and Hydrology, Natural Environment Research Council, Bangor, Wales
- ↑ Emberson, L., Ashmore, M. and Murray, F. eds. (2003). Air Pollution Impacts on Crops and Forests - a Global Assessment. Imperial College Press, London
- ↑ Emberson, L., Ashmore, M. and Murray, F. eds. (2003). Air Pollution Impacts on Crops and Forests - a Global Assessment. Imperial College Press, London
- ↑ Skjelkvåle, B.L., Stoddard, J.L., Jeffries, D.S., Torseth, K., Hogasen, T., Bowman, J., Mannio, J., Monteith, D.T., Mosello, R., Rogora, M., Rzychon, D., Vesely, J,. Wieting, J., Wilander, A. and Worsztynowicz, A. (2005). Regional scale evidence for improvements in surface water chemistry 1990-2001. In Environmental Pollution 137(1):165-176
- ↑ Lippmann, M. (2003). Air pollution and health – studies in the Americas and Europe. In Air pollution and health in rapidly developing countries, G. McGranahan and F. Murray (eds.). Earthscan, London—Pope, A.C., III and Dockery, D.W. (2006). Critical Review: Health Effects of Fine Particulate Air Pollution: Lines that Connect. In J. Air & Waste Manage. Assoc. 56:709-742
- ↑ Ye, X.M., Hao, J.M., Duan, L. and Zhou, Z.P. (2002). Acidification sensitivity and critical loads of acid deposition for surface waters in China. In Science of the Total Environment 289(1-3):189-203—Kuylenstierna, J.C.I., Rodhe, H., Cinderby, S. and Hicks, K. (2001). Acidification in developing countries: ecosystem sensitivity and the critical load approach on a global scale. In Ambio 30:20-28—Larssen, T., Lydersen, E., Tang, D.G., He, Y., Gao, J.X., Liu, H.Y., Duan, L., Seip, H.M., Vogt, R.D., Mulder, J., Shao, M., Wang, Y.H., Shang, H., Zhang, X.S., Solberg, S., Aas, W., Okland, T., Eilertsen, O., Angell, V., Liu, Q.R., Zhao, D.W., Xiang, R.J., Xiao, J.S. and Luo, J.H. (2006). Acid rain in China. In Environmental Science & Technology 40(2):418-425
- ↑ Stevens, C.J., Dise, N.B., Mountford, J.O. and Gowing, D.J. (2004). Impact of nitrogen deposition on the species richness of grasslands. In Science 303(5665):1876-1879
- ↑ Phoenix, G.K., Hicks, W.K., Cinderby, S., Kuylenstierna, J.C.I., Stock, W.D., Dentener, F.J., Giller, K.E., Austin, A.T., Lefroy, R.D.B., Gimeno, B.S., Ashmore, M.R. and Ineson, P. (2006). Atmospheric nitrogen deposition in world biodiversity hotspots: the need for a greater global perspective in assessing N deposition impacts. In Global Change Biology 12:470-476
- ↑ Jacob, D. (1999). Introduction to Atmospheric Chemistry. Princeton University Press, New York, NY
- ↑ UNECE (1979-2005). The Convention on Long-range Transboundary Air pollution website. United Nations Economic Commission for Europe, Geneva (last accessed 14 April 2007)
- ↑ Environment Canada (2006). Canada-U.S. Air Quality Agreement. Environment Canada, Gatineau, QC (last accessed 11 April 2007)
- ↑ EU (1996). Council Directive 96/62/EC of 27 September 1996 on ambient air quality assessment and management. Environment Council, European Commission, Brussels. In Official Journal of the European Union L 296, 21/11/1996:55- 63—EU (1999). Council Directive 1999/30/EC of 22 April 1999 relating to limit values for sulphur dioxide, nitrogen dioxide and oxides of nitrogen, particulate matter and lead in ambient air. Environment Council, European Commission, Brussels. In Official Journal of the European Union L 163, 29/06/1999:41-60—EU (2002). Council Directive 2002/3/EC of the European parliament and of the council of 12 February 2002 relating to ozone in ambient air. Environment Council, European Commission, Brussels. In Official Journal of the European Union L 67, 09/03/2002:14-30
- ↑ ASEAN (2003). ASEAN Haze Agreement. The Association of South East Asian Nations, Jakarta (last accessed 11 April 2007)
- ↑ UNEP/RRC-AP (2006). Malé Declaration on the Control and Prevention of Air Pollution in South Asia and its Likely Transboundary Effects. UNEP Regional Resource Centre for Asia and the Pacific, Bangkok (last accessed 7 June 2007)
- ↑ Stockholm Convention (2000). Sockholm Convention on Persistent Organic Pollutants (last accessed 11 April 2007)
- ↑ UNEP/Chemicals (2006). The Mercury Programme. (last accessed 14 April 2007)
- ↑ UNEP (2006). GEO Year Book 2006. United Nations Environment Programme, Nairobi
- ↑ Gwilliam, K., Kojima, M. and Johnson, T. (2004). Reducing air pollution from urban transport. The World Bank, Washington, DC
- ↑ WBCSD (2005). Mobility 2030: Meeting the Challenges to Sustainability. World Business Council for Sustainable Development, Geneva—Faiz, A. and Gautam , S. (2004). Technical and policy options for reducing emissions from 2-stroke engine vehicles in Asia. In International Journal of Vehicle Design 34(1):1-11
- ↑ Wright, L. and Fjellstrom, K. (2005). Sustainable Transport: A Sourcebook for Policymakers in developing countries, Module 3a: Mass Transit Options. German Technical Cooperation (GTZ), Bangkok (last accessed 17April 2007)
- ↑ Brown, L. R. (2006). Building a New Economy. In Plan B 2.0: Rescuing a Planet Under Stress and a Civilization in Trouble. W. W. Norton, Exp Upd edition
- ↑ UNEP (2006). GEO Year Book 2006. United Nations Environment Programme, Nairobi
- ↑ Wheeler, D. (1999). Greening industry: New roles for communities, markets and governments. The World Bank, Washington, DC and Oxford University Press, New York, NY
- ↑ WHO (2006c). Fuel of life: household energy and health. World Health Organization, Geneva
- ↑ WHO (2006c). Fuel of life: household energy and health. World Health Organization, Geneva
- ↑ IPCC (2007). Climate Change 2007: The Physical Science Basis. Contribution of Working Group I to the Fourth Assessment Report of the Intergovernmental Panel on Climate Change, Geneva (last accessed 11 April 2007)
- ↑ Oerlemans, J. (2005). Extracting a climate signal from 169 glacier records. In Science 308(5722):675-77
- ↑ ACIA (2005). Arctic Climate Impact Assessment. Arctic Council and the International Arctic Science Committee, Cambridge University Press, Cambridge (last accessed 14 April 2007)
- ↑ Menzel, A., Sparks, T.H., Estrella, N., Koch, E., Aasa, A., Aha, R., Alm-Kubler, K., Bissolli, P., Braslavska, O., Briede, A., Chmielewski, F.M., Crepinsek, Z., Curnel, Y., Dahl, A., Defila, C., Donnelly, A., Filella, Y., Jatcza, K., Mage, F., Mestre, A., Nordli, O., Penuelas, J., Pirinen, P., Remisova, V., Scheifinger, H., Striz, M., Susnik, A., Van Vliet. A.J.H., Wielgolaski, F.E., Zach, S. and Zust, A. (2006). European phenological response to climate change matches warming pattern. In Global Change Biology 12:1969-1976
- ↑ Bryden, H., Longworth, H. and Cunningham, S. (2005). Slowing of the Atlantic meridional overturning circulation at 25° N. In Nature 438:455-457
- ↑ IPCC (2007). Climate Change 2007: The Physical Science Basis. Contribution of Working Group I to the Fourth Assessment Report of the Intergovernmental Panel on Climate Change, Geneva (last accessed 11 April 2007)—Webster, P.J., Holland, G.J., Curry, J.A. and Chang, H.R. (2005). Changes in Tropical Cyclone Number, Duration, and Intensity in a Warming Environment. In Science 309:1844-1846—Emanuel, K. (2005). Increasing destructiveness of tropical cyclones over the past 30 years. In Nature 436(7051):686-688
- ↑ AMCEN and UNEP (2002). Africa environment outlook: Past, Present and future perspectives. Earthprint Limited, Stevenage, Hertfordshire
- ↑ Moberg, A., Sonechkin, D.M., Holmgren, K., Datsenko, N.M. and Karlen, W. (2005). Highly variable Northern Hemisphere temperatures reconstructed from low- and highresolution proxy data. In Nature 433(7026):613-617—IPCC (2007). Climate Change 2007: The Physical Science Basis. Contribution of Working Group I to the Fourth Assessment Report of the Intergovernmental Panel on Climate Change, Geneva (last accessed 11 April 2007)
- ↑ Reid, H. and Alam, M. (2005). Millennium Development Goals. Stockholm Environment Institute, York. In Tiempo 54
- ↑ IPCC (2007). Climate Change 2007: The Physical Science Basis. Contribution of Working Group I to the Fourth Assessment Report of the Intergovernmental Panel on Climate Change, Geneva (last accessed 11 April 2007)
- ↑ UNFCCC-CDIAC (2006). Greenhouse Gases Database. United Nations Framework Convention on Climate Change, Carbon Dioxide Information Analysis Centre (in GEO Data Portal)
- ↑ Siegenthaler, U., Stocker, T.F., Monnin, E., Luthi, D., Schwander, J., Stauffer, B., Raynaud, D., Barnola, J.M., Fischer, H., Masson-Delmotte, V. and Jouzel, J. (2005). Stable carbon cycle-climate relationship during the late Pleistocene. In Science 310(5752):1313-1317—Spahni, R., Chappellaz, J., Stocker, T.F., Loulergue, L., Hausammann, G., Kawamura, K., Fluckiger, J., Schwander, J., Raynaud, D., Masson-Delmotte, V. and Jouzel, J. (2005). Atmospheric methane and nitrous oxide of the late Pleistocene from Antarctic ice cores. In Science 310(5752):1317-1321
- ↑ Siegenthaler, U., Stocker, T.F., Monnin, E., Luthi, D., Schwander, J., Stauffer, B., Raynaud, D., Barnola, J.M., Fischer, H., Masson-Delmotte, V. and Jouzel, J. (2005). Stable carbon cycle-climate relationship during the late Pleistocene. In Science 310(5752):1313-1317
- ↑ IPCC (2007). Climate Change 2007: The Physical Science Basis. Contribution of Working Group I to the Fourth Assessment Report of the Intergovernmental Panel on Climate Change, Geneva (last accessed 11 April 2007)
- ↑ UNFCCC-CDIAC (2006). Greenhouse Gases Database. United Nations Framework Convention on Climate Change, Carbon Dioxide Information Analysis Centre (in GEO Data Portal)—UNPD (2007). World Population Prospects: the 2006 Revision Highlights. United Nations Department of Social and Economic Affairs, Population Division, New York, NY (in GEO Data Portal)
- ↑ IPCC (2007). Climate Change 2007: The Physical Science Basis. Contribution of Working Group I to the Fourth Assessment Report of the Intergovernmental Panel on Climate Change, Geneva (last accessed 11 April 2007)
- ↑ Mears, C. A. and Wentz, F. J. (2005). The effect of diurnal correction on satellitederived lower tropospheric temperature. In Science 309(5740):1548-1551
- ↑ IPCC (2007). Climate Change 2007: The Physical Science Basis. Contribution of Working Group I to the Fourth Assessment Report of the Intergovernmental Panel on Climate Change, Geneva (last accessed 11 April 2007)
- ↑ IPCC (2007). Climate Change 2007: The Physical Science Basis. Contribution of Working Group I to the Fourth Assessment Report of the Intergovernmental Panel on Climate Change, Geneva (last accessed 11 April 2007)
- ↑ IPCC (2001b). Climate Change 2001: The Scientific Basis. Intergovernmental Panel on Climate Change. Cambridge University Press, Cambridge
- ↑ UNESCO-SCOPE (2006). The Global Carbon Cycle. UNESCO-SCOPE Policy Briefs October 2006 – No. 2. United Nations Educational, Scientific and Cultural Organization, Scientific Committee on Problems of the Environment, Paris (last accessed 14 April 2007)
- ↑ UNEP (2004). Impacts of summer 2003 heat wave in Europe. In: Environment Alert Bulletin 2 UNEP Division of Early Warning and Assessment/GRID Europe, Geneva (last accessed 14 April 2007)
- ↑ Dickens, G. R. (1999). Carbon cycle - The blast in the past. In Nature 401(6755):752—Svensen, H., Planke, S., Malthe-Sorenssen, A., Jamtveit, B., Myklebust, R., Eidem, T.R. and Rey, S.S. (2004). Release of methane from a volcanic basin as a mechanism for initial Eocene global warming. In Nature 429(6991):542-545
- ↑ Dore, M. H. I. (2005). Climate change and changes in global precipitation patterns: What do we know? In Environment International 31(8):1167-1181
- ↑ ACIA (2005). Arctic Climate Impact Assessment. Arctic Council and the International Arctic Science Committee, Cambridge University Press, Cambridge (last accessed 14 April 2007)—Cox, P. M., Betts, R. A., Collins, M., Harris, P. P., Huntingford, C. and Jones, C. D. (2004). Amazonian forest dieback under climate-carbon cycle projections for the 21st century. In Theoretical and Applied Climatology 78(1-3):137-156—Heath, J., Ayres, E., Possell, M., Bardgett, R.D., Black, H.I.J., Grant, H., Ineson, P. and Kerstiens, G. (2005). Rising Atmospheric CO2 Reduces Sequestration of Root-Derived Soil Carbon. In Science 309: 1711-1713—Soden, B.J., Jackson, D.L., Ramaswamy, V., Schwarzkopf, M.D. and Huang, X.L. (2005). The radiative signature of upper tropospheric moistening. In Science 310:841-844—Walter, K.M., Zimov, S.A., Chanton, J.P., Verbyla, D. and Chapin, F.S. (2006). Methane bubbling from Siberian thaw lakes as a positive feedback to climate warming. In Nature 443:71-75—Zimov, S.A., Schuur, E.A.G. and Chapin, F.S. (2006). Permafrost and the global carbon budget. In Science 312:1612-1613
- ↑ IPCC (2001b). Climate Change 2001: The Scientific Basis. Intergovernmental Panel on Climate Change. Cambridge University Press, Cambridge
- ↑ Steffen, K. and Huff, R. (2005). Greenland Melt Extent, 2005 (last accessed 11 April 2007)
- ↑ IPCC (2007). Climate Change 2007: The Physical Science Basis. Contribution of Working Group I to the Fourth Assessment Report of the Intergovernmental Panel on Climate Change, Geneva (last accessed 11 April 2007)
- ↑ Emanuel, K. (2005). Increasing destructiveness of tropical cyclones over the past 30 years. In Nature 436(7051):686-688—Trenberth, K. (2005). Uncertainty in hurricanes and global warming. In Science 308(5729):1753-1754—Webster, P.J., Holland, G.J., Curry, J.A. and Chang, H.R. (2005). Changes in Tropical Cyclone Number, Duration, and Intensity in a Warming Environment. In Science 309:1844-1846
- ↑ Landsea, C.W., Harper, B.A., Hoarau, K. and Knaff, J.A. (2006). Can we detect trends in extreme tropical cyclones? In Science 313:452-454
- ↑ IPCC (2007). Climate Change 2007: The Physical Science Basis. Contribution of Working Group I to the Fourth Assessment Report of the Intergovernmental Panel on Climate Change, Geneva (last accessed 11 April 2007)—WMO (2006a). Commission for Atmospheric Sciences, Fourteenth session, 2006. Abridged final report with resolutions and recommendations. WMO No.-1002. World Meteorological Organization, Geneva
- ↑ IPCC (2007). Climate Change 2007: The Physical Science Basis. Contribution of Working Group I to the Fourth Assessment Report of the Intergovernmental Panel on Climate Change, Geneva (last accessed 11 April 2007)
- ↑ IPCC (2007). Climate Change 2007: The Physical Science Basis. Contribution of Working Group I to the Fourth Assessment Report of the Intergovernmental Panel on Climate Change, Geneva (last accessed 11 April 2007)
- ↑ IPCC (2001a). Climate Change 2001: Synthesis Report. Intergovernmental Panel on Climate Change. Cambridge University Press, Cambridge
- ↑ IPCC (2007). Climate Change 2007: The Physical Science Basis. Contribution of Working Group I to the Fourth Assessment Report of the Intergovernmental Panel on Climate Change, Geneva (last accessed 11 April 2007)
- ↑ Gregory, J. M., Huybrechts, P. and Raper, S. C. B. (2004). Threatened loss of the Greenland ice-sheet. In Nature 428:616—Gregory, J.M. and Huybrechts P. (2006). Ice-sheet contributions to future sea-level change. In Phil.Trans. R. Soc. A 364:1709-1731
- ↑ Hansen, J. E. (2005). A slippery slope: How much global warming constitutes “dangerous anthropogenic interference?” In Climatic Change 68(3):269-279
- ↑ Zwally, H.J., Giovinetto, M.B., Li, J., Cornejo, H.G., Beckley, M.A., Brenner, A.C., Saba, J.L. and Yi, D.H. (2005). Mass changes of the Greenland and Antarctic ice sheets and shelves and contributions to sea-level rise: 1992-2002.In J Glaciol 51(175):509-527
- ↑ IPCC (2001c). Climate Change 2001: Impacts, Adaptation and Vulnerability. Intergovernmental Panel on Climate Change. Cambridge University Press, Cambridge
- ↑ Curry, R. and Mauritzen, C. (2005). Dilution of the northern North Atlantic Ocean in recent decades. In Science 308(5729):1772-1774
- ↑ IPCC (2007). Climate Change 2007: The Physical Science Basis. Contribution of Working Group I to the Fourth Assessment Report of the Intergovernmental Panel on Climate Change, Geneva (last accessed 11 April 2007)
- ↑ Royal Society (2005b). Full text of open letter to Margaret Beckett and other G8 energy and environment ministers from Robert May, President. The Royal Society, London (last accessed 11 April 2007)—Orr, J.C., Fabry, V.J., Aumont, O., Bopp, L., Doney, S.C., Feely, R.A., Gnanadesikan, A., Gruber, N., Ishida, A., Joos, F., Key, R.M., Lindsay, K., Maier-Reimer, E., Matear, R., Monfray, P., Mouchet, A., Najjar, R.G., Plattner, G.K., Rodgers, K.B., Sabine, C.L., Sarmiento, J.L., Schlitzer, R., Slater, R.D., Totterdell, I.J., Weirig, M.F., Yamanaka, Y. and Yool, A. (2005). Anthropogenic ocean acidification over the twenty-first century and its impact on calcifying organisms. In Nature 437:681-686
- ↑ IPCC (2001c). Climate Change 2001: Impacts, Adaptation and Vulnerability. Intergovernmental Panel on Climate Change. Cambridge University Press, Cambridge
- ↑ Royal Society (2005a). Food crops in a changing climate: Report of a Royal Society Discussion Meeting. 26-27 April 2005. Policy report from the meeting, launched 20 June 2005. The Royal Society, London—Royal Society (2005b). Full text of open letter to Margaret Beckett and other G8 energy and environment ministers from Robert May, President. The Royal Society, London (last accessed 11 April 2007)—Huntingford, C. and Gash, J. (2005). Climate equity for all. In Science 309(5742):1789
- ↑ Thomas, C.D., Cameron, A., Green, R.E., Bakkenes, M., Beaumont, L.J., Collingham, Y.C., Erasmus, B.F.N., de Siqueira, M.F., Grainger, A., Hannah, L., Hughes, L., Huntley, B., van Jaarsveld, A.S., Midgley, G.F., Miles, L., Ortega-Huerta, M.A., Peterson, A.T., Phillips, O.L. and Williams, S.E. (2004a). Extinction risk from climate change. In Nature 427:145-148—Thomas, C. D., Williams, S. E., Cameron, A., Green, R. E., Bakkenes, M., Beaumont, L. J., Collingham, Y. C., Erasmus, B. F. N., De Siqueira, M. F., Grainger, A., Hannah, L., Hughes, L., Huntley, B., van Jaarsveld, A. S., Midgley, G. F., Miles, L., Ortega- Huerta, M. A., Peterson, A. T. and Phillips, O. L. (2004b). Biodiversity conservation - Uncertainty in predictions of extinction risk -Effects of changes in climate and land use - Climate change and extinction risk – Reply. In Nature 430: Brief Communications
- ↑ Pounds, J.A., Bustamante, M.R., Coloma, L.A., Consuegra, J.A., Fogden, M.P.L., Foster, P.N., La Marca, E., Masters, K.L., Merino-Viteri, A., Puschendorf, R., Ron, S.R., Sanchez- Azofeifa, G.A., Still, C.J. and Young, B.E. (2006). Widespread amphibian extinctions from epidemic disease driven by global warming. In Nature 439:161-167
- ↑ Gash, J.H.C., Huntingford, C., Marengo, J.A., Betts, R.A., Cox, P.M., Fisch, G., Fu, R., Gandu, A.W., Harris, P.P., Machado, L.A.T., von Randow, C. and Dias, M.A.S. (2004). Amazonian climate: results and future research. In Theoretical and Applied Climatology 78(1-3):187-193
- ↑ WHO (2002). The World Health Report 2002. Reducing risks, promoting healthy life. World Health Organization, Geneva (last accessed 14 April 2007)
- ↑ Patz, J. A., Lendrum, D. C., Holloway, T. and Foley, J. A. (2005). Impact of regional climate change on human health. In Nature 438:310-317—WHO (2003). Climate Change and Human Health – Risks and Responses. McMichael, A.J., Campbell-Lendrum, D.H., Corvalan, C.F., Ebi, K.L., Githeko, A.K., Scheraga, J.D. and Woodward, A. (eds.). World Health Organization, Geneva
- ↑ Den Elzen, M. G. J. and Meinshausen, M. (2005). Meeting the EU 2-C climate target: global and regional emission implications. RIVM report 728007031/2005. The Netherlands Environmental Assessment Agency, Bilthoven
- ↑ Groom, B., Hepburn, C., Koundour, P. and Pearce, D. (2005). Declining Discount Rates: The Long and the Short of it. In Environmental & Resource Economics 32:445-493—Stern, N. (2006). The Economics of Climate Change – The Stem Review. Cambridge University Press, Cambridge
- ↑ Hansen, J. E. (2005). A slippery slope: How much global warming constitutes “dangerous anthropogenic interference?” In Climatic Change 68(3):269-279
- ↑ Hare, B. and Meinshausen, M. (2004). How much warming are we committed to and how much can be avoided? Report 93. Potsdam Institute for Climate Impact Research, Potsdam
- ↑ Vennemo, H., Aunan, K., Fang, J., Holtedahl, P., Hu, T. and Seip, H. M. (2006). Domestic environmental benefits of China’s energy-related CDM potential. In Climate Change 75:215-239—Aunan, K., Fang, J. H., Hu, T., Seip, H. M. and Vennemo, H. (2006). Climate change and air quality - Measures with co-benefits in China. In Environmental Science & Technology 40(16):4822-4829
- ↑ Stern, N. (2006). The Economics of Climate Change – The Stem Review. Cambridge University Press, Cambridge—Edenhofer, O., Kemfert, C., Lessmann, K., Grubb, M. and Koehler, J. (2006). Induced Technological Change: Exploring its implications for the Economics of Atmospheric Stabilization: Synthesis Report from the innovation Modeling Comparison Project. In The Energy Journal Special Issue, Endogenous Technological Change and the Economics of Atmospheric Stabilization 57:107
- ↑ Azar, C. and Schneider, S. H. (2002). Are the economic costs of stabilising the atmosphere prohibitive? In Ecological Economics 42(1-2):73-80
- ↑ DeCanio, S. J. (2003). Economic Models of Climate Change: A Critique. Palgrave Macmillan, Hampshire
- ↑ IPCC (2001b). Climate Change 2001: The Scientific Basis. Intergovernmental Panel on Climate Change. Cambridge University Press, Cambridge
- ↑ UNFCCC (2007). The Kyoto Protocol website (last accessed 10 April 2007)
- ↑ Srinivasan, A. (2005). Mainstreaming climate change concerns in development: Issues and challenges for Asia. In Sustainable Asia 2005 and beyond: In the pursuit of innovative policies. IGES White Paper, Institute for Global Environmental Strategies, Tokyo
- ↑ NASA (2006). Ozone Hole Monitoring. Total Ozone Mapping Spectrometer. NASA Website (last accessed 1 May 2007)
- ↑ WMO (2006b). WMO Antarctic Ozone Bulletin #4/2006. World Meteorological Organization, Geneva (last accessed 17 April, 2007)
- ↑ WMO and UNEP (2006). Executive Summary of the Scientific Assessment of Ozone Depletion: 2006. Scientific Assessment Panel of the Montreal Protocol on Substances that Deplete the Ozone Layer, Geneva and Nairobi (last accessed 14 April 2007)
- ↑ WMO and UNEP (2006). Executive Summary of the Scientific Assessment of Ozone Depletion: 2006. Scientific Assessment Panel of the Montreal Protocol on Substances that Deplete the Ozone Layer, Geneva and Nairobi (last accessed 14 April 2007)
- ↑ WMO and UNEP (2006). Executive Summary of the Scientific Assessment of Ozone Depletion: 2006. Scientific Assessment Panel of the Montreal Protocol on Substances that Deplete the Ozone Layer, Geneva and Nairobi (last accessed 14 April 2007)
- ↑ UNEP (2003). Environmental effects of ozone depletion and its interactions with climate change: 2002 assessment. In Photochemical & Photobiological Science 2:1-4
- ↑ ASEC (2001). Australia: State of Environment 2001. Australian State of the Environment Committee, Department of the Environment and Heritage. CSIRO Publishing, Canberra (last accessed 15 April 2007)
- ↑ Hansson, L. (2000). Induced pigmentation in zooplankton: a trade-off between threats from predation and ultraviolet radiation. In Proc. Biol. Science 267(1459):2327–2331—Perin, S. and Lean, D.R.S. (2004). The effects of ultraviolet-B radiation on freshwater ecosystems of the Arctic: Influence from stratospheric ozone depletion and climate change. In Environment Reviews 12:1-70—Zellmer, I. D. (1998). The effect of solar UVA and UVB on subarctic Daphnia pulicaria in its natural habitat. In Hydrobiologia 379:55-62
- ↑ Andersen, S. O. and Sarma, M. (2002). Protecting the Ozone Layer: The United Nations History. Earthscan Publications, London
- ↑ WMO and UNEP (2006). Executive Summary of the Scientific Assessment of Ozone Depletion: 2006. Scientific Assessment Panel of the Montreal Protocol on Substances that Deplete the Ozone Layer, Geneva and Nairobi (last accessed 14 April 2007)
- ↑ WMO and UNEP (2006). Executive Summary of the Scientific Assessment of Ozone Depletion: 2006. Scientific Assessment Panel of the Montreal Protocol on Substances that Deplete the Ozone Layer, Geneva and Nairobi (last accessed 14 April 2007)
- ↑ Brack, D. (2003). Monitoring the Montreal Protocol. In Verification Yearbook 2003. VERTIC, London
- ↑ IPCC/TEAP (2005). IPCC Special Report on Safeguarding the Ozone Layer and the Global Climate System. Issues related to Hydrofluorocarbons and Perfluorocarbons. Approved and accepted in April 2005. Intergovernmental Panel on Climate Change, Geneva—WMO and UNEP (2006). Executive Summary of the Scientific Assessment of Ozone Depletion: 2006. Scientific Assessment Panel of the Montreal Protocol on Substances that Deplete the Ozone Layer, Geneva and Nairobi (last accessed 14 April 2007)
- ↑ UNEP (2002). Study on the monitoring of international trade and prevention of illegal trade in ozone-depleting substances. Study for the Meeting of the Parties. UNEP/OzL. Pro/WG.1/22/4. United Nations Environment Programme, Nairobi (last accessed 17 April 2007)
- ↑ Green Customs (2007). (last accessed 7 June 2007)
- ↑ UNECE (1979-2005). The Convention on Long-range Transboundary Air pollution website. United Nations Economic Commission for Europe, Geneva (last accessed 14 April 2007)—Vienna Convention (2007). <a href="http://ozone.unep.org/Treaties_and_Ratification/2A_vienna_convention.asp" rel="nofollow" title="http://ozone.unep.org/Treaties_and_Ratification/2A_vienna_convention.asp">The Vienna Convention website</a> (last accessed 7 June 2007) 80—UNFCCC (1997). <a href="http://unfccc.int/kyoto_protocol/items/2830.php" rel="nofollow" title="http://unfccc.int/kyoto_protocol/items/2830.php">United Nations Framework Convention on Climate Change</a>. United Nations Conference on Environment and Development, 1997 (last accessed 17 April 2007)
- ↑ UNEP (2007b). Partnership for clean fuels and vehicles. United Nations Environment Programme, Nairobi (last accessed 7 June 2007)
- ↑ UNECE (1979-2005). The Convention on Long-range Transboundary Air pollution website. United Nations Economic Commission for Europe, Geneva (last accessed 14 April 2007)
- ↑ Bankobeza, G. M. (2005). Ozone protection – the international legal regime. Eleven International Publishing, Utrecht
- ↑ Bodansky, D. (2003). Climate Commitments: Assessing the Options. In Beyond Kyoto: Advancing the International Effort Against Climate Change. Pew Center on Global Climate Change
- ↑ UNFCCC (1997). United Nations Framework Convention on Climate Change. United Nations Conference on Environment and Development, 1997 (last accessed 17 April 2007)
- ↑ Agarwal, A. and Narain, S. (1991). Global Warming in an Unequal World: A Case of Environmental Colonialism. Centre for Science and Environment, New Delhi
- ↑ UNEP (2003). Environmental effects of ozone depletion and its interactions with climate change: 2002 assessment. In Photochemical & Photobiological Science 2:1-4
- ↑ Watkiss, P., Baggot, S., Bush, T., Cross, S., Goodwin, J., Holland, M., Hurley, F., Hunt, A., Jones, G., Kollamthodi, S., Murrells, T., Stedman, J. and Vincent, K. (2004). An evaluation of air quality strategy. Department for Environment, Food and Rural Affairs, London (last accessed 17 April 2007)—USEPA (1999). <a href="http://www.epa.gov/air/sect812/prospective1.html" rel="nofollow" title="http://www.epa.gov/air/sect812/prospective1.html">The benefits and costs of the Clean Air Act 1990 to 2010</a>. US Environmental Protection Agency, Washington, DC (last accessed 14 April 2007)—Evans, J., Levy, J., Hammitt, J., Santos-Burgoa, C., Castillejos, M., Caballero-Ramirez, M., Hernandez-Avila, M., Riojas-Rodriguez, H., Rojas-Bracho, L., Serrano-Trespalacios, P., Spengler, J.D. and Suh, H. (2002). Health benefits of air pollution control. In Molina, L.T. and Molina, M.J. (eds.) Air Quality in the Mexico Megacity: An Integrated Assessment. Kluwer Academic Publishers, Dordrecht
- ↑ Watkiss, P., Baggot, S., Bush, T., Cross, S., Goodwin, J., Holland, M., Hurley, F., Hunt, A., Jones, G., Kollamthodi, S., Murrells, T., Stedman, J. and Vincent, K. (2004). An evaluation of air quality strategy. Department for Environment, Food and Rural Affairs, London (last accessed 17 April 2007)
- ↑ Azar, C. and Schneider, S. H. (2002). Are the economic costs of stabilising the atmosphere prohibitive? In Ecological Economics 42(1-2):73-80—Edenhofer, O., Kemfert, C., Lessmann, K., Grubb, M. and Koehler, J. (2006). Induced Technological Change: Exploring its implications for the Economics of Atmospheric Stabilization: Synthesis Report from the innovation Modeling Comparison Project. In The Energy Journal Special Issue, Endogenous Technological Change and the Economics of Atmospheric Stabilization 57:107—Stern, N. (2006). The Economics of Climate Change – The Stem Review. Cambridge University Press, Cambridge
