Global Environment Outlook (GEO-4): Chapter 3
Contents
- 1 Chapter 3: Land (Global Environment Outlook (GEO-4): Chapter 3)
- 2 Main messages
- 3 Introduction
- 4 Drivers of Change and Pressures
- 5 Environmental Trends and Responses
- 6 Forests
- 7 Land Degradation
- 8 Changes in land
- 9 Managing land resources
- 10 Desertification
- 11 Challenges and Opportunities
- 12 ContributorsCoordinating lead author: David DentLead authors: Ahmad Fares Asfary, Chandra Giri, Kailash Govil, Alfred Hartemink, Peter Holmgren, Fatoumata Keita-Ouane, Stella Navone, Lennart Olsson, Raul Ponce-Hernandez, Johan Rockström, and Gemma ShepherdContributing authors: Gilani Abdelgawad, Niels Batjes, Julian Martinez Beltran, Andreas Brink, Nikolai Dronin, Wafa Essahli, Göram Ewald, Jorge Illueca, Shashi Kant, Thelma Krug, Wolfgang Kueper, Li Wenlong, David MacDevette, Freddy Nachtergaele, Ndegwa Ndiang’ui, Jan Poulisse, Christiane Schmullius, Ashbindu Singh, Ben Sonneveld, Harald Sverdrup, Jo van Brusselen, Godert van Lynden, Andrew Warren, Wu Bingfang, and Wu ZhongzeChapter review editor: Mohamed KassasChapter coordinators: Timo Maukonen and Marcus Lee (Global Environment Outlook (GEO-4): Chapter 3)
- 13 Notes This is a chapter from Global Environment Outlook (GEO-4): Environment for Development (e-book). Previous: Chapter 2 (Global Environment Outlook (GEO-4): Chapter 3) 5 (Global Environment Outlook (GEO-4): Chapter 3) |Table of Contents (Global Environment Outlook (GEO-4): Chapter 3)|Next: Chapter 4 (Global Environment Outlook (GEO-4): Chapter 3) 5
Chapter 3: Land (Global Environment Outlook (GEO-4): Chapter 3)
Main messages
The demands of a burgeoning population (Human population explosion), economic development and global markets have been met by unprecedented land-use change. The following are the main messages of this chapter:
During the last 20 years, the exponential expansion of cropland has slackened, but land is now used much more intensively: globally in the 1980s, on average a hectare of cropland produced 1.8 tonnes, but now it produces 2.5 tonnes. For the first time in history, more than half of the world’s population lives in cities, which are growing rapidly, especially in developing countries. Cities draw upon extensive rural hinterlands for water and disposal of waste, while their demands for food, fuel and raw materials have a global reach.
Unsustainable land use is driving land degradation. Land degradation ranks with climate change and loss of biodiversity as a threat to habitat, economy and society, but society has different perspectives on various aspects of land degradation, according to political visibility. Inaction means a cumulative addition to a long historical legacy of degradation, from which recovery is difficult or impossible.
Harmful and persistent pollutants, such as heavy metals and organic chemicals, are still being released to the land, air and water from mining, manufacturing, sewage, energy and transport emissions; from the use of agrochemicals and from leaking stockpiles of obsolete chemicals. This issue is politically visible, effects on human health are direct and increasingly well understood, and better procedures and legislation to address chemical contamination are being developed. There has been progress in dealing with pollution in the industrialized countries, where the problem first emerged, but the shift of industry to newly-industrialized countries is yet to be followed by implementation of adequate measures to protect the environment and human health. Achievement of an acceptable level of safety, worldwide, requires strengthening of institutional and technical capacity in all countries, and the integration and effective implementation of existing controls at all levels. There remains an unacceptable lack of data, even for proxies, such as total production and application of chemicals.
Forest ecosystem services are threatened by increasing human demands. Exploitation of forests has been at the expense of biodiversity and natural regulation of water and climate, and has undermined subsistence support and cultural values for some peoples. These issues are increasingly acknowledged, prompting a range of technical responses, legislation and non-binding agreements (such as the United Nations Forum on Forests) to conserve forests, and financial mechanisms to support them. The historical decline in the area of temperate forest has been reversed, with an annual increase of 30,000 km2 between 1990 and 2005. Deforestation in the tropics, having begun later, continued at an annual rate of 130,000 km2 over the same period. The decline in forest area may be countered by investment in planted forest and more efficient use of wood. More forest is being designated for ecosystem services, but innovative management is required to maintain and restore ecosystems. There is an urgent need to build institutional capacity, in particular community-based management; the effectiveness of this response depends on good governance.
Land degradation in the form of soil erosion, nutrient depletion, water scarcity, salinity and disruption of biological cycles is a fundamental and persistent problem. Land degradation diminishes productivity, biodiversity and other ecosystem services, and contributes to climate change. It is a global development issue – degradation and poverty are mutually reinforcing – but is politically invisible and largely ignored. The damage can be arrested, even reversed, but this requires concerted, long-term investment across sectors, by all levels of government and by individual land users, research to provide reliable data, and adaptation of technologies appropriate to local circumstances. Such a package of measures has rarely been attempted.
Depletion of nutrients by continued cropping with few or no inputs limits productivity over vast tropical and subtropical upland areas. Research has shown the benefits of biological nutrient cycling by integration of legumes into the cropping system, improved fallows and agroforestry. However, widespread adoption is yet to be achieved, and for severely nutrient-deficient soils, there is no remedy except external nutrient inputs. The simple addition of manure or fertilizer may raise crop yields from as little as 0.5 to between 6 and 8 tonnes of grain/ha. In contrast to intensive farming systems that pollute streams and groundwater by excessive fertilizer application, many smallholders in poor countries do not have the means to purchase fertilizer, despite favourable benefit-cost ratios.
Increasing water scarcity is undermining development, food security, public health and ecosystem services. Globally, 70 per cent of available freshwater is held in the soil and accessible to plants, whereas only 11 per cent is accessible as stream flow and groundwater. Better soil and water management can greatly increase the resilience of farming systems and the availability of water downstream, but nearly all investment goes into the withdrawal of water, of which 70–80 per cent is used for irrigation. Meeting the Millennium Development Goal on hunger will require doubling of water use by crops by 2050. Even with much-needed improvements in efficiency, irrigation cannot do it alone. A policy shift is needed towards greater water-use efficiency in rain-fed farming, which will also replenish water supplies at source.
Desertification occurs when land degradation processes, acting locally, combine to affect large areas in drylands. Some 2 billion people depend on drylands, 90 per cent of them in developing countries. Six million km2 of drylands bear a legacy of land degradation. It is hard to deal with the problem, because of cyclical swings in rainfall, land tenure that is no longer well adjusted to the environment, and because local management is driven by regional and global forces. These forces have to be addressed by national, regional and global policies. Local responses need to be guided by consistent measurement of indicators of long-term ecosystem change.
Demands on land resources and the risks to sustainability are likely to intensify. There are opportunities to meet this challenge, and to avoid potentially unmanageable threats. Population growth (Human population explosion), economic development and urbanization will drive demands for food, water, energy and raw materials; the continued shift from cereal to animal products and the recent move towards biofuels will add to the demand for farm production. At the same time, climate change will increase water demands, and increasing variability of rainfall may increase water scarcity in drylands. Opportunities to meet these challenges include application of existing knowledge, diversification of land use, in particular to farming systems that mimic natural ecosystems and closely match local conditions instead of ignoring them, technological advances, harnessing markets to the delivery of ecosystem services, and independent initiatives by civil society and the private sector. Potentially unmanageable threats include runaway biological cycles, climate-related tipping points, conflict and breakdown of governance.
Introduction
Twenty years ago, Our Common Future, the report of the World Commission on Environment and Development, stated: "If human needs are to be met, the Earth’s natural resources must be conserved and enhanced. Land use in agriculture and forestry must be based on a scientific assessment of land capacity and the annual depletion of topsoil." Such a scientific assessment has yet to be undertaken and significant data uncertainties remain; the fundamental principles of sustainable land management, established at the 1992 UN Conference on Environment and Development (UNCED), notably in the Agenda 21 Programme of Action for Sustainable Development, are yet to be translated into globally effective policies and tools. Sustainable development remains one of the greatest challenges, although there have been some successes: at regional scales there are the rehabilitation of much of the Loess Plateau in China and the Great Plains of the United States, as a result of long-term, concerted action.
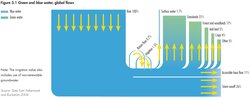 Fig 3.1 Green and Blue water, global flows[1].
 Over the last 20 years, increasing human population, economic development and emerging global markets have driven unprecedented land-use change. Anticipated human population increases and continued economic growth are likely to further increase exploitation of land resources over the next 50 years (see Chapter 9 (Global Environment Outlook (GEO-4): Chapter 3)). The most dynamic changes have been in forest cover and composition, expansion and intensification of cropland, and the growth of urban areas. Unsustainable land use drives land degradation through contamination and pollution, soil erosion and nutrient depletion. In some areas there is an excess of nutrients causing eutrophication, and there can be water scarcity and salinity. Beneath land degradation lies disturbance of the biological cycles on which life depends, as well as social and development issues. The term desertification was coined to convey this drama of pressing and interconnected issues in drylands, but human-induced land degradation extends beyond drylands or forests.
Many issues interact with the atmosphere (Atmospheric composition and structure) or water, or both. This chapter covers those aspects of water resources that are intimately linked to land management, ranging from rainfall to run-off, infiltration, storage of water in the soil and its use by plants (green water), as well as the uptake of salt, agrochemicals and suspended sediment. Aspects related to the recharge of groundwater and stream flow (blue water) are covered in Chapter 4 (Global Environment Outlook (GEO-4): Chapter 3), while carbon storage and emissions are dealt with mainly in Chapter 2 (Global Environment Outlook (GEO-4): Chapter 3). The green-blue water flows are highlighted in Figure 3.1.
Drivers of Change and Pressures
Drivers of land-use change include great increases in the human population and density, increased productivity, higher incomes and consumption (Consumption and well-being) patterns, and technological, political and climate change. Individual land-use decisions are also motivated by collective memory and personal histories, values, beliefs and perceptions. Table 3.1 summarizes pressures and drivers of land-use change, distinguishing between slow drivers that result in gradual impacts over decades, and fast drivers that may have impacts in one year (see the section on desertification).
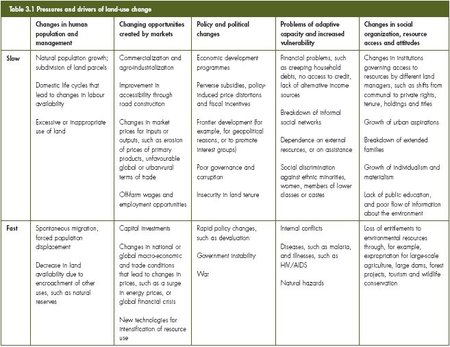 Table 3.1 Pressures and drivers of land-use change[2].
 Drivers of land-use change themselves change over time. For instance, the Brazilian Amazon was exploited from the late-19th to mid-20th century to supply rubber to the world market. In the second half of the 20th century, the region was drawn into the national economy, with large areas cleared for cattle ranching. Currently, it is responding to national and international markets, resulting in more intensive land use and continued forest conversion, mainly to farmland, including grassland for beef production.
Land-use change is influenced by local needs, as well as by nearby urban demands and remote economic forces (see Box 3.1 under Forests). At the global level, reliable historical data are scarce, but the available information indicates that the greatest changes over the last 20 years have been in forests, especially by conversion to cropland, woodland or grassland and also by new planted forests. Estimates of global land-use changes since 1987 are shown in Table 3.2 in terms of area change by category (the table does not show change of composition within these categories).
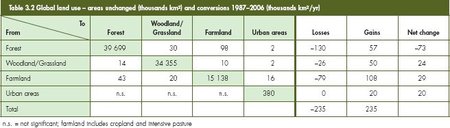 Table 3.2 Global land use – areas unchanged (thousands km2) and conversions 1987–2006 (thousands km2/yr)[3].
 Since 1987, the largest forest conversions have occurred in the Amazon Basin, South East Asia, and Central and West Africa. Forest area increased in the Eurasian boreal forest, and in parts of Asia, North America, and Latin America and the Caribbean, mainly due to new planted forests[16]. Forest degradation, from both human and natural causes, is widespread. For instance, 30,000 km2 of forest in the Russian far east have been degraded over the past 15 years by illegal logging and fires[17].
Cropland has expanded significantly in South East Asia, and in parts of West and Central Asia, the Great Lakes region of Eastern Africa, the southern Amazon Basin, and the Great Plains of the United States. In contrast, some croplands have been converted to other land uses: to forests in the southeastern United States, eastern China and southern Brazil, and to urban development around most major cities. Viewed in a wider historical context, more land was converted to cropland in the 30 years after 1950, than in the 150 years between 1700 and 1850[18].
Even more significant than the change in cropland area, is that land-use intensity has increased dramatically since 1987, resulting in more production per hectare. Cereal yields have increased by 17 per cent in North America, 25 per cent in Asia, 37 per cent in West Asia, and by 40 per cent in Latin America and the Caribbean. Only in Africa have yields remained static and low. Globally, adding together production of cereals, fruit, vegetables and meat, output per farmer and unit of land has increased. In the 1980s, one farmer produced one tonne of food, and one hectare of arable land produced 1.8 tonnes, annually on average. Today, one farmer produces 1.4 tonnes, and one hectare of land produces 2.5 tonnes. The average amount of land cultivated per farmer remained the same, at about 0.55 ha[19]. However, world cereal production per person peaked in the 1980s, and has since slowly decreased despite the increase in average yields.
Towns and cities are expanding rapidly. They occupy only a few per cent of the land surface, but their demand for food, water, raw materials and sites for waste disposal dominate the land around them. Urban expansion occurred at the expense of farmland rather than forest, and is currently highest in developing countries.
Environmental Trends and Responses
Land-use changes have had both positive and negative effects on human well-being, and on the provision of ecosystem services. The enormous increase in the production of farm and forest products has brought greater wealth and more secure livelihoods for billions, but often at the cost of land degradation, biodiversity loss and disruption of biophysical cycles, such as the water and nutrient cycles. These impacts create many challenges and opportunities. Table 3.3 summarizes positive and negative links between changes in land and human well-being.
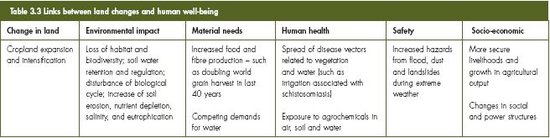 Table 3.3 Links between land changes and human well-being.
 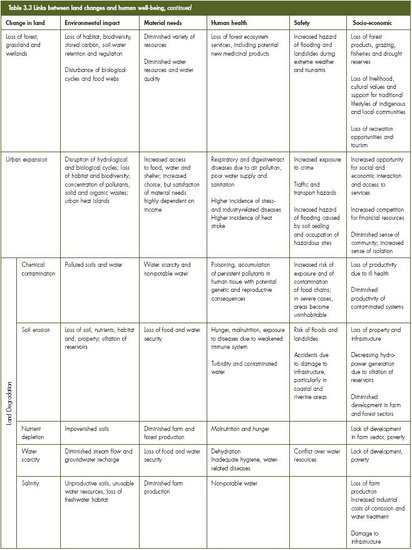 Table 3.3 Links between land changes and human well-being, continued.
 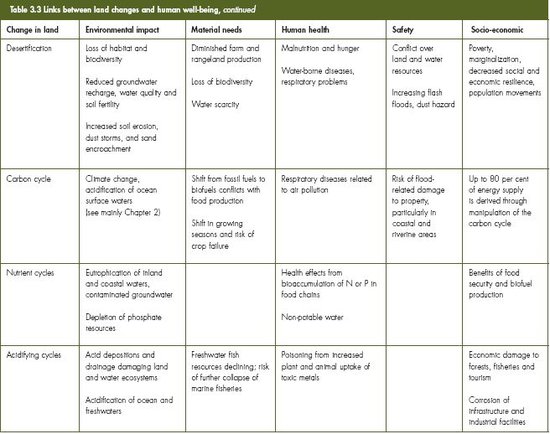 Table 3.3 Links between land changes and human well-being, continued.
 Forests
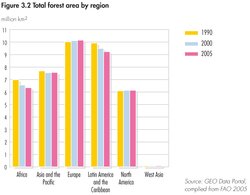 Fig 3.2 Total forest area by region[4].
 Forests are not just trees, but part of ecosystems that underpin life, economies and societies. Where forests are privately owned, they are often managed mainly for production. Yet, in addition to directly supporting such industries as timber, pulp and biotechnology, all forests provide a wide range of ecosystem services (Forest environmental services). These services include prevention of soil erosion, maintenance of soil fertility, and fixing carbon from the atmosphere (Atmospheric composition and structure) as biomass and soil organic carbon. Forests host a large proportion of terrestrial biodiversity, protect water catchments and moderate climate change. Forests also support local livelihoods, provide fuel, traditional medicines and foods to local communities, and underpin many cultures. The harvesting of forest products is putting severe stress on the world’s forests. Box 3.1 describes some of the main pressures that drive changes in forest ecosystems.
|
Box 3.1 Drivers and pressures affecting forest ecosystems[20] |
|
Changes in forest ecosystems, particularly the conversion from forest to other land uses and vice-versa, are driven by the harvesting of forest products and associated management activities, as well as by natural forest dynamics such as changes in age class and structure, and natural disturbance. Other drivers include climate change, diseases, invasive species, pests, air pollution and pressures from economic activities, such as agriculture and mining. There are a number of drivers and pressures causing changes in forests.
|
Changes in forest ecosystems
Between 1990 and 2005, the global forest area shrank at an annual rate of about 0.2 per cent. Losses were greatest in Africa, and Latin America and the Caribbean. However, forest area expanded in Europe and North America. In Asia and the Pacific, forest area expanded after 2000 (see the FAO data in Figure 3.2 and in Figure 6.31 on annual forest change in the biodiversity and ecosystems section of Latin America and the Caribbean in Chapter 6 (Global Environment Outlook (GEO-4): Chapter 3)).
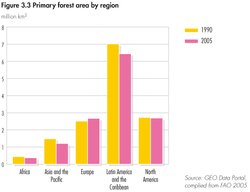 Fig 3.3 Primary forest area by region[5].
 In addition to the changes in global forest area, significant changes also occurred in forest composition, particularly in the conversion of primary forest to other types of forests (especially in Asia and the Pacific). It is estimated that over the past 15 years there has been an annual loss of 50,000 km2 of primary forest, while there has been an average annual increase of 30,000 km2 of planted and semi-natural forests. Primary forests now comprise about one-third of global forest area (see Figure 3.3).
Forests are managed for various functions (see Figure 3.4 ): in 2005, one-third of global forests were managed primarily for production, one-fifth for conservation and protection, and the remaining forests for social and multiple services. The proportion allocated primarily for production is largest in Europe (73 per cent) and least in North America (7 per cent) and West Asia (3 per cent). Of the total wood production, 60 per cent was industrial wood and 40 per cent was fuel; 70 per cent of industrial wood is produced in North America and Europe, while 82 per cent of fuel wood is produced in the developing world[21]. Non-wood forest products, including food, fodder, medicine, rubber and handicrafts, are increasingly acknowledged in forest assessments and, in some countries, are more valuable than wood products.
More and more forest areas are being designated for conservation and protection, partly in recognition of their valuable ecosystem services (Forest environmental services) such as soil and water protection, absorption of pollution, and climate regulation through carbon fixation. However, these services have been reduced by the decline in total forest area and by continued forest degradation, especially in production and multipurpose forests. For example, the rate of decline in fixed carbon has been greater than the rate of decline in forest area (see Figure 3.5).
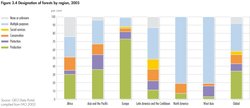 Fig 3.4 Designation of forest by region[6].
 Ensuring a continued flow of goods-and-services from forests is essential for human well-being and national economies. Greater emphasis on conservation of biodiversity may lead to increased benefits in terms of resilience, social relations, health, and freedom of choice and action[22].
Many of the world’s poor are directly and intensely affected by changes in forest use. A recent synthesis of data from 17 countries found that 22 per cent of rural household income in forested regions comes from harvesting wild food, firewood, fodder and medicinal plants, generating a much higher proportion of income for the poor than for wealthy families. For the poor, this is crucial when other sources of income are scarce[23].
Managing forests
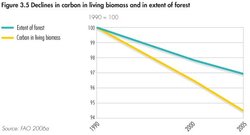 Fig 3.5 Declines in carbon in living biomass and in extent in of forest[7].
 Despite the extensive impacts of changes in forest cover and use, forest issues continue to be addressed piecemeal in multilateral conventions and other legally and non-legally binding instruments and agreements. However, some regional initiatives in forest law enforcement and governance break new ground in addressing illegal activities. Regional ministerial conferences on forests have taken place in East Asia (2001), Africa (2003), and Europe and North America (2005), jointly organized by the governments of producing and consuming countries[24].
The concept of sustainable forest management has evolved over the last two decades, but remains hard to define. The Forest Principles developed for UNCED state: "Forest resources and forest lands should be sustainably managed to meet the social, economic, ecological, cultural and spiritual needs of present and future generations." Alternative frameworks to assess and monitor the status and trends of different elements of sustainable forest management include criteria and indicators, forest certification and environmental accounting. At the methodological level, it is difficult to integrate information on forest state and trends, and the contribution of non-marketed, non-consumptive and intangible forest goods-and-services. A further difficulty lies in defining thresholds beyond which changes in values can be regarded as being significant. At the practical level, spatial and temporal data for assessing sustainability are often incompatible, inconsistent and insufficient. Policies to promote the fixing of atmospheric (Atmospheric composition and structure) carbon by agricultural, pastoral and forest systems have been more seriously considered, because fixing carbon by forest plantations is eligible for trading under the Kyoto Protocol. Table 3.4 summarizes progress towards sustainable forest management against measures of forest extent, biodiversity, forest health, and productive, protective and socio-economic functions. At the local level, there are many examples of innovative management, especially community based approaches that are arresting trends in forest degradation and loss of forest ecosystem services (see Box 3.2).
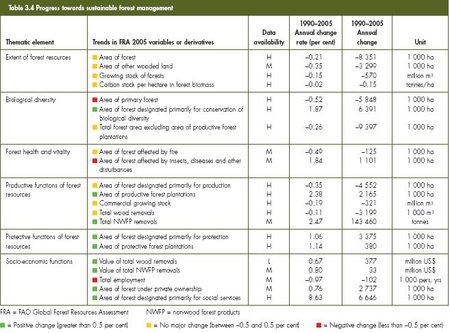 Table 3.4 Progress towards sustainable forest management[8].
 |
Box 3.2 Sustainable forest management by smallholders in the Brazilian Amazon[25] |
|
Since 1998, Brazilian farmers have had to maintain 80 per cent of their land as forest (50 per cent in some special areas) as a legal forest reserve. Small-scale forest management enables smallholders to make economic use of their forest reserves. Since 1995, a group of smallholders in the state of Acre, supported by Embrapa (the Brazilian Agricultural Research Corporation), has developed sustainable forest management systems based on traditional forest practices as a new source of income. Forest structure and biodiversity are maintained by low-impact disturbance at short intervals, combined with silvicultural practices, matching the circumstances of the smallholders (small management area, limited labour availability and investment) with appropriate management techniques (short cutting cycles, low intensity harvesting and animal traction). The system described here is practised in forest holdings averaging 40 ha each. Cooperative agreements among neighbours facilitate the acquisition of oxen, small tractors and solo-operated sawmills, yielding higher prices in local markets and reducing transportation costs. As a result, farmers’ incomes have risen 30 per cent. In 2001, the smallholders created the Association of Rural Producers in Forest Management and Agriculture to market their products nationwide and, in 2003, they won Forest Stewardship Council certification from SmartWood. Surveys have been conducted to monitor biodiversity. IBAMA (the Brazilian Environment and Renewable Natural Resource Institute) and BASA (the Bank of the Amazon) use the sustainable forest management system as a benchmark for development and financial policies for similar natural resource management schemes. |
Land Degradation
Land degradation is a long-term loss of ecosystem function and services, caused by disturbances from which the system cannot recover unaided. It blights a significant proportion of the land surface, and as much as one-third of the world’s population – poor people and poor countries suffer disproportionately from its effects. Established evidence links land degradation with loss of biodiversity and climate change, both as cause-and-effect[26]. Direct effects include losses of soil organic carbon, nutrients, soil water storage and regulation, and below-ground biodiversity. Indirectly, it means a loss of productive capacity and wildlife habitat. For instance, in rangelands it disrupts wildlife migration, brings changes in forage, introduces pests and diseases, and increases competition for food and water. Water resources are diminished by disruption of the water cycle, off-site pollution and sedimentation. The threat to sustainable development posed by land degradation has been recognized for decades, including by the 1992 Earth Summit and the 2002 World Summit on Sustainable Development, but responses have been hamstrung by weaknesses in available data, particularly in relation to the distribution, extent and severity of the various facets of degradation.
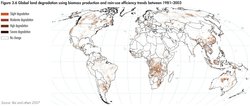 Fig 3.6 Global land degradation using biomass-production and rain use effeciency trends between 1981-2003[9].
 The only comprehensive source of information has been the Global Assessment of Human-induced Soil Degradation (GLASOD), which assessed the severity and kind of land degradation for broadly defined landscape units at a scale of 1:10 million[27]. It was compiled from expert judgments and, while invaluable as a first global assessment, it has since proven to be not reproducible and inconsistent. In addition, the relationships between land degradation and policy-relevant criteria, such as crop production and poverty, were unverified[28].
A new, quantitative global assessment under the GEF/UNEP/FAO project Land Degradation Assessment in Drylands (LADA) identifies black spots of land degradation by trends analysis of the last 25 years’ net primary productivity (NPP or biomass production). NPP is derived from satellite measurements of the normalized difference vegetation index (NDVI or greenness index). A negative trend in NPP does not necessarily indicate land degradation, since it depends on several other factors, especially rainfall. Figure 3.6 combines the recent trend of NPP with rain-use efficiency (NPP per unit of rainfall). Critical areas are identified as areas with a declining trend of NPP and declining rain-use efficiency over the past 25 years, excluding the simple effects of drought. For irrigated areas, only the biomass is considered and urban areas are excluded. The case study on Kenya highlights some of the results of the study (see Box 3.3).
|
Box 3.3 Land degradation in Kenya |
|
About 80 per cent of Kenya is dryland. The 25-year trends of biomass and rain-use efficiency highlight two black spots of land degradation: the drylands around Lake Turkana, and a swath of cropland in Eastern Province, corresponding to the recent extension of cropping into marginal areas (see the red areas in the bottom map). |
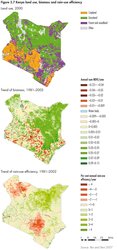 Fig 3.7 Kenya land use, biomass and rain use efficiency[10]. Fig 3.7 Kenya land use, biomass and rain use efficiency[10]. |
By contrast with previous assessments, such as GLASOD, this new measure does not compound the legacy of historical land degradation with what is happening now. It shows that between 1981 and 2003 there was an absolute decline in NPP across 12 cent of the global land area, with a strong negative change in a further 1 per cent of the land area. In respect of rain-use efficiency, there was an absolute decrease on 29 per cent of the land area and strong negative change on 2 per cent. The areas affected are home to about 1 billion people, some 15 per cent of the global population. Apart from the loss of farm and forest production, the degraded areas represent a loss of NPP of about 800 million tonnes of carbon over the period, meaning this amount was not fixed from the atmosphere (Atmospheric composition and structure). In addition, there were emissions to the atmosphere of one or two orders of magnitude more than this from the loss of soil organic carbon and standing biomass[29].
Areas of concern include tropical Africa south of the equator and southeast Africa, southeast Asia (especially steeplands), south China, north-central Australia, Central America and the Caribbean (especially steeplands and drylands), southeast Brazil and the Pampas, and boreal forests in Alaska, Canada and eastern Siberia. In areas of historical land degradation around the Mediterranean and West Asia, only relatively small areas of change are visible, such as in southern Spain, the Maghreb and the Iraqi marshlands. Comparison of black spots with land cover reveals that 18 per cent of land degradation by area is associated with cropland, 25 per cent is in broad-leaved forests and 17 per cent in boreal forests. This is consistent with trends in forest degradation, even as the area of boreal forests has increased (see section on Drivers and pressures). This preliminary analysis will need to be validated on the ground by the country-level case studies being undertaken by LADA, which will also determine the different types of degradation.
Changes in land
Chemical contamination and pollution
Chemicals are used in every aspect of life, including industrial processes, energy, transport, agriculture, pharmaceuticals, cleaning and refrigeration. More than 50,000 compounds are used commercially, hundreds are added every year, and global chemical production is projected to increase by 85 per cent over the next 20 years[30]. The production and use of chemicals have not always been accompanied by adequate safety measures. Releases, by-products and degradation of chemicals, pharmaceuticals and other commodities contaminate the environment, and there is growing evidence of their persistence and their detrimental effects on ecosystems and on human and animal health.
Currently, there is insufficient information on the amounts released, their toxic properties, effects on human health and safe limits for exposure to fully evaluate their environmental and human health impacts. The magnitude of chemical contamination can be measured or estimated by the residue levels and spatial concentration of substances, but data are incomplete globally and for many regions. Proxies that provide some indication include total production of chemicals, total use of pesticides and [[fertilizer]s], generation of municipal, industrial and agricultural wastes, and the status of implementation of multilateral environmental agreements relating to chemicals.
Land is subjected to a wide range of chemicals from many sources, including municipalities, industries and agriculture. There are persistent organic pollutants (POPs) such as DDT, brominated flame retardants and polyaromatic hydrocarbons heavy metals, such as lead, cadmium and mercury, and oxides of nitrogen and sulphur. In mining, for instance, toxic substances such as cyanide, mercury and sulphuric acid are used to separate metal from ores, leaving residues in the tailings. Toxic chemicals may be emitted from identifiable point sources, such as stockpiles of hazardous waste, power generation, incineration and industrial processes. They also come from diffuse sources, such as vehicle emissions, the agricultural application of pesticides and fertilizers, as well as in sewage sludge containing residues of process chemicals, consumer products and pharmaceuticals.
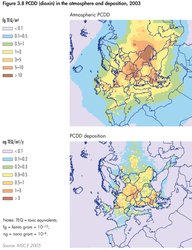 Fig 3.8 PCDD (dioxine) in the atmosphere and deposition, 2003[11].
 Many chemicals persist in the environment, circulating between air (Atmospheric composition and structure), water, sediments, soil and biota. Some pollutants travel long distances to supposedly pristine areas[31]. For example, POPs and mercury are now found in high concentrations in both people and wildlife in the Arctic[32] (see Figure 6.57 in the Polar section of [[Chapter 6 (Global Environment Outlook (GEO-4): Chapter 3)]2]). Chemical emissions to the atmosphere often become fallout on land or water. Figure 3.8 shows modelling results of the distribution of polychlorodibenzodioxins (PCDD) emissions and deposition in Europe for 2003. Chemical wastes from industry and agriculture are a big source of contamination, particularly in developing countries and countries with economies in transition. The concentrations of persistent toxic substances observed in many parts of sub-Saharan Africa indicate that this contamination is widespread across the region. Stockpiles containing at least 30,000 tonnes of obsolete pesticides were recorded in Africa[33]. These stockpiles, often leaking, are up to 40 years old, and contain some pesticides banned long ago in industrialized countries. Environmental levels of toxic chemicals will increase in countries still using them in large quantities (such as Nigeria, South Africa and Zimbabwe), and in countries without effective regulation of their use[34]. In addition, toxic wastes are still being exported to and dumped in developing countries. The dumping of hazardous wastes, such as the 2006 dumping of poisonous oil refinery waste containing hydrogen sulphide and organochloride in Abidjan, Ivory Coast, is still a major problem. This is despite such efforts as the 1991 Bamako Convention on the Ban of the Import into Africa and the Control of Transboundary Movement and Management of Hazardous Wastes within Africa.
A legacy of contaminated industrial and urban sites is common to all old industrial heartlands, particularly in the United States, Europe and the former Soviet Union. Across Europe, it is estimated that there may be more than 2 million such sites, containing hazardous substances such as heavy metals, cyanide, mineral oil and chlorinated hydrocarbons. Of these, some 100,000 require remediation[35]. See Chapter 7 (Global Environment Outlook (GEO-4): Chapter 3) for additional information on exposing people and the environment to contaminants.
Increasingly, some of the chemical waste stream comes from everyday products; increasing consumption (Consumer society) remains coupled to increased generation of wastes, including chemical wastes. Most domestic waste still goes into landfills, although in Europe there is a shift to incineration[36].
There are growing differences in pollution trends between industrialized and developing countries. Between 1980 and 2000, control measures resulted in lower emissions of pollutants into the atmosphere and reduced deposition over most of Europe. Now, pollution as a result of consumer activities is outpacing pollution from primary industrial sources. While OECD countries are still the largest producers and consumers of chemicals, there has been a shift of chemical production to newly industrializing countries that, 30 years ago, had little or no chemicals industry. This shift in production has not always been accompanied by control measures, increasing the risks of release of hazardous chemicals into the environment.
The last 25 years have seen accumulating evidence of the serious consequences of chemicals for the environment and human well-being. In addition to directly harming human health, atmospheric (Atmospheric composition and structure) pollutants have been implicated in increasing soil acidity and forest decline, and acidification of streams and lakes (see section on acidifying cycles), and have been linked to the burden of chronic diseases such as asthma. WHO estimates that each year, 3 million people suffer from severe pesticide poisoning, with as many as 20,000 unintentional deaths[37]. (See [[Chapter 2 (Global Environment Outlook (GEO-4): Chapter 3)]2] under effects of air pollution).
Soil erosion
Erosion is the natural process of removal of soil by water or wind. Soil erosion becomes a problem when the natural process is accelerated by inappropriate land management, such as clearance of forest and grasslands followed by cropping which results in inadequate ground cover, inappropriate tillage and overgrazing. It is also caused by activities such as mining, infrastructural and urban developments without well-designed and well-maintained conservation measures.
Loss of topsoil means loss of soil organic matter, nutrients, water holding capacity (see section on water scarcity) and biodiversity, leading to reduced production on-site. Eroded soil is often deposited where it is not wanted, with the result that the off-site costs, such as damage to infrastructure, sedimentation of reservoirs, streams and estuaries, and loss of hydropower generation, may be much higher than the losses in farm production.
Although there is consensus that soil erosion is often a severe problem, there are few systematic measurements of its extent and severity. Indicators include barren ground, removal of topsoil as sheet erosion over a wide area or concentrated as rills and gullies, or through landslides. Wind erosion is the major problem in West Asia, with as much as 1.45 million km2 – one-third of the region – affected. In extreme cases, mobile dunes encroach upon farmland and settlements[38]. Regional or even global estimates have, quite wrongly, scaled up measurements made on small plots, arriving at huge masses of eroded soil that would reshape whole landscapes within a few decades. Erosion rates reported from Africa range from 5–100 tonnes/ ha/yr, depending on the country and assessment method[39]. Authors including den Biggelaar and others[40] estimate that globally, 20,000–50,000 km2 is lost annually through land degradation, chiefly soil erosion, with losses 2–6 times higher in Africa, Latin America and Asia than in North America and Europe. Other global and regional spatial data present vulnerability to erosion, modelled from topographic, soil, land cover and climatic variables, but vulnerability is not the same thing as actual erosion: the most important factor determining actual erosion is the level of land management (see Box 3.4).
|
Box 3.4 Soil erosion in the Pampas[41] |
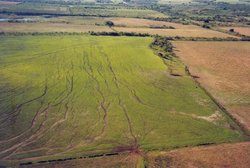 In the Pampas, rills form during rainstorms when ground cover is sparse, and gradually turn into large gullies. (Credit: J.L. Panigatti) In the Pampas, rills form during rainstorms when ground cover is sparse, and gradually turn into large gullies. (Credit: J.L. Panigatti) Soil erosion by water is the main form of land degradation in Latin America. The more extensive the area under cultivation, the more serious the erosion, even in the fertile Pampas. It has been an intractable problem, leading to the abandonment of farmland, for example, in northwest Argentina. The most promising development has been the arge-scale adoption of conservation tillage, which increases infiltration of rain into the soil compared to conventional ploughing. The area under conservation tillage in Latin America increased from almost zero in the 1980s to 250,000 km2 in 2000, with an adoption rate of 70–80 per cent among large, mechanized farms in Argentina and Brazil, although the adoption rate by small farms is lower. |
Nutrient depletion
Nutrient depletion is a decline in the levels of plant nutrients, such as nitrogen, phosphorous and potassium, and in soil organic matter, resulting in declining soil fertility. It is commonly accompanied by soil acidification, which increases the solubility of toxic elements, such as aluminium. The causes and consequences of nutrient depletion are well established: in a wet climate, soluble nutrients are leached from the soil, and everywhere crops take up nutrients. The removal of the harvest and crop residues depletes the soil, unless the nutrients are replenished by manure or inorganic [[fertilizer]s][42]. Nutrient mining refers to high levels of nutrient removal and no inputs.
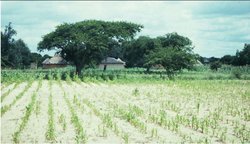 Poor crop performance due to nutrient deficiency compared with enhanced fertility around a farmstead, Zimbabwe. (Credit: Ken Giller)
 Deficiency of plant nutrients in the soil is the most significant biophysical factor limiting crop production across very large areas in the tropics, where soils are inherently poor. Several studies in the 1990s indicated serious nutrient depletion in many tropical countries, particularly in sub-Saharan Africa. Most calculations drew up nutrient budgets in which fluxes and pools were estimated from published data at country or sub-regional level. For example, the influential 1990 study by Stoorvogel and Smaling calculated budgets for nitrogen, phosphorus and potassium for the cropland of 38 countries in sub-Saharan Africa for the years since 1983, and projected the data to 2000. In nearly every case, the nutrient inputs were less than the outputs. Some 950,000 km2 of land in the region is threatened with irreversible degradation if nutrient depletion continues[43].
There has been criticism of the basis for such calculations, and debate on the extent and impact of nutrient depletion[44], but broad agreement on the phenomenon. In some areas, nutrients have been depleted because of reduced fallow periods in shifting cultivation systems, and little or no inorganic fertilizer inputs. In other areas, soil fertility of cropland may be maintained or improved through biomass transfer at the expense of land elsewhere. Where such differences are explored in more detail, there are complex explanations including non-agronomic factors, such as infrastructure, access to markets, political stability, security of land tenure and investments.
Across most of the tropics, the use of inorganic [[fertilizer]s] is limited by availability and cost, although inorganic fertilizers often have favourable value-to-cost ratios[45]. In parts of sub-Saharan Africa, as little as 1 kilogramme of nutrients is applied per hectare. This compares with nutrient additions around 10–20 times higher in industrialized countries – and also much higher rates in most other developing countries[46], where there is established evidence that leaching of nitrates into surface and groundwater, and wash-off of phosphates into streams and estuaries, can cause eutrophication (see [[Chapter 4 (Global Environment Outlook (GEO-4): Chapter 3)]2]).
Water scarcity
By 2025, about 1.8 billion people will be living in countries or regions with absolute water scarcity, and two-thirds of the world population could be under conditions of water stress – the threshold for meeting the water requirements for agriculture, industry, domestic purposes, energy and the environment[47]. This will have major impacts on activities such as farming (see [[Chapter 4 (Global Environment Outlook (GEO-4): Chapter 3)]3]).
The source of all freshwater is rainfall, most of which is held in the soil, and returns to the atmosphere (Atmospheric composition and structure) by evapotranspiration (green water). Globally, only 11 per cent of the freshwater flow is available as usable stream flow and groundwater that can be tapped for irrigation, urban and industrial use, potable and stock water (see Figure 3.1). Yet, nearly all investment goes into the management of the water withdrawn from streams and groundwater. While irrigated agriculture is overwhelmingly the biggest user of freshwater, and already draws substantially on groundwater that is not being replenished, it faces increasing competition from other claims (see Figure 4.4). To meet the Millennium Development Goal (MDG) of halving the proportion of people suffering from hunger by 2015, it will be necessary to manage freshwater resources from the moment that rainwater hits the land surface. This is where soil management determines whether rain runs off the surface, carrying topsoil with it, or infiltrates the soil to be used by plants or to replenish groundwater and stream flows.
Ecosystems and farming systems have adapted to water scarcity in various ways (see Table 3.5). Outside arid and semi-arid areas, absolute lack of water is not the issue; there is enough water to produce a crop in most years. For example in Eastern Africa, meteorological drought (a period when there is not enoughwater to grow crops because of much below average rainfall) happens every decade. Dry spells of 2–5 weeks in the growing season happen every 2–3 years[48]. Agricultural drought (drought in the root zone) is much more frequent, while political drought, where various failings are attributed to drought, is commonplace. Agricultural drought is more common than meteorological drought because, on cultivated land, most rainfall runs off the surface, and soil water storage is diminished by soil erosion, resulting in poor soil structure, loss of organic matter, unfavourable texture and impeded rooting. Farmers’ field water balances show that only 15–20 per cent of rainfall actually contributes to crop growth, falling to as little as 5 per cent on degraded land[49].
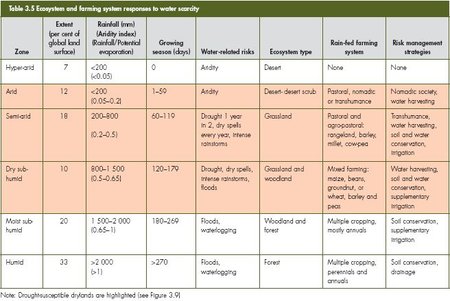 Table 3.5 Ecosystem and farming system responses to water scarcity[12].
 Rainfall may not be the main factor limiting crop production. Tracts of land also suffer from nutrient deficiency (see section on nutrient depletion). While commercial farmers maintain nutrient status by applying fertilizer, risk-averse subsistence farmers do not invest in overcoming other constraints unless the risk of drought is under control.
Irrigation is arguably the most successful insurance against drought. Irrigated land produces 30–40 per cent of global farm output, and a far higher proportion of high-value crops, from less than 10 per cent of the farmed area. Water withdrawals for irrigation have increased dramatically, to about 70 per cent of global water withdrawals (see Figure 4.4). One-tenth of the world’s major rivers no longer reach the sea during some part of the year, because water is extracted upstream for irrigation[50]. However, limits to the growth of irrigation are in sight, and much of further development is likely to be marginal in terms of returns on investment[51], and in terms of trade-offs against salinity (see section on Salinity) and ecosystem services.
Salinity
 Salinity induced by irrigation in the Euphrates basin in Syria. (Credit: Mussaddak Janat, Atomic Energy Commission of Syria)
 Soils, streams and groundwater in drylands contain significant amounts of naturally-occurring salt, which inhibits the absorption of water by plants and animals, breaks up roads and buildings, and corrodes metal. Soils containing more than 1 per cent soluble salt cover 4 million km2, or about 3 per cent of the land[52]. Salinity is defined by the desired use of land and water; it is salt in the wrong place when found in farmland, drinking and irrigation water, and in freshwater habitats. It is caused by inappropriate forms of land use and management. Irrigation applies much more water than rainfall and natural flooding and, nearly always, more than can be used by crops. The added water itself contains salt, and it mobilizes more salt that is already in the soil. In practice, leakage from irrigation canals, ponding because of poor land levelling and inadequate drainage raise the water table. Once the water table rises close to the soil surface, water is drawn to the surface by evaporation, further concentrating the salt, which may eventually create a salt crust on the soil surface.
Increasing water withdrawals for irrigation increase the likelihood of salinity (see Box 3.5) when there is inadequate drainage to carry the salt out of the soil. This is a threat to livelihoods and food security in dry areas, where most farm production is from irrigation and farmers use whatever water is available, however marginal, even on land with a high, saline water table. In the long run, this renders the land unproductive. Salinity will increase unless the efficiency of irrigation networks, in particular, is greatly improved.
|
Box 3.5 Irrigation and salinity in West Asia[53] |
|
Saline soils cover up to 22 per cent of the arable land in West Asia, ranging from none in Lebanon to 55–60 per cent in Kuwait and Bahrain. Salinity is increasing through both excessive irrigation and seawater intrusion into depleted coastal aquifers. Over the last 20 years, irrigated land in West Asia increased from 4,100 to 7,300 km2, raising food and fibre production, but at the expense of rangelands and non-renewable groundwater. Agriculture consumes 60–90 per cent of the accessible water, but contributes only 10–25 per cent of GDP in Mashriq countries, and 1–7 per cent in Gulf Cooperation Council countries. Generally, water is used inefficiently in flood and furrow irrigation systems, and for crops with high water demand. Field water losses, combined with leakage from unlined canals, exceed half of the water withdrawn for irrigation. In some areas, withdrawals are far greater than rates of recharge, and aquifers have been rapidly depleted. Yet, the main measures adopted have been largely limited to the introduction of costly sprinkler and drip irrigation systems. |
Dryland salinity, as distinct from irrigation-induced salinity, is caused by the replacement of natural vegetation with crops and pastures that use less water, so that more water infiltrates to the groundwater than before. The rising, saline groundwater drives more salt into streams, and, where the water table comes close to the surface, evaporation pulls salt to the surface.
Worldwide, some 20 per cent of irrigated land (450,000 km2) is salt-affected, with 2,500–5,000 km2 lost from production every year as a result of salinity[54]. In Australia, for example, the National Land and Water Resources Audit[55] estimated 57,000 km2 of land to be at risk of dryland salinity, and projected three times as much in 50 years. There is underlying concern about the inexorable increase in river water salinity driven by rising water tables; it is predicted that up to 20,000 kilometres of streams may be significantly salt-affected by 2050[56].
Disturbances in biological cycles
Water, carbon and nutrient cycles are the basis of life. The integrity of these cycles determines the health and resilience of ecosystems, and their capacity to provide goods-and-services. Agriculture depends on manipulating parts of these cycles, often at the expense of other parts of the same cycle. Links between the carbon cycle and climate change are now well established (see Box 3.6). While the burning of fossil fuels has greatly disturbed the carbon cycle, land-use change has been responsible for about one-third of the increase in atmospheric carbon dioxide over the last 150 years, mainly through loss of soil organic carbon. Also well established are the links between soil erosion and sediment deposition, between [[fertilizer]s] and eutrophication, and between emissions of sulphur and nitrogen oxides to the atmosphere (Atmospheric composition and structure) and acid contamination of land and water.
|
Box 3.6 Disturbances in the carbon cycle due to losses of soil organic matter[57] |
|
Land-use change over the past two centuries has caused significant increases in the emissions of CO2 and methane into the atmosphere. There are large uncertainties in the estimates, though, especially for soils. Clearance of forests causes a significant initial from deep aquifers to cumulonimbus clouds, and even loss of biomass, and, where native soil organic content is high, soil organic carbon declines in response to conversion to pasture and cropland. Under cultivation, soil organic matter declines to a new, lower equilibrium, due to oxidation of organic matter. Significant emissions also result from drainage of wet, highly organic [[soil]s] and peat, as well as from peat fires. Higher temperatures, for example associated with forest fires and climate change, increase the rate of breakdown of soil organic matter and peat. Half of the organic carbon in Canadian peatlands will be severely affected, and permafrost carbon is likely to be more actively cycled. Warming will also release significant stores of methane presently trapped in permafrost. While there has been a decline in the emissions from Europe and North America since the mid-20th century, emissions from tropical developing countries have been increasing, resulting in continued increases in overall global emissions due to land use change. The region of Asia and the Pacific accounts for roughly half of global emissions. |
Nutrient cycles:
Soil fertility and chemistry are closely interwoven. Many elements in the soil participate in cycles of plant nutrition and growth, decomposition of organic matter, leaching to surface water and groundwater, and transport to the oceans. Nitrogen and phosphorus are the nutrients required in largest amounts, and there is concern about both the prospects of continued availability of chemical supplements and the resulting disturbance of these cycles.
The tiny fraction of atmospheric nitrogen made available to biological cycles through natural fixation restricted plant production until the industrial production of nitrogen [[fertilizer]s] in the early 20th century. Today, the food security of two-thirds of the world’s population depends on fertilizers, particularly nitrogen fertilizer. In Europe, 70–75 per cent of nitrogen comes from synthetic fertilizers; at the global scale, the proportion is about half. Some nitrogen is also fixed by legumes, with the balance of nitrogen coming mostly from crop residues and manure. However, crops take up only about half of the applied nitrogen. The rest is leached into streams and groundwater, or lost to the atmosphere (Atmospheric composition and structure). Losses of nitrogen from animal wastes account for 30–40 per cent, half of this escaping into the atmosphere as ammonia. Very high emissions are recorded from the Netherlands, Belgium, Denmark and the province of Sichuan in China. Annual emissions of reactive nitrogen from combustion of fossil fuels amount to about 25 million tonnes[58].
Enhanced levels of reactive nitrogen are now found from deep aquifers to cumulonimbus clouds, and even in the stratosphere, where N2O attacks the ozone layer. There are concerns that elevated levels of nitrates in drinking water are a health hazard, particularly to very young children. Established evidence links enhanced concentrations of nitrates and phosphates to algal blooms in shallow lakes and coastal waters. Two of the largest blooms are in the Baltic Sea[59] and in the Gulf of Mexico, off the mouth of the Mississippi River[60]. Byproducts of the algae are toxic to animals, while the decomposition of these huge masses of organic matter depletes the oxygen dissolved in water, causing fish kills (see [[Chapter 4 (Global Environment Outlook (GEO-4): Chapter 3)]4]).
Acidifying cycles:
Oxides of carbon (CO2), nitrogen (NOx) and sulphur (SOx) are released to the atmosphere (Atmospheric composition and structure) by decomposing organic matter and burning fossil fuels (see [[Chapter 2 (Global Environment Outlook (GEO-4): Chapter 3)]3]). SOx are also produced by the smelting of sulphidic ores. Total emissions of SOx from human activities are about equal to natural production, but they are concentrated in northern mid-latitudes. Large areas of eastern North America, western and central Europe, and eastern China experience SOx deposition in the range of 10– 100 kg S/ha/yr. In addition, NOx deposition now exceeds 50 kg/ha/yr in central Europe and parts of North America.
As a result of such emissions, the pH of rainfall in polluted areas can be as low as 3.0–4.5. Where [[soil]s] are weakly buffered, this translates to more acid streams and lakes, associated with increased solubility of toxic aluminium and heavy metals. Since 1800, soil pH values have fallen by 0.5–1.5 pH units over large parts of Europe and eastern North America. They are expected to fall by a further pH unit by 2100[61]. Canada and Scandinavia have been most severely affected by acidic precipitation in recent decades, suffering loss of phytoplankton, fish, crustaceans, molluscs and amphibians. Emission controls and rehabilitation efforts have slowed or even reversed freshwater acidification in some areas[62]. The jury is still out on the forest decline predicted in the mid-1980s for Europe and North America, but acidification may be contributing to the biomass losses in boreal forests indicated in Figure 3.3. However, the risks of acidification from coal-powered industry are rising elsewhere, particularly in China and India.
Acidification is not just a problem arising from air pollution. Extreme cases develop when soils and sediments rich in sulphides are drained and excavated, for example, through the conversion of mangroves to aquaculture ponds or urban developments. In these acid sulphate soils, sulphuric acid produces pH values as low as 2.5, mobilizing aluminium, heavy metals and arsenic, which leak into the adjacent aquatic environment, causing severe loss of biodiversity[63].
Managing land resources
Chemical contamination and pollution
Increasing awareness of the negative effects of chemical contamination and pollution is leading to stringent regulations in many industrialized countries. Since the 1992 UN Conference on Environment and Development, the risks associated with chemicals and the transboundary movements of pollutants have been widely recognized. Chemicals management is now addressed by 17 multilateral agreements and 21 intergovernmental organizations and coordination mechanisms. The Basel Convention on the International Movement of Hazardous Wastes, the Rotterdam Convention on Certain Hazardous Chemicals in International Trade, and the Stockholm Convention on Persistent Organic Pollutants aim to control international traffic of hazardous chemicals and wastes that cannot be managed safely. Regional agreements include the Bamako Convention, which was adopted by African governments in 1991 and the European Union’s REACH (see Box 3.7).
|
Box 3.7 Soil protection from chemicals in the European Union[64] |
|
In the European Union, evaluation of the effects of chemical pollutants on soil communities and terrestrial ecosystems provides a basis for soil protection policy. The Soil Framework Directive will require member states to take appropriate measures to limit the introduction of dangerous chemicals to the soil, and to identify and remediate contaminated sites. The new REACH legislation (Registration, Evaluation, Authorisation and Restriction of Chemicals), that entered into force in June 2007, requires manufacturers and importers of chemicals to prove that substances in widely-used products, such as cars, clothes or paint, are safe, while the properties of chemicals produced or imported into the European Union have to be registered with a central agency. |
There has been a significant reduction in the use of some toxic chemicals, and safer alternatives are being identified. Voluntary initiatives, such as the chemical industry’s Responsible Care programme encourage companies to work towards continuous improvement of their health, safety and environmental performance. A number of major chemical industries have made significant reductions in their emissions.
A Strategic Approach to International Chemicals Management (SAICM) was agreed to by more than 100 environment and health ministers in Dubai in 2006, following the ninth Special Session of the UNEP Governing Council/Global Ministerial Environment Forum. It provides a non-binding policy framework for achieving the goal of the Johannesburg Plan of Implementation: that, by 2020, chemicals are produced and used in ways that minimize adverse effects on the environment and human health. This requires responsibility for and reductions in pollution. Chemicals and materials are to be selected for use on the basis of their non-toxicity, waste should be minimized, and products at the end of their useful life should re-enter production as raw materials for the manufacture of new products.
All these instruments depend on institutional capacity and political will. They are undermined by limited political commitment, legislative gaps, weak inter-sectoral coordination, inadequate enforcement, poor training and communication, lack of information, and failure to adopt a precautionary approach. (Until the 1990s, chemicals were considered "innocent" until proven "guilty"). While regulations to control environmental loadings have established maximum allowable limits for releases of certain chemicals, observed concentrations are often still much higher than the set limits. In addition, there are areas of uncertainty that argue for a precautionary approach. These areas of uncertainty include trigger mechanisms that may suddenly cause potentially toxic contaminants to become more harmful; triggers include a change of location, for instance through the rupture of a retaining dam, or change of chemical state, such as through oxidation of excavated materials.
Existing multilateral and regional agreements offer an opportunity to arrest and eventually reverse the increasing releases of hazardous chemicals. Prerequisites for success include:
- full integration of a precautionary approach in the marketing of chemicals, shifting the burden of proof from regulators to industry;
- development of adequate chemicals management infrastructure in all countries, including laws and regulations, mechanisms for effective enforcement and customs control, and capacity to test and monitor;
- substitution with less-hazardous materials, adoption of best available technologies and environmental practices, and easy access to these approaches for developing countries and countries with economies in transition;
- encouragement of innovation in manufacturing, non-chemical alternatives in agriculture, and waste avoidance and minimization; and
- inclusion of environmental issues related to chemicals in regular educational curricula, and in partnership processes between academia and industry.
Soil erosion
Widespread attempts to mitigate soil erosion have met with mixed success. National responses have been directed towards legislation, information, credits and subsidies, or specific conservation programmes. Local responses have been generated by land users themselves[65], or introduced by projects. At the technical level, there is a wealth of proven approaches and technologies, from improved vegetation cover and minimum tillage to terracing (see photos below). These useful experiences (both positive and negative) are not well documented. The World Overview of Conservation Approaches and Technologies network[66] aims to fill this gap through collection and analysis of case studies from different agro-ecological and socio-economic conditions. But the usual focus on technical aspects misses the more complex, underlying political and economic issues that must also be addressed, an issue already advocated since the early 1980s[67].
Substantial investment in soil conservation over past decades has yielded some local successes, but, except for conservation tillage (see Box 3.4), adoption of recommended practices has been slow and seldom spontaneous. A historic success story is the programme undertaken in the United States following the Dust Bowl in the 1930s, when drought triggered massive soil erosion in the US Midwest, and millions of people lost their livelihoods and were forced to migrate (see Box 3.8). The way the issue was handled provides an object lesson and inspiration for today. The clear message is that effective prevention and control of soil erosion needs knowledge, forceful social and economic policy, well-founded institutions maintaining supporting services, involvement of all parties, and tangible benefits to the land users. Nothing less than the whole package, continuing over generations, will be effective (see Box 3.10 and the section on responses to desertification).
|
Box 3.8 The success story of the Dust Bowl[68] |
|
In the United States in the late 1920s, good crop yields and high prices for wheat encouraged a rapid increase in the cropped area. When drought hit in the following decade, there was catastrophic soil erosion, and many were driven from the land; by 1940, 2.5 million people had left the Great Plains. During the 1930s, the US Government responded with a comprehensive package of measures, both to give short-term relief, mitigating economic losses, and providing for long-term agricultural research and development. Examples of these initiatives include:
As a result of this long-term, comprehensive package of responses, natural, social, institutional and financial capital has been rebuilt. Combined with the good use of science and technology, subsequent droughts have been ridden out and the US Midwest is now a prime agricultural region. |
Nutrient depletion
There is no remedy for [[soil]s] that are deficient in nutrients other than adding the necessary inputs. Efforts to improve soil fertility have focused on the replenishment of nutrients by the judicious use of inorganic [[fertilizer]s] and organic manure. This has been very successful in many parts of the world, and is responsible for a very large increase in agricultural production. Yields may be doubled or tripled on a sustained basis by even modest application of fertilizer[69]. In Niger, for instance, sorghum yields without fertilizer (about 600 kg/ha) were doubled by application of 40 kg/ ha of nitrogen fertilizer[70]. However, the use of inorganic fertilizers requires cash, which can be an insurmountable barrier for most smallholders in developing countries, where inputs are rarely subsidized.
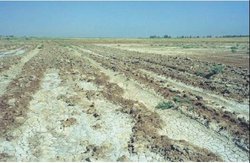
 Soil and water management measures against erosion and water scarcity. Left: Micro-basins; Centre: Mulch; Right: Conservation tillage. (Credit: WOCAT)
 There are myriad indigenous practices to mitigate nutrient constraints, such as bush fallow, biomass transfer to home fields, and adding compost and manure on favoured plots. However, these are failing to keep up with production needs in the face of increasing population pressure, and lack of adequate funds for labour or mechanization. In recent years, significant research efforts have focused on biological processes to optimize nutrient cycling, minimize external inputs and maximize nutrient use efficiency. Several techniques have been developed, including the integration of multipurpose legumes, agroforestry and improved fallows, but scientific breakthroughs and large-scale adoption by small-holder farmers are yet to materialize.
Nutrient depletion is not the same everywhere, because it depends on a series of interacting causes, and depletion processes are different for different nutrients. There is a need for much better spatial information at [[region]al] and local scales, and for better soil management technologies to improve responses. Techniques to reduce nutrient depletion and enhance soil fertility vary, depending on the [[soil]s] and farming systems. Improved soil management, including rotation of annual with perennial crops, and the integration of trees into farming systems, can improve the efficiency of nutrient cycling by maintaining the continuity of uptake, and reducing leaching losses. Nitrogen stocks can be maintained through biological nitrogen fixation (by integrating legumes into cropping systems), but nitrogen fixing is limited by available phosphorus, which is very low in many tropical soils. For severely nutrient-deficient soils, there is no remedy other than additions from outside sources.
Water scarcity
Achieving the MDG on reducing hunger will require an increase of 50 per cent in water use by agriculture by 2015, and a doubling by 2050, whether by farming more land or by withdrawing more water for irrigation[71]. For developing countries, FAO[72] projects an increase of 6.3 per cent in rainfed cropland area between 2000 and 2015, and of 14.3 per cent by 2030. It also projects an increase in irrigated area of almost 20 per cent from 2000 to 2015, and to just over 30 per cent by 2030. Large dams continue to be built, because they promise certainty of supply of water and power to downstream interests, but the same investment has not gone into the catchments that supply the water. On the contrary, the last 20 years have seen continued squandering of the green water resource through soil erosion, and higher rates of run-off, which has increased floods at the expense of base flow. This has also resulted in siltation of reservoirs, such as those behind the Victoria Dam on the Mahaweli River in Sri Lanka[73] and the Akasombo Dam on the Volta River in Ghana[74].
While irrigated yields will always be higher than rain-fed yields, there is much scope for improving rain-fed farming on vast areas. In Africa, average cereal yields range from 0.91 tonnes/ha in Western Africa to 1.73 tonnes/ha in Northern Africa[75], while commercial farmers operating in the same soil and climatic conditions achieve 5 tonnes/ha or more. Established, though incomplete evidence, suggests that two-thirds of the necessary increase in production needed from rain-fed farming can be achieved through better rain-use efficiency[76]. Analysis of more than 100 agricultural development projects[77], found a doubling of yields in rain-fed projects, compared with a 10 per cent increase for irrigation (see Box 3.9).
|
Box 3.9 Gains can be made through better water use efficiency[78] |
|
Low yields with sparse ground cover result in a large, unproductive loss of water by run-off and evaporation from bare soil. In semi-arid areas, doubling of yield from 1–2 tonnes/ha may increase water productivity from 3 500 m3/tonne of grain to 2 000 m3/tonne. Improvements in water use efficiency may be achieved in various ways, some of which are illustrated, under responses to soil erosion.
|
More crop production means more water use by crops, whether through irrigation or increase in the cropped area. However, established evidence also shows that investment in water productivity – achieving more crop per drop – can help maintain water supply downstream[79], and appropriate land use and soil management can increase groundwater recharge and stream base flow[80].
Responses to water scarcity have focused on runoff management, water abstraction, and demand management. New policies need to focus on rainwater management, and address the competing claims on water resources. In practice, a package of mutually supporting measures and concerted action from interested parties should include:
- capacity building for land and water management institutions;
- investment in education, and training of land and water managers; and
- a mechanism to reward land users for managing water supply at the source, involving payments for environmental services[81].
Salinity
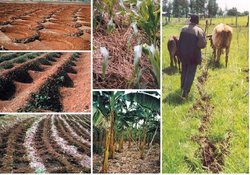
 The investment in the management and improvement of irrigation networks has rarely been commensurate with the capital investment in water distribution. (Credit: Joerg Boethling/Still Pictures)
 FAO and regional organizations have established collaborative programmes to reduce water losses from canals, match field application with the needs of the crop and drain surplus water to arrest rising water tables[82]. However, investment in management and improvement of irrigation networks, especially in drainage and on-farm water use, has rarely been commensurate with the capital investment in water distribution.
Dryland salinity is caused by changes in the hydrological balance of the landscape, which are driven as much by fluctuations in rainfall as by land-use change. Piecemeal tree planting and crop management to reduce groundwater recharge has no chance of arresting groundwater flow systems that are orders of magnitude bigger. In both cases, successful intervention depends on information on the architecture and dynamics of groundwater flow systems[83], and the technical capacity to act on this information. As with soil erosion, a focus on technical issues has diverted attention from wider issues of water rights and payments, the need for capacity building in managing institutions, and implementation of national and transboundary agreements. Salinity is sometimes only a symptom of underlying failures in management of common resources.
Disturbances in biological cycles
The excess of nutrients in regions such as Europe and North America has prompted the setting of legal limits on the application of manure and [[fertilizer]s]. For instance, under the EU Nitrate Directive (Council Directive 91/676/EEC), the application of nitrate fertilizers has been restricted in some areas susceptible to groundwater pollution by nitrates. An evaluation 10 years after the directive went into force concluded that some farm practices have positive effects on water quality, but emphasized that there is a considerable time lag between improvements at farm level and measurable improvements in water quality[84].
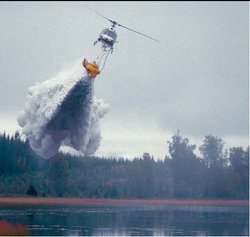 Helicopter spreading lime over an acidified lake in Sweden. (Credit: Andre Maslennikov/Still Pictures)
 The reductions in acid gas emissions in Europe and North America has been one of the success stories of recent decades. It involved domestic regulations, innovations by some industries and international coordination (see mainly [[Chapter 2 (Global Environment Outlook (GEO-4): Chapter 3)]4]). This included agreements such as the 1979 UN/ECE Convention on Large Transboundary Air Pollution and the Canada-US Air Quality Agreement. The ECE convention adopted the concept of critical loads in 1988, and the Gothenburg Protocol in 1999 regulated emissions of SOx and NOx, defining critical loads according to best current evidence.
Global emissions of SO2 were reduced by about 2.5 per cent between 1990 and 2000[85], as a result of clean air acts promoting a switch to cleaner fuels and flue gas desulphurization, and the demise of heavy industries, particularly in Eastern Europe and the former Soviet Union. However, many areas still receive acid deposition well in excess of critical loads (for example, Nepal, China, Korea and Japan) and total global emissions are rising again, driven by newly industrialized countries (see Figure 2.8). China alone accounts for about one-quarter of global SO2 emissions[86], and its coal-fired industrial development is likely to significantly increase acid emissions[87]. Long-term liming programmes are in place in several countries to mitigate enhanced acidic inputs into inland waters.
When it comes to controlling acid soil drainage, only Australia has enacted specific planning regulations to prevent the formation of acid sulphate soils. Any response to acid sulphate drainage from mines and soil has usually been restricted to liming of the acidified soil or spoil heaps but Trinity Inlet in North Queensland, Australia, provides a recent example of remediation through controlled restoration of tidal flooding, whereby existing acidity is neutralized by tidewater, and re-establishment of a tidal regime stops further acid generation[88].
Desertification
Extent and impacts
Desertification occurs when individual land degradation processes, acting locally, combine to affect large areas of drylands. As defined by the UN Convention to Combat Desertification (UNCCD), desertification is land degradation in arid, semi-arid and dry sub-humid areas resulting from various factors, including climatic variations and human activities[89]. It is most sharply expressed in poor countries where intertwined socio-economic and biophysical processes adversely affect both land resources and human wellbeing. Drylands cover about 40 per cent of the Earth’s land surface (see Figure 3.9) and support 2 billion people, 90 per cent of them in developing countries[90]. But desertification is not confined to developing countries; one-third of Mediterranean Europe is susceptible[91] as well as 85 per cent of rangelands in the United States[92]. (See [[Chapter 7 (Global Environment Outlook (GEO-4): Chapter 3)]2] for more information on issues related to drylands).
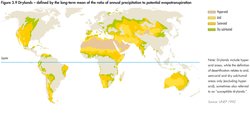 Fig 3.9 Drylands - defined by the long term mean of the ratio of annual precipitation to potential evapotranspiration[13].
 Desertification endangers the livelihoods of rural people in drylands, particularly the poor, who depend on livestock, crops and fuelwood. Conversion of rangelands to [[cropland]s] without significant new inputs brings about a significant, persistent loss of productivity and biodiversity, accompanied by erosion, nutrient depletion, salinity and water scarcity. In 2000, the average availability of freshwater for each person in drylands was 1,300 m3/year, far below the estimated minimum of 2,000 m3/year needed for human well-being, and it is likely to be further reduced[93]. Measured by indicators of human well-being and development, dryland developing countries lag far behind the rest of the world. For instance, the average infant mortality rate (54 per thousand) is 23 per cent higher than in non-dryland developing countries and 10 times that of industrialized countries.
The seriousness of the issue is recognized by the UNCCD, the Convention on Biological Diversity (CBD) and the UN Framework Convention on Climate Change (UNFCCC). The New Partnership for Africa’s Development also stresses the need to combat desertification as an essential component of poverty-reduction strategies. However, investment and action to combat desertification have been held back by the isolation of drylands from mainstream development, and even by controversy over the use of the term. Debate about desertification has been fuelled by alarming articles in the popular media about "encroaching deserts," reinforced by a series of droughts from the 1960s through the 1980s[94].
Desertification is determined by various social, economic and biophysical factors, operating at local, national and regional scales[95]. A recurring combination embraces national agricultural policies, such as land redistribution and market liberalization, systems of land tenure that are no longer suited to management imperatives, and the introduction of inappropriate technologies. Usually, the direct cause has been the expansion of cropping, grazing or wood exploitation. National and local policies to promote sustainable practices must take account of a hierarchy of drivers, from the household to the international level. This can be difficult where the indirect drivers, such as global trade imbalances, seem remote from these marginal lands, and when mechanisms for bottom:up decisionmaking are poorly developed.
Desertification is a continuum of degradation, crossing thresholds beyond which the underpinning ecosystem cannot restore itself, but requires ever greater external resources for recovery. Resilience is lost when a disturbance, which a system used to be able to absorb, tips the system to a less desirable state from which it cannot easily recover[96]. Loss of ecosystem resilience is often accompanied by a breakdown in social resilience and adaptive capacity, when vulnerable people are forced to draw on limited resources with diminished coping strategies[97]. For example, loss of resilience of parklands (integrated tree-crop-livestock systems) may result when the trees are cleared, exposing the land to erosion. Adaptive management aims to prevent ecosystems from crossing these thresholds by maintaining ecosystem resilience as opposed to seeking only narrow, production or profit objectives[98].
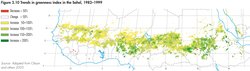 Fig 3.10 Trends in greenness index in Sahel, 1982-1999[14].
 Although indicators of desertification have been proposed ever since the term was introduced[99], lack of consistent measurement over large areas and over time has prevented reliable assessment. Over the long term, ecosystems are governed by slowly-changing biophysical and socioeconomic factors. Measurable indicators for these slow variables (such as changes in woody vegetation cover and soil organic matter) better characterize the state of ecosystems than fast variables (such as crop or pasture yields), which are sensitive to short-term events. No systematic national or global assessment of desertification has been made using measurement of slow variables. Some areas thought to have been permanently degraded during droughts have subsequently recovered, at least in terms of the amount of green vegetation, although species composition may have changed. For instance in the Sahel, coarse resolution satellite data show significant greening during the 1990s, following the droughts in the early 1980s (see Figure 3.10). This can be explained by increased rainfall in some areas but not in others; [[land-use change]s] as a result of urban migration and improved land management may have played a part[100]. Systematic, interdisciplinary approaches are needed to provide more clarity and empirical evidence, which should enable more focused and effective interventions.
The argument that regional climate is affected by desertification through reduction in vegetation and soil water retention, and by the generation of dust[101], remains speculative. Desert dust has long-range impacts, both good and bad. It is a global fertilizer, as a source of iron and possibly phosphorus, contributing to the farmlands and forests of Western Africa[102], the forests of the northeast Amazon Basin and Hawaii[103], and the oceans[104]. However, it has also been linked to toxic algal blooms, negative impacts on coral reefs, and respiratory problems[105]. Generally, dust from degraded farmland probably contributes less than 10 per cent to the global dust load[106]. Natural processes create about 90 per cent of dust in areas like northern Chad and western China[107].
Combating desertification
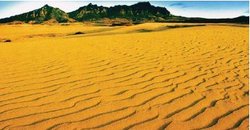 Sand encroachment and land reclamation in China, 2000; right, 2004. (Credit: Yao Jianming)
 The international response to desertification has been led since 1994 by UNCCD, which has been ratified by 191 countries. It has evolved as a process seeking to integrate good governance, involvement of non-governmental organizations (NGOs), policy improvement, and the integration of science and technology with traditional knowledge. National action programmes have been drawn up by 79 countries, there are nine sub-regional programmes targeting transboundary issues and three [[region]al] thematic networks[108]. Activities are now moving beyond awareness-raising and programme formulation to providing the financial resources for and implementing land reclamation projects (see sections on Africa and West Asia in [[Chapter 6 (Global Environment Outlook (GEO-4): Chapter 3)]3]). Starting much earlier, a national effort in reclamation of the severely degraded Loess Plateau in China now shows up in the Global Assessment of Land Degradation and Improvement as a 20-year trend of increasing biomass, in spite of a decrease in rainfall across the region during the same period[109]. In China in the 1990s, about 3,440 km2 of land was affected annually by sand encroachment. Since 1999, 1,200 km2 has been reclaimed annually[110].
Desertification is a global development issue, driving an exodus from the regions affected, yet policy and action are becalmed by uncertainty about the nature and extent of the problem, and about what policies and management strategies will be effective in different settings. Rigorous, systematic studies of the processes of desertification and the effects of intervention at different scales and different settings are urgently needed to guide future efforts. There is a great need to build local technical and management capacity (see Box 3.10) and applied science needs to focus on resolving the uncertainties that are impeding action, and on integrating science and technology with local knowledge to improve rigour in assessment, monitoring and adaptive learning.
|
Box 3.10 Responses needed to deal with desertification[111] |
|
Responses to desertification have focused on drought, shortfalls of food and the death of livestock, aspects that reflect inherently variable climatic cycles. Experience shows that policy and action must address long-term issues by combining a number of elements. 1. Direct action by governments
2. Engagement of the public and private sectors
3. Develop economic opportunities and markets
|
Challenges and Opportunities
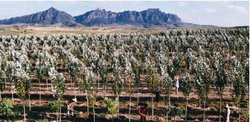 Sand encroachment and land reclamation in China, 2004, planted with Xinjiang poplar (Populus alba). (Credit: Yao Jianming)
 Since the publication of Our Common Future (the Brundtland Commission report), economic growth has led to improvement of the environment in many ways, for instance by enabling investment in better technologies and some conspicuous improvements in developed countries. But many global trends are still strongly negative.
In the face of mounting evidence that much present development is unsustainable, global attention has focused on national strategies to promote sustainable development, foreshadowed at UNCED. The UN General Assembly Special Session Review Meeting in 1997 set a target date of 2002 for the introduction of such strategies. However, effective responses are still held back by limited access to information, inadequate institutional capacity faced with complex land-use issues, and the absence of broad participation or ownership of the responses. Future costs to others can be offset only by political cost to decision-makers now. Sustainability strategies need to be backed up by research to provide reliable data on biophysical, economic and social indicators of long-term change, and they require development or adaptation of technologies appropriate to local circumstances. Strategies that are environment-driven, rather than focusing on sustainable development, rarely command the support needed to put them into action[112]. A successful approach deals not only with the environment, but also with the connections between environment and the economic and social issues to which people relate. For example, watershed development plans are being implemented in many places to secure water supplies and to protect hydropower facilities, and many multistakeholder projects on sustainable use of biosphere and forest reserves, some of which take account of the rights and needs of indigenous peoples.
The outlook to 2050 sees the emergence of two major sets of land-related challenges: dominating trends that are largely unavoidable, and caveats of risks that are very unpredictable, but which have serious implications for society that warrant precautions.
Challenges: Dominant land-use trends
Competing claims on the land
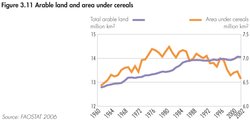 Fig 3.11 Arable land and area under cereals[15].
 Given projections that the world’s population will increase to over 9 billion by 2050, and to meet the MDG on hunger, a doubling of global food production will be required. In addition, a continuation of the shift from cereal to meat consumption, combined with overconsumption and waste, will increase food demand to between 2.5 and 3.5 times the present figure[113]. Yet, the production of cereals per person peaked in the 1980s and has since slowly decreased despite the increase in average yields. Reasons may include agricultural policies in regions of surplus, such as the European Union, ceilings to current technology, loss of farmland through land degradation and the growth of cities and infrastructure, and market competition from other land uses (Figure 3.11).
Our capacity to meet these future agricultural demands is contested. The main biophysical constraints are related to water, nutrients and land itself. Water scarcity is already acute in many regions, and farming already takes the lion’s share of water withdrawn from streams and groundwater. Other claims on water resources are growing, particularly for urban water supplies (see section on Water scarcity).
Increases in production over recent decades have come mainly from intensification rather than from an increase in the area under cultivation. Intensification has involved improved technologies, such as plant breeding, [[fertilizer]s], pest and weed control, irrigation, and mechanization; global food security now depends to a large extent on fertilizers and fossil fuels. Limits to current technologies may have been reached in mature farming systems, where they have been applied for several decades, and yields may have peaked. While there is land in poor countries that could respond to such technologies, most smallholders cannot afford fertilizers now, and the prices are being driven up by rising energy costs and the depletion of easily exploited stocks of phosphate. Food production is also constrained by the competing claims of other land uses, not least for maintenance of ecosystem services, and large areas may be reserved for conservation.
There is consensus that climate change over the next 20 years will affect farm production, with many regional differences in impacts. Changes may increase water requirements of crops, and increasing rainfall variability may exacerbate water scarcity in drylands[114]. Quantifying the current biological production for human consumption requires better estimates of global productivity of agricultural, grazed and human-occupied lands[115]. In the face of current uncertainty, it would be prudent to conserve good farmland, counteract tendencies of overconsumption, and undertake further needed research.
Bioenergy production
In most global energy scenarios that meet stringent carbon emissions constraints, biofuel is assumed to be a significant new source of energy. The World Energy Outlook 2006[116] forecasts an increase in the area devoted to biofuels from the current 1 per cent of cropland to 2–3.5 per cent by 2030 (when using current technologies). A major shift in agricultural production from food to biofuel presents an obvious conflict, which is already reflected in the futures market for food grains[117]. Forest products and the non-food cellulose component of food crops have a huge potential as an energy source, but technologies are still too costly to compete with fossil fuels at current prices, and the non-food component of crops also has a vital role in maintaining soil organic matter status.
Urbanization and infrastructure development
Half the world population now lives in urban areas, with positive and negative implications for the environment and human well-being. Densely populated cities use less land than do sprawling suburbs, they are easier to serve with public transportation, and can be more efficient in energy use, such as for transport and heating, and for waste reduction and recycling. The construction of housing and infrastructure in rural areas is often in conflict with other land uses, such as agriculture, recreation and other ecosystem services, particularly in rapidly industrializing countries[118].
However, cities are often built on prime farmland, and nutrients are being transferred from farms to cities with little or no return flow. The concentration of excrement and waste from food is often a source of pollution as well as a waste of resources. Urban areas become the source of sewage flows, run-off and other forms of waste that become environmental problems, often affecting the surrounding rural areas, as well as degrading water quality.
Challenges: Unpredictable risks to land
Tipping points
Tipping points occur when the cumulative effects of steady environmental changes reach thresholds that result in dramatic and often rapid changes. There is concern that a number of environmental systems may be heading toward such tipping points. One example is the bi-stability of the Amazon Basin, implying the possibility of a flip from a current wet phase to a dry phase, with profound implications beyond the basin[119]. Another very different tipping point with global implications might be simultaneous crop failures in different regions.
Runaway carbon cycle
The global carbon cycle is by no means fully understood. The missing sink for forty per cent of known carbon dioxide emissions is generally thought to be terrestrial ecosystems[120]. Vast areas of peat and tundra are reservoirs of stored organic carbon (one-third of all terrestrial organic carbon is peat) and methane, and they continue to fix carbon. With global warming, there is a risk of unexpected sudden increases in the atmospheric (Atmospheric composition and structure) levels of carbon dioxide, if these sinks become saturated. The peat and tundra areas might transform from being a sink of carbon to become sources of greenhouse gases[121].
Eutrophication
Rivers, lakes and coastal waters receive large amounts of nutrients from the land, and overloading of nutrients often results in algal blooms. If this increases in intensity and frequency, whole ecosystems may be subject to hypoxia (dead zones due to lack of oxygen) as seen already in the Gulf of Mexico[122] and the Baltic Sea[123].
Breakdown of governance, conflict and war
Land-use changes are usually associated with gains in livelihoods, income opportunities, food security or infrastructure. Illegal operations do not yield these longterm benefits, so good governance is vital to protect long-term values from short-term exploitation. Areas of exceptional environmental value, such as tropical rain forest and wetlands, as well as boreal forests, are in special need of strong structures of governance. War and civil conflict are always associated with rapid and far-reaching destruction of environmental values.
Opportunities to tackle these challenges
While the dominant trends are driven by demography, the global state of the environment and decisions already taken, there are several opportunities to steer or oppose them, not least by harnessing existing knowledge. [[Chapter 7 (Global Environment Outlook (GEO-4): Chapter 3)]3] analyses successful strategies that offer opportunities for reducing human vulnerability, Chapter 8 (Global Environment Outlook (GEO-4): Chapter 3) goes further into biophysical and societal interlinkages that offer opportunities for more effective policy responses and Chapter 10 (Global Environment Outlook (GEO-4): Chapter 3) summarizes a range of innovative approaches to help improve responses. Some land-specific opportunities are described below.
Precision farming
Precision farming refers to optimizing production through site-specific choices of crop varieties, fertilizer placement, planting and water management, taking advantage of the variability of soil and terrain in a field rather than ignoring it. It is also describes the automation of techniques employed to do this, such as recording crop yields with a continuously recording monitor. However, the principle can be applied equally to low capital-input farming, where crops are intensively managed, manually: water harvesting is an example. Precise monitoring of crop performance will enable farmers to economize on their inputs in terms of labour, water, nutrients and pest management. The advent of reliable and inexpensive electronic devices offers the opportunity to extend advanced, information based agriculture to new areas. Barriers to the wider application of precision farming include the scarcity and high cost of subtle management skills compared with using chemical inputs, and, among poor farmers, insecure tenure, lack of credit and low farm-gate prices.
Multifunctional landscapes
Agroforestry is one of several promising developments that can simultaneously generate livelihoods and preserve environmental quality. Successful examples include palm oil production in semi-natural rain forests, and gum arabic production in drylands. Carbon fixation through land management is another opportunity. Since fixing carbon by planted forests is eligible for trading under the Kyoto Protocol, most attention has been directed towards capturing carbon by forests and storing it as the standing crop. But carbon can also be stored in the longer term as soil organic matter, which is a much larger and more stable pool of carbon. At the same time, it would contribute to more sustainable agriculture by increasing resistance to erosion, add to water and nutrient reserves in the soil, and increase infiltration capacity. Low capital input farming systems may have a higher potential for net carbon accumulation than intensive forms of agriculture, where the inputs (such as fertilizer and energy) are associated with high carbon costs[124]. Putting organic carbon back into soils, where it will be useful, is a challenge to soil science and management.
Uptake of agroforestry has slowly increased in recent years, and further development may be expected if soil carbon is recognized as an eligible sink by climate change legislation. Other market mechanisms, such as Green Water Credits for water management services in farmed landscapes, would be required to promote such multifunctional landscapes.
Ecosystem mimicry
Multiple cropping in the same field is well established in small-holder farming systems. However, very complex multi-layered perennial cropping systems, such as the Kandyan home gardens in Sri Lanka, demand rare skills and knowledge[125]. Such biologically diverse systems provide both high productivity and better insurance against the risks of erosion, weather, pests and disease. Aquaculture is an important contribution to the world protein supply, but is often associated with high environmental costs and risks. One option to reduce the negative impact on aquatic ecosystems is to transfer such schemes to land, where tanks or reservoirs might be better suited for cultivation of protein[126]. There is also rich experience of fish and shrimp production in rice paddies[127].
Crop breeding
One area with significant potential, but which is contested in several aspects, is the development and use of genetically modified (GM) crops[128]. In contrast to the development of Green Revolution crops, the development of GM crops is almost exclusively privately funded, and focuses on crops with commercial potential. There are several sources of uncertainty, including unwanted environmental impacts, social acceptance of the technologies and their agronomic potential. Currently, there is polarization between proponents of the technology, mainly from the fields of genetics and plant physiology, and sceptics, mainly from the fields of ecology and environmental sciences. Outcomes to date mainly concern crop traits related to herbicide tolerance and resistance to pests. These may be significant, because losses due to insect pests have been estimated at about 14 per cent of total global farm production[129]. Negatives include higher costs to farmers, dependency on big companies and specific agrochemicals, and the fact that, over time, cross-fertilization will mean that there will be no non-GM crops.
As an alternative to introducing new genes into crop species, the new technology of marker-assisted selection assists the location of desirable traits in other varieties, or in wild relatives of existing crops, which can then be cross-bred in the conventional way to improve the crop, halving the time required to develop new plant varieties[130] and avoiding the possible harm associated with GM crops. However achieved, salt- and drought-tolerance would be valuable for increasing food security in drylands, but we are far from understanding the mechanisms of such adaptations, let alone operational seed technologies[131].