Ecosystems and Human Well-Being: Volume 1: Current State and Trends: Food Ecosystem Services

This is Chapter 8 of the Millenium Ecosystem Assessment report Ecosystems and Human Well-Being: Volume 1: Current State and Trends
Coordinating Lead Authors: Stanley Wood, Simeon Ehui
Lead Authors: Jacqueline Alder, Sam Benin, Kenneth G. Cassman, H. David Cooper, Timothy Johns, Joanne Gaskell, Richard Grainger, Sandra Kadungure, Joachim Otte, Agnes Rola, Reg Watson, Ulf Wijkstrom, C. Devendra
Contributing Authors: Nancy Kanbar, Zahia Khan, Will Masters, Sarah Porter, Stefania Vannuccini, Ulrike Wood-Sichra
Review Editors: Arsenio M. Balisacan, Peter Gardiner
Main Messages
Despite the fact that food production per capita has been increasing globally, major distributional inequalities exist. Global food production has increased by 168% over the past 42 years. The production of cereals has increased by about 130%, but that is now growing more slowly. Nevertheless, an estimated 852 million people were undernourished in 2000–02, up 37 million from the period 1997–99. Of this total, nearly 96% live in developing countries. Sub-Saharan Africa, the region with the largest share of undernourished people, is also the region where per capita food production has lagged the most.
Rising incomes, urbanization, and shifting consumption patterns have increased per capita food consumption in most areas of the world. Food preferences, including those arising from cultural differences, are important drivers of food provision. As incomes have increased in regions such as East and Southeast Asia, so has demand for high-value products such as livestock and fish, but cereals are likely to remain the major single component of global diets and to occupy the predominant share of cultivated land.
A diverse diet, with sufficient protein, oils and fats, micronutrients, and other dietary factors is as important for well-being as access to and consumption of sufficient calories. Average daily energy (calorific) intake has declined recently in the poorest countries. Inadequate energy intake is exacerbated by the fact that poor people tend to have low-quality diets. The world’s poorest rely on starchy staples for energy, which leads to significant protein, vitamin, and mineral deficiencies. Overconsumption is also a health problem. Nutritional status and children’s growth rates improve with consumption of greater food diversity, particularly of fruits and vegetables.
A global epidemic of diet-related obesity and noncommunicable disease is emerging as increasingly urbanized people adopt diets that are higher in energy and lower in diversity in fruits and vegetables than traditional diets (known as the nutrition transition). Many countries now face the double burden of diet-related disease: the simultaneous challenges of significant incidence of acute, communicable diseases in undernourished populations and increasing incidence of chronic diseases associated with the overweight and obese.
An increasing number of people everywhere suffer from diseases caused by contaminated food. As the world eats more perishable foods such as meat, milk, fish, and eggs, the risk of food-borne illnesses is increasing. The relative health risks from food vary by climate, diet, income, and public infrastructure. Food of animal origin poses health risks particularly when it is improperly prepared or inadequately refrigerated. Microbial contamination is of special concern in developing countries. Non-microbial contaminants include metals and persistent organic pollutants. Other growing health concerns related to food production are diseases passed from animals to humans (zoonoses), toxin-containing animal wastes, and overuse of antibiotics in livestock production that may cause allergies or render human antibiotics less effective.
Local food production is critical to eliminating hunger and promoting rural development in areas where the poor do not have the capacity to purchase food from elsewhere. The number of food-insecure people is growing fastest in developing regions, where underdeveloped market infrastructures and limited access to resources prevent food needs from being satisfied by international trade alone. In these areas, local food production is critical to eliminating hunger and providing insurance against rising food prices. In addition, rural households gain income and employment from engaging in food provision enterprises. In sub-Saharan Africa, two thirds of the population relies on agriculture or agriculture-related activities for their livelihoods.
Maintaining a focus on raising the productivity of food production systems continues to be a priority for both global food security and environmental sustainability. While major cereal staples are likely to continue as the foundation of the human food supply, some doubts are being raised about our ability to reproduce past yield growth in the future—especially with regard to sustaining rates of yield growth in high-productivity systems that are already producing near the yield potential threshold, as well as in terms of the availability of land that is suitable for sustaining expanded food output needs.
Government policies are significant drivers of food production and consumption patterns, both locally and globally. Investments in rural roads, irrigation, credit systems, and agricultural research and extension serve to stimulate food production. Improved access to input and export markets boosts productivity. Opportunities to gain access to international markets are conditioned by international trade and food safety regulations and by a variety of tariff and non-tariff barriers. Selective production and export subsidies, including those embodied in the European Union’s Common Agricultural Policy and the U.S. Farm Bill, stimulate overproduction of many food crops. This in turn translates into relatively cheap food exports that benefit international consumers at the expense of domestic taxpayers and has often undermined the ability of food producers in many poorer countries to enter international food markets.
The accelerating demand for livestock products is increasingly being met by intensive (industrial or so-called landless) production systems, especially for chicken and pigs, and especially in Asia. These systems have contributed to large increases in production: over the last decade, bovine and ovine meat production increased by about 40%, pig meat production rose by nearly 60%, and poultry meat production doubled. However, intensified livestock production poses serious waste problems and puts increased pressure on cultivated systems to provide feed inputs, with consequent increased demand for water and nitrogen fertilizer.
Per capita consumption of fish is increasing, but this growth is unsustainable with current practices. Total fish consumption has declined somewhat in industrial countries, while it has doubled in the developing world since 1973. Demand has increased without corresponding increases in supply productivity, leading to increases in the real prices of most fresh and frozen fish products at the global level. Pressure on marine ecosystems is increasing to the point where a number of targeted stocks in all oceans are near or exceeding their maximum sustainable levels of exploitation, and world fish catches have been declining since the late 1980s due to overexploitation. Inland water fisheries (Fisheries and aquaculture) in the developing world are expanding slowly and will remain an important source of high-quality food for many of the world’s poor, particularly in Africa and Asia; however, habitat modifications and water abstraction threaten the continued supply of freshwater fish. For the world as a whole, increases in the volume of fish consumed are made possible by aquaculture, which in 2002 is estimated to have contributed 27% of all fish harvested and 40% of the total amount of fish products consumed as food. Future growth of aquaculture will be constrained by development costs and by fishmeal and oil supplies, which are increasingly scarce.
Wild foods are locally important in many developing countries, often bridging the hunger gap created by stresses such as droughts and civil unrest. In addition to fish, wild plants and animals are important sources of nutrition in some diets, and some wild foods have significant economic value. In most cases, however, wild foods are excluded from economic analysis of natural resource systems as well as official statistics, so the full extent of their importance is improperly understood. In some cases, plants and animals are under pressure from unsustainable levels of harvesting, and there is a local need for conservation of wild food resources to satisfy the nutritional needs of those who do not have access to agricultural land or resources.
8.1 Introduction
The initial use and subsequent transformation of ecosystems for the purpose of meeting human food needs has been a vital, longstanding, and, for the most part, fruitful dimension of the human experience. The provision, preparation, and consumption of food are daily activities that for most societies represent an important part of their identity and culture. But while human ingenuity has transformed the specter of global famine into an unparalleled abundance of food, there are still too many people in the world for whom an adequate, safe, nutritious diet remains an illusion.
Before dealing squarely with the remaining inequities in food distribution and access, as well as the environmental damage often associated with the provision of food, the first and foremost fact is that our ability to provide sufficient food and to do so in increasingly cost-effective ways has been a major human and humanitarian achievement. It is all the more remarkable given that the past 50 years have seen the global population (Population growth rate) double, adding more mouths to be fed than existed on the planet in 1950. And according to most projections, it appears likely that growing food needs can be met in the foreseeable future, notwithstanding a growing list of technological, distributional, food safety, and health issues that require serious attention and action (Bruinsma 2003; Runge et al. 2003).
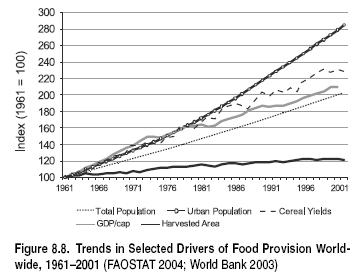
Figure 8.1 illustrates the trend in a number of key indicators of food provision. The most significant trend is the growth in food output from 1961 to 2003, increasing by over 160%, or 1.7% per year. As a consequence, average food production per capita also increased by around 25% during the period. Fueling this output growth in many parts of the world were long-term investments in the generation and distribution of new seeds and other farming technologies, and in infrastructure such as irrigation systems and rural roads. This allowed farm productivity to increase and marketing margins to decrease, reducing the price of many foods. Figure 8.1 shows that following significant spikes in the 1970s caused primarily by oil crises, there have been persistent and profound reductions in the price of food globally. It is well established that past increases in food production, at progressively lower unit costs, have improved the health and well-being of billions of people, particularly the poorest, who spend the largest share of their incomes on food.
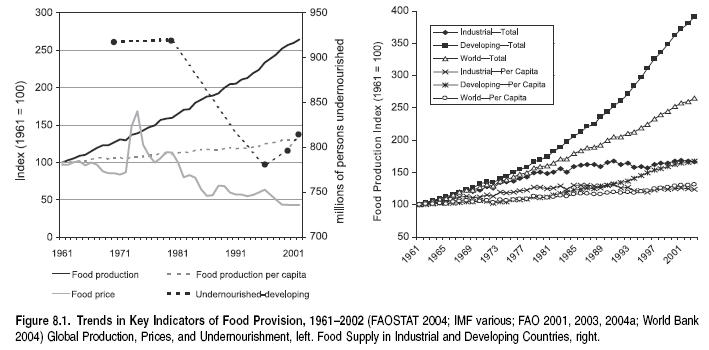
Despite rising food production and falling food prices, more than 850 million people still suffer today from chronic undernourishment, and the absolute number of hungry people is rising. In 1970 there were an estimated 959 million people suffering from hunger, or about one quarter of the world’s population. By 1998 that number had been reduced to 815 million, but progress has been slow. And in sub-Saharan Africa, there are now many more hungry people than there were in 1970. There have also been recent declines in food security in South Asia and the transition economies. In 2000–02, the total number of 852 undernourished people globally was up 37 million from 1997–99. Of this total, 815 million people were in developing countries, up by around 38 million from the 777 million in 1997–99 (FAO 2001, 2004a). In industrial countries, approximately 1.6% of children under five are underweight (WHO 2004d).
This chapter provides insights into the structure and distribution of food provision, with particular emphasis on the relative contribution of various ecological systems. It examines trends in the core food sources (crops, livestock, and fisheries (Fisheries and aquaculture)), some of the key linkages to ecosystems and ecosystem service provision, and the drivers of those trends. Examining the drivers of change is particularly important, since some are amenable to intervention so as to bring about improved outcomes, particularly with regard to greater provision of (or fewer trade-offs with) other ecosystem services. Finally, the chapter addresses linkages between human well-being and food access and use. The chapter does not dwell on the important issue of the specific ways in which food is cultivated or harvested, and how those ways affect ecosystem capacity and the provision of other services. These topics are the core focus of specific systems chapters, of which cultivated systems (Chapter 26), drylands (Chapter 22), inland waters (Chapter 20), coastal (Chapter 19), and marine (Chapter 18) systems are the ones most directly relevant. Key related service chapters are those on biodiversity (Chapter 4 (Ecosystems and Human Well-Being: Volume 1: Current State and Trends: Food Ecosystem Services)), fresh water (Chapter 7 (Ecosystems and Human Well-Being: Volume 1: Current State and Trends: Food Ecosystem Services)), and nutrient cycling (Chapter 12).
8.2 Magnitude, Distribution, and Structure of Food Provision
This section has two main subsections. First, a contemporary perspective of the structure of food provision is presented, focusing both on major food groups and on a breakdown of food provision by system types. An assessment of the spatial distribution of global food production by value for crops, livestock, and fisheries is also presented. Second, a review in more depth is provided of the specific regional and food group trends for crops, livestock, and fisheries.
8.2.1 Structure and Distribution of Food Provision
The overall distribution of food production by MA system type and by major food group is presented in Table 8.1. Care must be taken in interpreting the Table for several reasons. First, the MA systems are neither mutually exclusive nor fully exhaustive of all terrestrial ecosystems. For example, a single cropland area might simultaneously be counted as belonging to several MA systems, since it is a cultivated system in a dryland area, situated in the coastal zone. Second, it is very difficult to obtain any reliable information on the quantity and value of wild sources of food (apart from commercial fisheries), even though they are extremely important in many parts of the world.
All crop production is considered to take place in cultivated systems. (See Chapter 26.) Dryland systems account for about 38% of total crop production, with forest and mountain ecosystems each accounting for about 25%, and coastal systems around 12%. Table 8.1 shows both annual and perennial crop production, irrigated and rain-fed production proportions, and an assessment of the food and feed utilization of crops. On average, about 53% of food crops find their way into food and 21% are used for feed. The remaining 26% is categorized as used for seed, waste, or other industrial processing. Only a small share of perennial crop production is used for feed. However, a significant quantity of wild fisheries capture is used for feed—for aquaculture and, to a lesser extent, livestock. Aquaculture production is roughly split evenly between inland/fresh and coastal/brackish waters. Wild fish catches from freshwater systems are extremely difficult to estimate, as most go unreported. Some 63% of wild marine fish catches are from marine systems and 37% from coastal systems.
Figure 8.2 (in Appendix A (Ecosystems and Human Well-Being: Volume 1: Current State and Trends: Food Ecosystem Services)) shows the spatial distribution of the total value of food production summarized in Table 8.1, indicating where the major calorie and protein sources of the world are concentrated. Figure 8.3 (in Appendix A) shows a detail for Asia, highlighting the importance of coastal zone systems in providing high values of both marine and terrestrial food sources. This dual pressure on coastal zones poses particular management challenges. (See Chapter 19.)
|
Table 8.1. The Global Structure of Food Provision by Food Category and MA Ecosystem (2000 production) Food/Feed Types Total Value Share By Use Value by Selected MA System Food Feed Dryland Forests Cultivated Systems Mountains Polar Inland Waters Coastal Marine (percent) (billion 1989-91 dollars) Crops Total 815 53.3 21.1 314 202 815 195 100 Irrigated 336 185 38 336 38 Rain-fed 479 129 165 479 157 Annual 663 49.3 23.0 254 663 151 Perennial 152 95.8 2.0 60 38 152 44 Wild plants n.a. Livestock Total 576 83.0 15.7 294 98 242 150 35 Wild meat n.a. Fish Total 158a 32 2 32 67 57 Wild 93a 83.0 17.0 32 2 n.a. 34 57 Aquaculture 100.0 32 33 n.a. Aquatic plants Wild n.a. Aquaculture 8 n.a. 8 Total value of food production 1,557 608 300 1,089 345 2 32 210 57 Production values derived from 2000 production estimates weighted by 1989–91 global average international dollar prices for individual products in each food type group (FAOSTAT2004; FAO Fishstat 2003; FAO 1997). The 1989–91 prices are the most recent set of complete and comparable prices covering all FAO crop and livestock products.Fisheries prices based on landed values by group of species. Production values by MA system and irrigated/rain-fed split derived by authors from GIS analysis of cropland, irrigatedarea, and pasture and livestock distribution. Non-food agricultural products were excluded from the analysis. Note that total value for each food group is not the sum ofindividual MA system values since MA systems overlap and not all MA systems are included in the table. a Fisheries totals do not include wild inland water catches. n.a. = data not available. (Ecosystems and Human Well-Being: Volume 1: Current State and Trends: Food Ecosystem Services) |
8.2.2 Distribution of and Trends in Domesticated and Wild Food Production
8.2.2.1 Domesticated Species
As domestication of plant and animal species favored for food production has evolved, the species base supporting food provision has been eroded. Of the estimated 10,000–15,000 edible plants known, only 7,000 have been used in agriculture and less than 2% are deemed to be economically important at a national level. Only 30 crops provide an estimated 90% of the world population’s calorific requirements, with wheat, rice, and maize alone providing about half the calories consumed globally (Shand 1997; FAO 1998; FAOSTAT 2004).
There is a large potential for the improvement and greater use of neglected and underutilized species (FAO 1996; Naylor et al. 2004). In addition, along with traditional crop varieties, wild relatives of crop plants have been used to supply specific traits that have been introduced into crop plants using conventional breeding techniques, and, increasingly, using modern biotechnology (FAO 1998). There is also a large potential for the domestication and improvement of new crops, especially fruits, vegetables, and industrial (or cash) crops (Janick and Simon 1993), but the probability of developing new major staple crops is probably rather limited (Diamond 1999). With regard to livestock, of the estimated 15,000 species of mammals and birds, only some 30–40 (0.25%) have been used for food production, with fewer than 14 species accounting for 90% of global livestock production.
Since the origins of agriculture, farmers—and, more recently, professional plant and animal breeders—have developed a diverse range of varieties and breeds that contain a high level of genetic diversity within the major species used for food. For some crop species, there are thousands of distinct varieties (FAO 1998). Similarly, there are many breeds of livestock that originate from a single species. However, as larger and larger areas are planted with a smaller and smaller number of crop varieties, and as livestock systems are intensified, many of these varieties and breeds are at risk of being lost in production systems and increasingly are found only in ex situ collections. (See Chapter 26.) For example, FAO estimates that in Europe 50% of livestock breeds that existed 100 years ago have disappeared (Shand 1997).
Plant breeders have achieved yield increases through changing plant physiology and number of grains; increasing the oil, protein, and starch content of specific crops; shortening the maturity period for annual and perennial crops; and increasing drought resistance and nutrient use efficiency. Plant breeding per se has been complemented by deliberate programs of genetic enhancement or ‘‘base broadening’’ in order to incorporate genetic variation into plant breeders’ stocks. Generally, there has been insufficient investment in such ‘‘pre-competitive’’ crop improvement activities (Simmonds 1993; FAO 1996; Cooper et al. 2000).
8.2.2.1.1 Crops
Over the 40 years from 1964 to 2004, the total output of crops expanded by some 144% globally, an average increase of just over 2% per year, always keeping ahead of global [[population (Population growth rate)] growth rates]. As shown in Table 8.2, output growth varied by region and over the period as a whole.
|
Table 8.2. Global and Regional Growth Rates in Crop Output (Bruinsma 2003) Region 1969-99 1979-99 1989-99 (percent per year) Sub-Saharan Africa 2.3 3.3 3.3 Near East/North Africa 2.9 2.9 2.6 Latin America and Caribbean 2.6 2.3 2.6 South Asia 2.8 3.0 2.4 East Asia 3.6 3.5 3.7 Developing countries 3.1 3.1 3.2 Industrial countries 1.4 1.1 1.6 Transition economies -0.6 -1.6 3.7 World 2.1 2.0 2.1 Despite a resurgence of crop output in the early to mid-1990s in response to both the decline in outputs from countries in transition and a surge in food prices, many middle-income and richer countries have seen a gradual slowing down in the growth of crop output in line with the deceleration of population growth and the attainment of generally satisfactory levels of food intake. Decelerating growth patterns in crop output have been most evident in industrial countries and in Asia more widely. Output in the transition economies fell by about 30% between 1990 and 1995 from its fairly stable level in the mid to late 1980s. While output has since steadied around a lower level, a significant drop in average food energy intake and an increase in the incidence of malnutrition have been documented during the 1990s, as described elsewhere in this chapter. In response to growing affluence and shifting dietary patterns that increased demand for both food and feed crops, growth of food output in Asia has been consistently high, at 3% a year or more since the early 1960s. The feed market is important not only for intensive livestock production, but increasingly for aquaculture (Ecosystems and Human Well-Being: Volume 1: Current State and Trends: Food Ecosystem Services) , as seen in the rapid increase in soybean demand for carp cultivation in China. |
While growth in overall crop output in sub-Saharan Africa has been relatively strong over the past two decades, beverage and fiber crops, predominantly for export, still represent a significant share of that production. Since food crop production has not grown as markedly, and population growth rates remain high, sub-Saharan Africa remains the only region in which per capita food production has not seen any sustained increase over the last three decades, and this has recently been in decline. In North Africa and the Middle East, growth in crop output has been both moderate and often erratic.
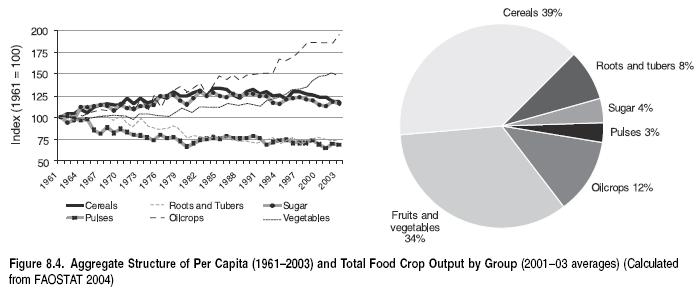
The past 40 years have also seen some considerable shifts in crop production, driven by changes in consumption. Figure 8.4 shows the trends in crop production by major crop group on a per capita basis. There have been four general trends exhibited by oilcrops; fruits and vegetables; cereals and sugar crops; and roots, tubers, and pulses.
Growth in output of oilcrops and vegetable oils between 1961 and 2001was consistently strong at just over 4% per year, largely propelled by a rapid growth in palm oil (8.2% per year), rapeseed oil (6.9% per year), and soybeans (4.1% per year). The principal commodities included in this category (and their global production quantities in million tons in 2001) include soybeans (177), oil palm (128), coconuts (52), groundnuts (36), and rapeseed (36). Cottonseed (37 million tons) is usually often part of this group, but it is excluded here as it is not considered a food product.
Food use of oil and vegetable oil crops, expressed in oil equivalent, grew from 6.3 kilograms per capita per year in 1964/66 to 11.4 kilograms in 1997/99. Demand has grown more in developing countries (5.0% per year) than in industrial ones (3.2%), stimulated by rising incomes and urbanization that have increased consumption of cooking oil, processed foods, and snacks. More than for any other crop (and excluding pastures), it is the global area expansion of oilcrops over the past 40 years that has driven cropland expansion. (See Box 8.1.)
|
|
|
In 1961 the harvested areas of cereals and oilcrops stood at 648 million and 113 million hectares respectively. Over the past 40 years, output of oilcrops expanded dramatically, and by 2001 their harvested area stood at 233 million hectares compared to 674 million hectares for cereals. The harvested area of soybean alone expanded by some 50 million hectares. Most of the oilcrop expansion took place in land-abundant countries (Brazil, Argentina, Indonesia, Malaysia, the United States, and Canada). |
The big four oil crops have been responsible for a good part of the expansion of cultivated land under all crops in developing countries and the world as a whole. In terms of harvested area, land devoted to the world’s principal crops (cereals, roots and tubers, pulses, fibers, sugar crops, and oilcrops) expanded by 59 million hectares (or 6%) since the mid-1970s. (Increases in harvested area arise from a physical expansion of cultivated land, an expansion of land under multiple cropping (a hectare of arable land is counted as two if it is cropped twice in a year), or both. Therefore, the harvested area expansion under the different crops discussed here could overstate the extent to which physical area in cultivation has increased. This overstatement is likely to be more pronounced for cereals (where the arable area has probably declined even in developing countries) than for oilcrops, as the latter include also tree crops (oil and coconut palms and olive trees).)
A 105-million-hectare increase in harvested area in developing countries was accompanied by a 46-million-hectare decline in industrial countries and transition economies. The expansion of land under the big four oil crops was 63 million hectares—that is, they accounted for all the increase in world harvested area, and more than compensated for the drastic declines in the area under cereals in industrial countries and transition economies. In these countries, the expansion of oilseed area (25 million hectares) substituted and compensated for part of the deep decline in the area sown to cereals. But in developing countries, it seems likely that it was predominantly new land that came under cultivation, as land under the other crops also increased.
These numbers illustrate the dramatic changes in cropping patterns that occurred, particularly in industrial countries, as a result of policies (such as EU support to oilseeds) and of changing demand patterns toward oils for food in developing countries and toward oilcakes/meals for livestock feeding everywhere. They also demonstrate that land expansion still can play an important role in the growth of crop production. The 200% increase in oilcrop output between 1974/76 and 1997/99 in developing countries was brought about by a 70% (50-million-hectare) expansion of land under these crops at the same time as land under other crops increased by an almost equal amount.
Particularly notable is the rapid expansion of the share of oil palm products (in terms of oil palm fruit) from Southeast Asia (from 40% of world production in 1974/76 to 79% in 1997/99) and the dramatically shrinking share from Africa (from 53 to 14%). Africa’s share in terms of actual production of palm oil (9% of the world total, down from 37% in the mid-1970s) remained well below that of its share in oil palm fruit production. This denotes the failure to upgrade the processing industry, but also the potential offered by more-efficient processing technology to increase oil output from existing oil palm areas. The contrast of these production shares with the shares of land area under oil palm is even starker: Africa still accounts for 44% of the world total, three quarters of it in Nigeria. |}
Fruit and vegetable production grew in line with population during the 1960s and 1970s, when growing demand lead to increased per capita output. The principal commodities in this category, and their 2001 production in million tons, are tomatoes (106), watermelons (81), bananas (65), cabbages (61), grapes (61), oranges (60), apples (58), and dry onions (51). While per capita output growth was modest during the 1980s, it accelerated during the 1990s. Between 1961 and 2001, production of vegetables grew from 72 kilograms per capita on average per year to 126 kilograms, and that of fruits from 56 to 77 kilograms per year.
Cereal and sugar crop production grew at an accelerated rate in the 1960s and 1970s, increasing their total per capita output by around 25% by 1980. The principal cereal crops, according to their 2001 production in million tons, are maize (615), paddy rice (598), wheat (591), barley (114), sorghum (60), millet (29), and oats (27).
Per capita cereal production peaked in the mid-1980s and has been in slow decline ever since. Sugar crop production followed broadly the same pattern as that for cereals. The per capita production of roots, tubers, and pulses declined by around 25% between the early 1960s and the early 1980s, with pulses declining more rapidly at first. Since then production has roughly kept pace with [[population (Population growth rate)] growth].
Overall, these trends suggest that higher-value cereals, fruits, and vegetables have tended to displace pulses and roots and tubers.
The cereal sector remains particularly important in several ways. Cereals provide almost half of the calories consumed directly by humans globally (48% in 2001) and will continue as the foundation of human food supply into the foreseeable future because of their high yields, nutrient density, and ease of cooking, transport, and storage compared with other staples such as root and starch crops. Cereal production accounts for almost 60% of the world’s harvested crop area and an often disproportionately larger share of the usage of fertilizer, water, energy, and other agrochemical inputs. The cereal sector therefore is especially important from the perspective of [[ecosystem service]s] and trade-offs between services both locally and globally. Chapter 7 in the MA Scenarios volume describes the technological and humanitarian successes of the cereal-based Green Revolution, as well as the subsequent and continuing controversy about the scale and longevity of its environmental and equity implications. At the heart of this debate lie many questions of trade-offs among ecosystem services and among elements of human well-being. One part of that debate has focused on the relative economic, social, and environmental costs of intensification versus expansion strategies for meeting global (cereal) food needs (Evenson and Gollin 2003; Conway 1997; Green et al. 2005) as well as on key assumptions regarding the scientific opportunities for improving future crop yield potential (Cassman 1999; Cassman et al. 2003).
Aggregate cereal consumption and production patterns are influenced by three major, codependent forces. The first force is a two-stage income effect in which cereal consumption increases in proportion with incomes as they grow from low levels, but a reversal in this behavior (technically, a reverse in the ‘‘income elasticity’’) is witnessed as incomes continue to rise and as basic energy and other dietary needs are met. At this stage most consumers tend to replace food staples like cereals with higher-value foods, such as animal protein and fruits and vegetables. The second force is urbanization, which often brings a shift in cereal preferences toward wheat and rice at the same time as an overall decline in the share of cereals in a more diverse diet. And the third force is the increasing role of coarse grains (maize, sorghum, millet) but also wheat and, to a lesser extent, rice as livestock feed. These forces, all at various stages of evolution in different parts of the world, have resulted in a net increase in per capita cereal consumption globally from 135 to 155 kilograms per year between 1961 and 2001, even though cereals now constitute a slightly lower proportion of total energy intake (down from 50% to 48%).
The trends are clearer if industrial- and developing-country groupings are distinguished. In industrial countries, per capita consumption of cereal as food fell from 148 to 130 kilograms per year (representing 38% and 31% respectively of dietary energy supply), while in developing countries per capita consumption increased from 129 to 162 kilograms per year (representing 59% and 53% respectively of DES). (See Box 8.2 for a description of trends in cereals for feed.)
|
| ||||
|
Crops are used both as feed inputs for intensive livestock systems and for direct or processed sources of food. Global use of cereals as feed increased at only 0.7% per year between 1982 and 1994 despite rapid increases in meat production. Growth rate in cereal use in industrial countries was negligible, while it increased by about 4% a year in the developing countries. Despite the higher growth rate, developing countries still use less than half as much cereal for feed as industrial countries do. During the early 1990s, concentrated cereal feed provided between 59% and 80% of the nutrition given to animals in the industrial world. By contrast, cereals accounted for only 45% of total concentrate feed in Southeast Asia, the developing region with the most intensive use of feed grains. |
For the world as a whole, it is estimated that 660 million tons (in 1997) of mainly coarse grains, making up 35% of all cereal use, are fed to animals. Most of these are used in the United States and other industrial countries. Nevertheless, increasing amounts are being fed to intensive livestock in developing countries, as poultry and pig production increased. Over the last decade, the increase in cereal use for feed has been more gradual than expected, partly because of a reduction in intensive livestock production in the transition economies, partly because of high cereal prices in the EU, and partly because of increasing efficiency of feed conversion.
Poultry are very efficient feed converters, requiring only 2–2.5 kilograms of feed per kilogram of meat produced and even less per kilogram of eggs. Pigs require 2.5–4 kilograms of dry matter per kilogram of pig meat, while concentrate-fed ruminants require much more feed per kilogram of meat.
The use of cereals as feed has been fastest in Asia, where output growth has risen the most and land is scarce. In Other East Asia, Southeast Asia, and Sub-Saharan Africa, cereal use as feed grew faster than meat production, indicating that those regions are intensifying their use of feed per unit of meat output. Most of Asia, West Asia–North Africa, and Sub-Saharan Africa lack the capacity to produce substantial amounts of feed grain at competitive prices. The growing amounts of feed grains imported into these regions attest to this deficiency. Given that many developing countries cannot expand crop area, two possibilities remain: intensification of existing land resources and importation of feed. Because much of the gain from intensification will probably go toward meeting the increasing demand for food crops, substantially more feed grains will have to be imported by developing countries in the future.
Alternatives to crops in the way of feed include household waste products and crop residues. In developing countries, household food waste, such as tuber skins, stems, and leaf tops, has traditionally been an important feed source for backyard monogastric production in particular. But small-scale backyard operations are disappearing because of low returns to labor and increased competition from large-scale producers. Although each backyard operation is small, at the aggregate level such systems act as major transformers of waste into meat and milk. Because large operations are unlikely to find it cost-effective to collect small amounts of waste from many households, this source of animal feed may be underused in industrial systems.
|-
| colspan="5" | Trends and Projections in the Use of Cereal as Feed. Figures are three-year moving averages centered on year shown. The 2020 projections are from the July 2002 version of the IMPACT model. (Delgado et al. 2003, calculated from data in FAOSTAT 2004)
|-
|
| colspan="4" align="center" | Total Cereal Use a Feed
|-
| Region
| align="center" | 1983
| align="center" | 1993
| align="center" | 1997
| align="center" | 2020
|-
|
| colspan="4" align="center" | (million tons)
|-
| Chinaa
| align="right" | 40-49
| align="right" | 78-84
| align="right" | 91-111
| align="right" | 226
|-
| India
| align="right" | 2
| align="right" | 3
| align="right" | 2
| align="right" | 4
|-
| Other East Asia
| align="right" | 3
| align="right" | 7
| align="right" | 8
| align="right" | 12
|-
| Other South Asia
| align="right" | 1
| align="right" | 1
| align="right" | 1
| align="right" | 3
|-
| Southeast Asia
| align="right" | 6
| align="right" | 12
| align="right" | 15
| align="right" | 28
|-
| Latin America
| align="right" | 40
| align="right" | 55
| align="right" | 58
| align="right" | 101
|-
| Western Asia and North Africa
| align="right" | 24
| align="right" | 29
| align="right" | 36
| align="right" | 6
|-
| Sub-Saharan Africa
| align="right" | 2
| align="right" | 3
| align="right" | 4
| align="right" | 8
|-
| Developing world
| align="right" | 128
| align="right" | 194
| align="right" | 235
| align="right" | 444
|-
| Industrial world
| align="right" | 465
| align="right" | 442
| align="right" | 425
| align="right" | 511
|-
| World
| align="right" | 592
| align="right" | 636
| align="right" | 660
| align="right" | 954
|-
| colspan="5" | aRanges show high and low estimates based on data from various sources.
|}
Following a peak in food prices in 1996, there was strong growth in crop output in 1999 in both industrial and developing countries, but since then the general pattern of growth deceleration has resumed. In industrial countries, output actually declined in both 2001 and 2002. In the case of cereals, global output levels have stagnated since 1996, while grain stocks have been in decline. The area devoted to the major cereals has been decreasing at about 0.3% annually since the 1980s. These trends are likely to continue if real cereal prices continue to fall, causing farmers to switch to more profitable crops, such as vegetables and fruits. Loss of highly productive cereal-growing land is particularly acute in areas of rapid urban expansion, a common feature of development in many countries. Although there has been some cereal price recovery since 2001, prices still stand at some 30–40% lower than their peak in the mid-1990s (FAO 2004b).
Growth in the yield of the major cereals has been virtually constant for the past 35 years since the release of the first miracle varieties of wheat and rice and of the single-cross maize hybrids. And in many of the world’s most important cereal production areas, there has even been a plateauing of yields in the past 15–20 years as average farm yields reached about 80–85% of the genetic yield potential (Cassman 1999). Such stagnation is evident in key rice-growing provinces in China, Java and other parts of Indonesia, Central Luzon in the Philippines, the Indian Punjab, Japan, and South Korea (Cassman et al. 2003), as well as for irrigated wheat in the Yaqui Valley of Mexico. However, yield growth rates will have to increase to meet future food demand unless more land area is devoted to cereal production. While in many low-productivity areas there is still considerable scope (and pressing need) for raising yields through the use of improved technologies and management practices, in high-productivity areas future yield growth will depend increasingly on raising genetic yield potential and more fine-tuned crop and soil management practices to allow consistent production near the yield potential ceiling.
Despite the potential contribution of genomics and molecular biology, as well as substantial research investments to improve photosynthesis during the 1970s and 1980s, there is as yet limited evidence that biotechnology approaches can help raise the yield potential ceiling. Indeed, there has been little progress toward increasing maximum net assimilation rates (photosynthesis minus respiration) in crop plants, and the determinants of yield potential are under complex genetic control that result in trade-offs between different options for increasing seed number, seed size, partitioning of dry matter among different organs, crop growth duration, and so forth (Denison 2003; Sinclair et al. 2004). Consideration of these issues has led to calls for caution in projecting forward past achievements in yield growth as a basis for assessing future food security, as well as for greater urgency in the key scientific challenges involved (Denison 2003; Cassman 2001).
8.2.2.1.2 Livestock
Livestock and livestock products are estimated to make up over half of the total value of agricultural gross output in industrial countries, and about a third of the total in developing countries, but this latter share is rising rapidly (Bruinsma 2003). The global importance of livestock and their products is increasing as consumer demand in developing countries expands with [[population (Population growth rate)] growth], rising incomes, and urbanization. This rapid worldwide growth in demand for food of animal origin, with its accompanying effects on human health, livelihoods, and the environment, has been dubbed the ‘‘Livestock Revolution’’ (Delgado et al. 1999). Livestock production has important implications for ecosystems and [[ecosystem service]s], as it is the single largest user of land either directly through grazing or indirectly through consumption of fodder and feedgrains (Bruinsma 2003). Industrial livestock production, the most rapidly growing means of raising livestock, poses a range of pollution and human health problems. (See Chapter 26.) At the same time, livestock production can promote linkages between system components (land, crops, and water) and enables the diversification of production resources for poor farmers (Devendra 2000).
The overall annual growth rates for livestock product outputs are summarized by region and by time period in Table 8.3. The global growth rate is currently just over 2% per year and is declining over time, but this masks the true dynamics of the sector (and highlights the potential pitfalls of interpreting global-scale data), as there are large regional disparities. While growth rates in industrial countries, where people already enjoy adequate supplies of animal protein, have remained at just over 1% for the past 30 years, growth rates in developing countries as a whole have been high and generally accelerating. The trends in East Asia (and particularly China) are particularly strong, with livestock product growth rates of over 7% a year over the last 30 years, albeit from a low base. South Asia and the Middle East and North Africa have maintained long-term growth in livestock product output of over 3% per year.
|
Table 8.3. Global and Regional Growth in Livestock Output (Bruinsma 2003) Region 1969-99 1979-99 1989-99 (percent per year) Sub-Saharan Africa 2.4 2.0 2.1 Near East/North Africa 3.4 3.4 3.4 Latin America and Caribbean 3.1 3.0 3.7 South Asia 4.2 4.5 4.1 East Asia 7.2 8.0 8.2 Developing countries 4.6 5.0 5.5 Industrial countries 1.2 1.0 1.2 Transition economies -0.1 -1.8 -5.7 World 2.2 2.1 2.0 As with crops, two regions have lagged behind in livestock production: the countries in transition and sub-Saharan Africa. The transition economies exhibit the same pattern as for crops— slow long-term shrinkage of output, followed by collapse in the early 1990s. Sub-Saharan Africa, faced with the world’s highest stresses of poverty, hunger, and population growth (see Chapters 3, 6, and 7 (Ecosystems and Human Well-Being: Volume 1: Current State and Trends: Food Ecosystem Services) ) and with continuing insecurity, particularly in pastoral areas within the subcontinent, has made slow progress; per capita livestock output has hardly increased at all in the past 30 years (Ehui et al. 2002). |
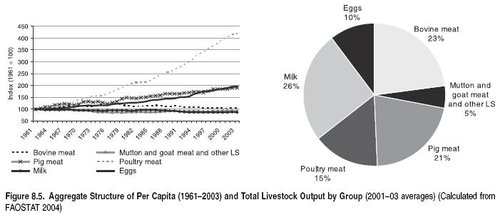
With regard to the product structure of growth, Figure 8.5 presents the trends in growth of global output for each of the major livestock food product categories, expressed in per capita terms. Three broad groupings of trends are shown; for poultry meat; for pigmeat and eggs; and for bovine, mutton, and goat meat and milk. Poultry meat production has expanded almost ninefold, from some 2.9 to 11.2 kilograms per capita per year between 1961 and 2001. In developing countries, this entailed a production expansion from 1.0 to 7.7 kilograms per capita per year as population in those countries increased from 2.1 billion to 4.8 billion. In industrial countries, the equivalent figure was from 6.7 to 24 kilograms as population increased from 980 million to 1.3 billion. This quite remarkable growth in output has been achieved through rapid expansion of industrial (‘‘landless’’) chicken rearing and processing facilities located in peri-urban areas throughout the world. (See Chapter 26.) These enterprises in turn depend on supplies of quality grain-based feedstuffs from national or international [[market]s].
While growth in the poultry meat sector has been relatively consistent since the early 1960s, the output of eggs and pork was slower both in its takeoff and in its subsequent growth, with higher and more sustained growth starting only in the early 1980s. Per capita production of both eggs and pork almost doubled between 1961 and 2001. Total production of eggs rose from 15.1 million to 57.0 million tons, and pork from 24.7 million to 91.3 million tons. In developing countries, annual per capita production of eggs and pork increased from 1.6 and 2.1 kilograms, respectively, in 1961 to 7.0 and 11.3 kilograms in 2001. In industrial countries, growth has been more modest, however, from 10.8 to 12.7 kilograms per capita in the case of eggs, and from 20.5 to 24.0 kilograms per capita in the case of pork during the same time period. Pig and poultry meat each now account for about a third of all meat produced worldwide, and more than one half of total pig production is in China.
Growth in milk (cattle and buffalo), beef, and mutton and goat meat production has, on the whole, kept pace with [[population (Population growth rate)] growth rates], and average per capita global production has stayed relatively constant over the last 40 years. The 1961 global production of 344 million, 29 million, and 6 million tons of milk, beef, and mutton and goat meat, respectively, increased to 590 million, 59 million, and 11 million tons in 2001. Milk production has risen faster in developing than in industrial countries, from 32 to 50 kilograms per capita per year, but still lies far below the 264 kilograms per capita per year of industrial countries. Annual per capita production of beef increased in developing countries from 4.6 to 6.2 kilograms between 1961 and 2001, while in industrial countries, despite the large-scale switch to poultry meat, annual per capita beef production edged up from 19.6 kilograms in 1961 to 22.4 in 2001.
Looking back at the trends in the evolution of livestock systems, three points can be made: First, almost the entire expansion in output from poultry and pigs, globally, and from beef and milk cattle in industrial countries, has taken place in intensive, industrial production systems. Second, while providing food in relatively safe, reliable, and progressively cheaper ways, there have been many examples in both industrial and developing countries of a wide range of soil, water, and odor pollution problems, as well as potential large-scale health risks from the more intensive production of livestock. (See Chapter 26.) Third, the expansion of extensive beef production systems, primarily in South and Central America, has been associated with high rates of deforestation (Mahar and Schneider 1994; Kaimowitz 1996; Vosti et al. 2002).
Livestock productivity (output per head of livestock) continues to be higher in industrial than in developing countries, with the largest difference in the case of milk production, which is more than six times higher. In 2001, for example, milk yield was 3,075 and 480 kilograms per animal in industrial and developing countries, respectively. In general, sub-Saharan Africa and South Asia have the lowest output per animal compared with other parts of the world. In sub-Saharan Africa, milk production per animal has been declining since 1961, and in 2001, while production of beef per animal was about 65% of the world average, production of milk per animal was only 14% of the world average.
This low productivity level can be attributed to the types of production systems prevailing in sub-Saharan Africa. Generally, three phases of the income-herd relationship in small-holder producers can be distinguished, which coincide with the process of commercialization of the livestock sector: emergence, expansion, and contraction. Poor farmers raise few livestock, but as development begins to take place poor rural households are able to gradually expand their livestock holdings. The herd size gradually expands with further development, but there is a point of development in many rural economies after which most farmers choose to stop raising livestock. Beyond a certain income level, herd size for most households falls as productivity increases, and only a few specialized households evolve toward larger-scale commercial operations (McIntire et al. 1992).
To date, overall growth in livestock production has been sufficient to meet increases in demand without significant price increases, and relative to the long-term downward trend in prices for cereals, oils, and fats, the prices for livestock products have remained relatively stable. However, there are considerable differences between continents and countries in production and consumption, and international trade between surplus and deficit producers has increased. Developing countries, as a group, have become net importers of livestock products from industrial countries. Between 1990 and 2000, net imports of meat and milk to developing countries grew by more than 6% a year, while net imports of eggs declined by a little over 16%.
8.2.2.2 Wild Food Sources: Fisheries
Biodiversity provides a diverse range of edible plant and animal species that have been and continue to be used as wild sources of food, including plants (leafy vegetables, fruits, and nuts), fungi, bushmeat, insects and other arthropods, and fish (including mollusks and crustaceans as well as finfish) (Pimbert 1999; Koziell and Saunders 2001). Many types of wild food remain important for the poor and landless, especially during times of famine and insecurity or conflict, when normal food supply mechanisms are disrupted and local or displaced populations have limited access other forms of nutrition (Scoones et al. 1992). Even in normal times, these wild land-based foods are often important in complementing staple foods to provide a balanced diet, and plants growing as weeds may often be important in this respect (Johns and Staphit 2004; Cromwell et al. 2001; Satheesh 2000).
About 7,000 species of plants and several hundred species of animals have been used for human food at one time or another (FAO 1998; Pimbert 1999). Some indigenous and traditional communities use 200 or more species for food (Kuhnlein et al. 2001). The capacity of ecosystems to provide wild food sources is generally declining, as natural [[habitat]s] worldwide are under increasing pressure and as wild plant and animal populations are exploited for food at unsustainable levels.
This section focuses on freshwater and marine fisheries, as they are globally significant sources of wild food, and it also covers aquaculture.
During the past century, the production and consumption of fish (including crustaceans and mollusks) has changed in important ways. Three trends are notable: average per capita consumption has increased steadily; the proportion of fish consumed at considerable distances from where it is harvested is growing; and an increasing number of fish stocks have been critically depleted by catch rates that exceed, often considerably, any commonly understood measure of maximum sustainable yield.
During the last four decades, the per capita consumption of fish as seafood increased from 9 to 16 kilograms per year. Table 8.4 shows fish production and utilization over the last half of the 1990s.
|
Table 8.4. World Fishery Production and Utilization, 1996–2001 Production and Utilization 1996 1997 1998 1999 2000 2001a (million tons) Production Inland Capture 7.4 87.6 8.0 8.5 8.8 8.8 Aquaculture 15.9 17.5 18.5 20.2 21.4 22.4 Total inland 23.3 25.0 26.5 28.7 30.2 31.2 Marine Capture 86.0 86.4 79.2 84.7 86.0 82.5 Aquaculture 10.8 11.2 12.0 13.3 14.1 15.1 Total marine 96.9 97.5 91.3 98.0 100.2 97.6 Total capture 93.5 93.9 87.3 93.2 94.8 91.3 Total aquaculture 26.7 28.6 30.5 33.4 35.6 37.5 Total production 120.2 122.5 117.8 126.7 130.4 128.8 Utilization Human consumption 88.0 90.8 92.7 94.5 96.7 99.4 Non-food uses 32.2 31.7 25.1 32.2 33.7 29.4 (kilograms) Per capital food fish supply 15.3 15.6 15.7 15.8 16.0 16.2 a Denotes projected data (Fisheries Centers, UBC). (Ecosystems and Human Well-Being: Volume 1: Current State and Trends: Food Ecosystem Services) |
8.2.2.2.1 Trends in trade, commercialization, and intensification
Ninety percent of full-time fishers conduct low-intensive fishing (a few tons per fisher per year), often in species-rich tropical waters of developing countries. Their counterparts in industrial countries generally produce several times that quantity of fishing output annually, but they are much fewer, probably numbering about 1 million in all (FAO 1999), and their numbers are declining. In industrial countries, fishing is seen as a relatively dangerous and uncomfortable way to earn an income, so as a result fishers from economies in transition or from developing countries are replacing local fishers in these nations.
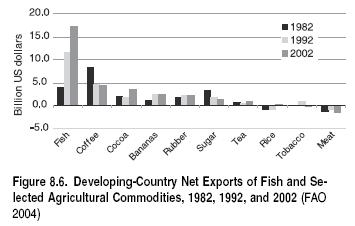
Nearly 40% of global fish production is traded internationally (FAO 2002). Most of this trade flows from the developing world to industrial countries (Kent 1987; FAO 2002). Many developing countries are thus trading a valuable source of protein for an important source of income from foreign revenue, and fisheries exports are extremely valuable compared with other agricultural commodities. (See Figure 8.6.)
Although fish are consumed in virtually all societies, the levels of consumption differ markedly. Per capita consumption is generally higher in Oceania, Europe, and Asia than in the Americas and Africa. Small island countries have high rates of consumption; land-locked countries often low levels. Fish is eaten in almost all social strata, due to the large variety of fish species and products derived from them, ranging from the very exclusive and expensive and rare to the cheap and currently still plentiful.
8.2.2.2.2 Overfishing and sustainability
After 50 years of particularly rapid expansion and improving technological efficiency in fisheries (Fisheries and aquaculture), the global state of the resources is causing widespread concern. Between 1974 and 1999, the number of stocks that had been overexploited and were in need of urgent action for rebuilding increased steadily and by 1999 stood at 28% of the world’s stocks for which information is available. While the percentage of overexploited stocks appears to have stabilized since the late 1980s, the latest information indicates that the number of fully exploited stocks has been increasing in recent years while the number of underexploited stocks has been decreasing steadily—from an estimated 40% in 1970 to 23% in 2004. The most recent information available from FAO suggests that just over half of the wild marine fish stocks for which information is available are fully or moderately exploited, and the remaining quarter is either overexploited or significantly depleted.
The Atlantic Ocean was the first area to be fully exploited and overfished, and fish stocks in the Pacific Ocean are almost all currently fully exploited. There still seems to be some minor potential for expansion of capture fisheries in the Indian Ocean and the Mediterranean Sea (Mediterranean Basin), although this may be due to environmental changes including eutrophication. Phytoplankton plumes near densely populated areas and riverine plumes have been associated with higher levels of fisheries productivity (Caddy 1993).
At the beginning of the twenty-first century, the biological capability of commercially exploited fish stocks was probably at a historical low. FAO has reported that about half of the wild marine fish stocks for which information is available are fully exploited and offer no scope for increased catches (FAO 2002). Of the rest, 25% are underexploited or moderately exploited and the remaining quarter are either overexploited or significantly depleted.
Although information on catches from inland fisheries is less reliable than for marine capture fisheries, it appears that freshwater fish stocks are recovering somewhat from depletion in the Northern Hemisphere, while the large freshwater lakes in Africa are fully exploited and in parts overexploited. Some fish species exhibit more dramatic threshold effects, appearing less able to recover than others.
Accentuating the ecological implications of the increase in capture fisheries production is an important trend in catch composition—over the past 30 years the average trophic level of fish landed from marine and freshwater (Freshwater biomes) ecosystems has declined. (See Box 8.3.) Trophic level decline is the progressive change in catch composition, in the case of marine systems, from a mixture of top predatory fish such as sharks and saithe, mid-trophic level fish such as cods and herrings, and a few lower trophic level animals such as shrimp to a catch of a few mid-trophic species such as whiting and haddock and many low-trophic species such as shrimp. This change is a result of three phenomena: the expansion of fisheries from benthic coastal production areas to the pelagic open ocean; the expansion of fisheries from the Northern Hemisphere (dominated by large shelves and bottom fish) to the Southern Hemisphere (dominated by upwelling systems and pelagic fish); and overfishing, possibly leading to a local replacement of depleted large predators by their smaller preys. This change in catch composition is sometimes called ‘‘fishing down marine food webs.’’
|
|
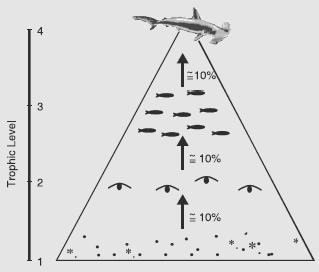 One way to understand the structure of ecosystems is to arrange them according to who eats what along a food chain. (See Figure.) Each link along the chain is called a trophic level. Levels are numbered according to how far particular organisms are along the chain—from the primary producers at level 1 to the top predators at the highest level. Within marine systems, large predators such as sharks and saithe are at a high trophic level, cod and sardines are in the middle, and shrimp are at a low trophic level, with microscopic plants (mainly phytoplankton) at the bottom sustaining marine life (Pauly et al. 2003). |
8.2.2.2.3 Freshwater fisheries and food security
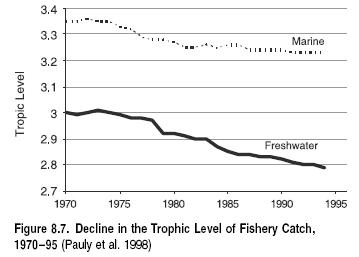
Approximately 10% of wild harvested fish are caught from inland waters, likely a smaller proportion than in the early twentieth century. However, it is more difficult to measure freshwater fisheries catches than marine catches. They may be underreported by as much as a factor of two because informal fisheries activities, such as subsistence fisheries, are not accurately accounted for in national statistics (Coates 1995). Fish production from inland waters is almost entirely finfish, with negligible amounts of crustaceans or mollusks, except in localized areas. As shown in Figure 8.7, the mean tropic level of freshwater fisheries landings tends to be lower than that of marine catches.
The socioeconomic value of freshwater fish catches is especially high. Freshwater fish tend to be consumed in their entirety, with minimal wastage, providing key sources of protein for local communities. And in addition to their nutritional value, freshwater fisheries provide livelihoods for low-income and resource-poor groups. The high level of artisanal and informal activity, relying on labor-intensive catching methods, contributes to food security for vulnerable groups, including women and children.
8.2.2.2.4 Aquaculture
Although aquaculture is an ancient activity, it is only during the past 50 years that it has become a globally significant source of food. In 2002 it contributed approximately 27% of fish harvested and 40% (by weight) of all fish consumed as food. However, the variety of supply from aquaculture is well below that of capture fisheries: only five different Asian carp species account for about 35% of world aquaculture production, and inland waters currently provide about 60% of global aquaculture outputs.
The distinction between capture fisheries and aquaculture in fresh waters can be unclear. For example, extensive aquaculture in China includes catches from stocked rivers and lakes (which are substantial). While expanding aquaculture production can take the pressure off wild fisheries resources in some cases, in other cases the opposite is true (Naylor et al. 2000), as cultivation of carnivorous species can require large inputs of wild fish for feed. Overall, catches of wild fish for non-food uses are increasing faster than catches for food.
8.3 Food Provision and Biodiversity
This section reviews some of the key impacts of the provision of food on biodiversity. Since food provision involves the purposive management or exploitation of ecosystems to enhance food productivity, there are often trade-offs involved with other [[ecosystem service]s]. In the past, when food production activities affected a smaller share of Earth’s land and ocean bodies, and overall demand for ecosystem services supported by biodiversity was less than today, many of these trade-offs were not recognized or were not considered to be important. Now cultivated systems account for about 27% of the world’s land surface and for a much higher share of habitable land (Wood et al. 2000).
The most direct impact of food provision on biodiversity has been through habitat conversion: around 43% of tropical and subtropical dry and monsoon [[forest]s] and 45% of temperate broadleaf and mixed forests globally have been converted to croplands. Huge areas of the world are now planted to a small number of crop species or covered by modified pastures. In addition, rapid increases in coastal aquaculture have lead to the loss of mangrove ecosystems. Though future rates of conversion are expected to be much lower in absolute terms than historically, the major locations of agricultural expansion have frequently coincided with remnants of natural habitats with high biodiversity value (Myers et al. 2000). And the construction of roads and other infrastructure (such as irrigation canals), which are seen as key to promoting agricultural development and meeting the Millennium Development Goals, tends to dissect the landscape and to further limit the movement of wildlife and the dissemination of plant species.
Second, food provision affects wild biodiversity through its demand for inputs other than land, most notably water and nutrients, and through the pollution of ecosystems with pesticides and excess nutrients. Irrigated agriculture is a major user of fresh water (see [[Chapter 7 (Ecosystems and Human Well-Being: Volume 1: Current State and Trends: Food Ecosystem Services)]2]), which, together with the direct loss of wetland habitats from conversion and the pollution of inland waters from excess nutrients, has a major negative impact on inland water biodiversity. (See Chapter 20.) As a consequence, wild fish populations in inland waters can be greatly reduced, often having the greatest negative impacts on the poor (Bene et al. 2003). Despite increases in water use efficiency, total water demand for agriculture is increasing and in many regions is projected to outstrip sustainable supplies over the coming decades. (See Chapter 7.)
Agriculture is the major consumer of reactive nitrogen, but only a fraction this is used in plant growth and retained in food products. The excess leads to biodiversity loss and reduced water quality in inland waters and coastal systems through eutrophication and to terrestrial plant diversity losses through aerial deposition. (See Chapters 12, 19, and 20.) Despite modest increases in nitrogen use efficiency, demand for fertilizer is projected to increase by 65% by 2050, leading to a doubling of current rates of N aerial deposition and N loading in waterways (Galloway et al. 2004).
Of the pesticides in widespread use, the most important effects on biodiversity are from persistent organic pollutants, since these have effects on large spatial and temporal scales. (See Chapter 25.) Many of the most persistent chemicals are being phased out through appropriate legislation and replaced by ones with fewer environmental impacts. However, the total use of pesticides is still increasing, and the poor regulatory environments in many countries mean that highly toxic chemicals continue to be used unsafely.
A third aspect of the impact of food provision on biodiversity concerns the effects within agricultural production systems and landscapes. Since agricultural landscapes (areas containing a significant share of cropland and pasture) now occupy 38% of Earth’s land area, the maintenance of biodiversity within them is an important part of any overall strategy for biodiversity conservation. Even in relatively intensely farmed areas, cultivated crop production typically only covers a portion of the actual land areas, and much of the rest of the land can serve as habitat for wild species, if appropriately managed. However, in many agricultural landscapes wild biodiversity appears to be declining. For example, the pan-European bird index for farmland birds shows a declining trend since 1980 (see Chapter 26), in contrast to the situation for overall pan-European bird index.
One positive landscape-wide impact noted in sub-Saharan Africa, South Asia, and Southeast Asia is the trend of growing more trees in agricultural landscapes, for a wide variety of purposes. Trees stabilize and enhance [[soil]s], contribute in themselves to biodiversity, but also play host to a variety of birds and insects. Management practices can have major impacts on such biodiversity and the services that it provides for nutrient cycling, pest control, and pollination (Chapter 26), with positive spillovers for agricultural production.
The spread of invasive alien species is a fourth way that food provision affects biodiversity. While most of the world’s major crops species are ‘‘alien’’ in the sense that their main production areas are outside their areas of origin (with notable exception of rice, the world’s most important crop), none of the major crop plants are invasive. The greatest ecological risks probably arise from the spread of alien aquatic species. (See Chapter 20.) The introduction of the Nile perch in Lake Victoria, for example, led to the extinction of a large number of cichlid fish species.
Tilapia is the second most important fish species for aquaculture. Like carp, tilapia is vegetarian, and therefore tilapia-based aquaculture avoids many of the negative effects of carnivorous species. However, escapes into surrounding freshwater ecosystems may disrupt local species populations. Besides the direct use of alien species for food production, trade in food products is a major potential pathway for the introduction of pests and diseases, and most countries have quarantine systems to address this threat (FAO/NACA 2001).
Finally, when food provision is from wild sources, overexploitation and certain fishing practices can have major impacts on species composition. Overexploitation has been implicated as the leading threat to the world’s marine fishes and has led to a decline in the average trophic level of catches, as described earlier. Overfishing affects not only the target species but also habitats, food webs, and non-target species. High-impact fishing (including bottom trawling, long-lining, gill netting, and dynamite fishing) causes damage to the biodiversity of sensitive habitats, such as cold-water reefs, tropical coral reefs, and seamounts, and to migratory seabirds (Pauly et al. 1998, 2003; Jackson et al. 2001). (See Chapter 18.)
Historically, many terrestrial species have become extinct due to hunting, and there are currently 250 mammal species, 262 bird species, and 79 amphibian species listed as threatened due to overexploitation for food (Baillie et al. 2004). In some groups of species and in some ecosystems, overexploitation is a particularly serious threat. In eastern and southeastern Asia, for example, almost all species of turtles and tortoises are in serious decline as a result of harvesting for human consumption and medicine, mainly in China (Baillie et al. 2004). In some cases overexploitation of plants, particularly medicinal plants, is also threatening many populations.
Food insecurity can have very severe consequences for local biodiversity. Famines, conflict, civil unrest, floods, and other natural disasters can decimate local food production and break food supply chains. In such cases, people are often forced to resort to exploitation of local wild plant and animal sources of food, often unsustainably.
8.4 Drivers of Change in Food Provision
The MA defines a driver as ‘‘any natural or human-induced factor that directly or indirectly causes a change in an ecosystem.’’ (See Chapter 3.) In this section, that definition is limited to factors causing change in a specific ecosystem service: food provision.
Increased understanding of the drivers of change in food provision can generate insights into potential intervention opportunities for accelerating desired change and mitigating or adapting to less welcome trends. The discussion of drivers here is organized around two key dimensions. The first is the distinction recognized by the MA conceptual framework between indirect and direct drivers of ecosystem change. The second is the distinction between factors influencing food demand as opposed to those shaping food supply.
Assessing the impact of drivers for both demand and supply is particularly important in the case of food. The demand for food has long since outstripped the capacity of nature to provide it unaided, and for several millennia humans have transformed natural ecosystems for the singular purpose of obtaining more accessible, reliable, and productive sources of food to meet growing demands (Evans 1998; Smith 1995). The factors driving these changing demands must therefore be examined as a proper context for examining drivers of change in food provision.
Emerging patterns of food consumption provide early signals of the shifts in stresses on specific ecosystems in specific locations. In subsistence-oriented food production systems there is strong geographical coincidence of food consumption and ecosystem stress. In the increasingly globalized commodity trade and food industry sectors, the consumption-driven footprint of production on ecosystems might be several continents or oceans removed from the sites where consumption takes place.
Chapter 3 in this volume and Chapter 7 in the Scenarios volume contain information that is complementary to this section, particularly with regard to the treatment of indirect drivers such as technology, demographic trends, and economic growth. Chapter 26 in this volume also provides a brief summary with regard to the agricultural sector in exemplifying the important role of science and technology as a driver of change. That material is not repeated here, but appropriate cross-references are made.
|
Table 8.5. Indirect Drivers of Food Provision (compiled by authors from assessment of literature and evidence) Drivers Past 50 Years Current Trends Change Relevance of Driver Change Relevance of Driver Remarks/Examples Demand factors Population growth and structure In +/++ med –/+ low/med Europe static/shrinking; North America still growing Dg +++ high +/+++ med/v. high East Asia slow; SSA, WANA, SA highest growth rates Urbanization In ++ med –/+ low 70–80% urbanized Dg +++ med ++/+++ med/high 40% urbanized, 3%/yr growth, 80% of global urban total Income growth In ++ med/high ++ med/high slow to medium long-term growth Dg +/+++ high –/+++ high some negative, esp. SSA; strong growth: East Asia Food prices In –– med –/o low/med well-integrated markets, productivity growth Dg – high –/+ med/high weaker markets, lower productivity growth Food marketing: branding and advertising In ++ med +++ med major diet changes are through switching brands/product Dg + low +/++ med less in poor rural areas, but increasing, e.g., radio, tv Diet and health information In ++ med ++/+++ med/high increased information on the healthfulness or otherwise related to specific food types or food processing Dg o/+ low +/++ med concerns with environmental, food safety, child labor, equity, GMOs, animal welfare, etc. issues Consumer concerns with production context In x low xx low/med concerns with environmental, food safety, child labor, equity, GMOs, animal welfare, etc. issues Dg o/x low o/x low Dietary (and lifestyle) preferences In o/x low/med o/x low/med largely consequence of marketing, diet, and health info Dg x/xxx med/high xx med/high largely consequence of urbanization and income growth Consumer demands for minimum produce grades, standards, labels In ++ med/high +++ high/v. high most producers conform; contract farming on the rise Dg o/+ low o/+++ med/v. high major challenge to poor smallholders Supply factors Investments in infrastructure and institutions In ++ med + med industrial countries maintained investments in high stock Dg -/+ high -/+ very high developing countries often underinvesting in low stock Investments in science and technology In ++ high +/++ high biotechnology: increasing, conventional: stable/decline Dg o/+ high -/+ very high widening gap between industrial and developing R&D Domestic price policies (e.g., producer subsidies, price controls) In ++ med/high + med powerful farm lobbies resist support reduction Dg ++ med/high ++ very high policies often favor urban consumer International trade regimes and regulations (e.g., WTO) In + med ++ med limited incentives for industrial-country concessions Dg o/+ low/med +/++ high growing incentives developing countries to seek change Regulatory environment for production practices In + med med/high regulatory pressures on effluents, animal welfare, etc. Dg o/+ low ++ med less regulation/enforcement Food industry integration and food retailing practices In +++ med +/++ med increased attention to on-farm standards and food safety Dg o/+ med +/++ high increased incentives for smallholder collective marketing Prices of produce and inputs C/W --/+ high o/++ med/high prices increasing with scarcity of wild food sources In/Dg -/- high -/- high/v.high real prices declining; raise productivity to compete Access to information, technology and credit, markets In ++ high ++ growing ICT role; weather/price forecasts, credit Dg o/+ high +/++ very high credit is a major constraint; ICT role growing fast Level of market access/integration In ++ high/v. high + very high more mature and integrated; lower transactions costs often Dg -/+ high -/++ poor infrastructure, institutions; high costs Insecurity and instability In o very low o very low not a significant issue; FSU a possible exception locally Dg -/+ v. high (loc) -/++ v. high (loc) critical loss of assets, resources Key: In – industrial-country grouping; Dg – developing-country grouping Increases: + low; ++ medium; +++ high; decreases: – low, – – medium, – – – high; – –/+ indicates a range from – – to + Change (no sign): x low, xx medium, xxx high, o no change. C/W: cultivated/wild ICT: information and communication technologies Table 8.5 presents an assessment of the key indirect drivers of food provision, using separate grouping of drivers for food demand and supply. Table 8.6 presents the key direct (supply-side) drivers. For each driver the Tables provide a qualitative assessment of its rate of change and a judgment of its relevance in terms of influencing food provision. These variables are assessed both retrospectively over the past 50 years and for current and projected trends (up to 2015). Finally, to provide a slightly more nuanced perspective, these driver-specific assessments are provided for both industrial (In) and developing (Dg) regions in two adjacent rows. In the subsections that follow, every driver is not described in detail, but the key drivers where some relevant data exist are dealt with selectively. Trends in some important drivers are shown in Figure 8.8. Table 8.6. Direct Drivers of Food Provision (compiled by authors from assessment of literature and evidence) Drivers Past 50 Years Current Trends Change Relevance of Driver Change Relevance of Driver Remarks/Examples Increasing climate variability and long-term climate change In + low + low/med current and projected changes often low/positive Dg ++ low/med ++ med/high apparent increases in variability/extremes; high/neg Area expansion of cropland, pasture, fishing grounds In + low/med -/+ low little available unexploited area; some are in decline Dg ++ med/high +/++ med/high forest/habitat loss, urban growth loss Intensification of production (e.g., seeds, irrigation, fertilizers) In +++ med/high ++ med main source of growth in food output Dg +/++ high +/++ very high mixed; sustainable increases critical for SSA Degradation of underpinning resource stocks In ++ med o/+ med overfishing of marine fisheries; agrobiodiversity loss Dg ---/+ very high very high major impact on soil degradation, wild food sources Pest and disease incidence and adaptation In o/+ med/high -/+ med extensive (regulated) pesticide use; GM crops (US) Dg o/++ high o/++ high greater pressures, less regulation; IPM increasing Key: In – industrial-country grouping; Dg – developing-country grouping. Increases: + low, ++ medium, +++ high; decreases: – low, – – medium, – – – high; – –/+ indicates a range from – – to + No change: o (Ecosystems and Human Well-Being: Volume 1: Current State and Trends: Food Ecosystem Services) |
8.4.1 Indirect Drivers
8.4.1.1 Drivers of Food Demand
Eight factors are identified here that shape the demand for food. The first four of these ([[population (Population growth rate)] growth], urbanization, economic growth, food prices) encompass the major demographic and economic trends that condition the demand for food and specific types of food in the aggregate. The remaining four factors (food marketing, food-related information, consumer attitudes to production practices, and diet and lifestyle preferences) are often more subtle expressions of the interplay of the previous three drivers but are increasingly shaping the structure of food consumption. Finally, these trends are drawn together in the paradigm of the ‘‘diet transition’’ (Popkin 1993, 1998; WHO 2003b).
8.4.1.1.1 Population growth and age structure
Between 1961 and 2001 the major driver of growth in total food consumption was population growth. Global population doubled in this time period, from just over 3 billion to 6.1 billion, while the apparent consumption of calories per person increased on average by around 24% (FAOSTAT 2004). But from a global perspective the central role of population growth as a driver of food demand has started to decline, significantly in some regions of the world. Population growth rates, which peaked at 2.1% per year in the late 1960s, had fallen to around 1.35% (or 78 million additional people) per year by the turn of the millennium (UNDP 2003). This still represents a daunting food security and humanitarian challenge, as approximately 90% of this increase is taking place in developing countries. Around half of the total population increase in developing countries will occur in sub-Saharan Africa and South Asia, where the incidence of hunger is already high and, according to estimates for 2000–02, increasing in absolute terms (FAOSTAT 2004; Bruinsma 2003; FAO 2004a).
By contrast, in Western Europe, transition countries, and East Asia, population growth is extremely low and in some cases negative. As a consequence of lower fertility rates and increased life expectancy, typical of richer countries, the average age of individuals in such countries is increasing. Conversely, countries with higher fertility rates, which are also often poorer, have younger age structures. (See Chapter 3.)
While population size and growth rates have direct consequences for food needs and the required resilience of food production systems, age structure has more subtle impacts. One such impact is that energy and diet diversity requirements are age- (and sex-) dependent and, for example, increase for mothers during pregnancy and lactation. Furthermore, there is evidence of differences in food consumption according to age in the United States (Blisard and Blaylock 1993) and Japan (Mori and Gorman 1999). For example, U.S. and Japanese studies found older people to be consuming more fruit, as well as eating more meals at home.
8.4.1.1.2 Urbanization
Urbanization has proceeded at such a pace that globally, urban dwellers will outnumber rural populations by around 2007. High-income countries currently have populations that are 70–80% urban, and the same pattern is being seen as development progresses elsewhere (such as in Latin America and the Caribbean). The proportion of those in developing countries who live in cities has doubled since 1960 from 22% to over 40%. This share is expected to grow to almost 60% by 2030 (UN 2004). Developing countries now account for around 80% of the world’s urban population. In 2001, 13 of the world’s 17 ‘‘megacities’’ were in developing countries, and by 2015 it is expected that figure will have risen to 17 (UN 2001). (See also Chapter 27.)
Urbanization affects many dimensions of food demand. First, food energy requirements of urban populations are generally less than those in rural areas because of more sedentary lifestyles (Clark et al. 1995; Delisle 1990). Urban consumers generally have higher incomes as well as access to a more diverse array of both domestic and imported foods. Urban lifestyles often mean less time at home, and more meals eaten away from home (Popkin 1993). As a consequence, urban consumers eat more processed and convenience foods. This raises issues of food cost, quality, and safety in terms of the use of appropriate inputs, especially safe water in food processing.
Empirical evidence shows that urban diets are more diversified and contain more micronutrients and animal proteins but with a considerably higher intake of refined carbohydrates as well as of saturated and total fats and lower intakes of fiber (Popkin 2000). Data for China, Indonesia, and Pakistan at two points in time show reduced consumption of cereals and roots and tubers and increased consumption of fruits and vegetables and meats among urban populations (Regmi and Dyck 2001). The greater diversity, including of fruits and vegetables, generally available to urban populations does not necessarily translate into increased diversity of consumption (Popkin et al. 2001; Johns and Shtapit 2004).
A widely observed trend in urban diets is the switch away from traditional staples (locally produced millet, sorghum, root crops, and plantains, for instance) and toward consumption of rice and wheat, even though cereal diet shares decline overall. Often the rice and wheat needs are met through imports. Rice is particularly attractive because its preparation is quick and simple relative to other cereals. Wheat gains popularity through increased consumption of bread, noodles, pasta, dumplings, and so on. Given the scale and speed of urbanization, particularly in developing countries, these dietary shifts amount to significant changes in the structure of food demand at the national and regional scale. While importing rice and wheat for urban [[market]s] requires foreign exchange and can undercut the market potential for domestic suppliers, it can increase the food security of urban populations (usually a politically important social group) by tapping into sources of food supply that are often more reliable and of higher quality than domestic sources. Because of domestic infrastructure constraints and related high transaction costs, it may also be more economical to import food even when local and foreign production costs are similar.
There are other impacts of urbanization apart from structural changes in food consumption. One is the loss of prime agricultural land as a consequence of urban expansion, often displacing food production into less productive land elsewhere. Another is the major changes in nutrient flows associated with the flow of food from rural to urban areas. Whereas organic matter residues were once recycled locally, this nutrient export from rural to urban areas can deplete soil nutrient content in the production areas and can concentrate nutrients in human wastes and other residues in and around cities. The latter incurs effluent treatment and disposal costs and often causes pollution of water courses or coastal waters. A good example is the depletion of soil fertility in the banana-growing regions of Uganda due to the high demand for cooking bananas in Kampala, which involves shipping complete stems for processing in the city. There are also significant other, often negative, effects associated with the continuous need for food transportation (such as the contribution of increased exhaust emissions to local particulate matter as well as to greenhouse gases).
8.4.1.1.3 Income growth
It is well established that income is the single most important factor determining the amount and quality of food consumption. The relative share of budget spent on food is significantly higher among the poor but decreases rapidly as incomes increase and basic nutritional needs are met (Engel’s law) (Tomek and Robinson 1981). At higher levels of income, high-value, more nutritious, or more culturally prestigious foods, such as fresh seafood or imported specialty foods, replace less-valued food sources (as described earlier regarding the transition to high-value meat, fish, vegetables, and fruits in East Asia since the late 1980s). In particular, the extra demand for meat is driving the ‘‘Livestock Revolution.’’
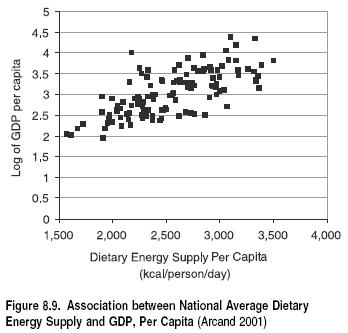
The most widely used proxy of income derived from aggregate statistics is the national measure of GDP per capita. (See Chapter 2 (Ecosystems and Human Well-Being: Volume 1: Current State and Trends: Food Ecosystem Services).) At a macroeconomic scale there is strong evidence of the association between national average energy supply (kilocalories per person per day) and national economic growth as measured by GDP. (See Figure 8.9.)
8.4.1.1.4 Food advertising, information, consumer power, and changing food preferences
The previous drivers have played and will continue to play key roles in shaping the overall quantity and structure of food consumption in generally predictable ways: more people, urban migration and urban lifestyles, higher incomes, and lower food prices. This second group of drivers acts to influence the food consumption decisions of individuals in more subtle ways. They are often factors that come increasingly into play as incomes rise and basic food needs are met, but far from exclusively so.
Consumers in industrial and developing countries, particularly in the urban environment, are exposed to advertising for food, and poor consumers are often the specific targets of food-related information and safety-net programs. Such advertising and information can directly alter food preferences. And as a variety of obstacles have slowly been removed, opportunities for providing consumers with information, particularly about food safety, nutrition, and health have increased. At the same time, however, local and traditional knowledge that underpin traditional diets and cuisine is often in decline (Johns and Sthapit 2004).
Public information media—radio stations, newspapers, and television channels as well as public service access points such as clinics, schools, churches—are increasingly being used as cost-effective means of providing food and nutrition information to the public. Messages are varied, from direct commercial advertising to important public health information, such as the advantages of breast-feeding or the existence of contaminated food supplies locally. In richer countries, this phenomenon is most apparent with regard to the high levels of consumer interest and credence in information concerning health-related or weight-control-related attributes of food. While the latter are often passing fads, they do have significant impacts on food production. The current attention being given to low-carbohydrate diets for weight loss, for example, has had a measurable increase in demand for white meats, fish, and eggs and a measurable reduction in demand for wheat-flour based products and, in the United States, tomatoes (a large share of which are grown for tomato paste in pastas and pizzas).
In the transition to lifestyles more characteristic of industrial societies, retaining a strong traditional food system in which diet has recognized health, cultural, and ecological roles has allowed some countries to reduce the often concomitant increases in chronic noncommunicable diseases (Popkin et al. 2001). Asian and Mediterranean diets (Trichopolulou and Vaasiloppoulou 2000) provide the clearest examples. Traditional societies often see food, medicine, and health as interrelated. Food may have strong symbolic and religious value and is highly associated with cultural identity and social well-being (Etkin 1994; Johns 1990; Johns and Sthapit 2004).
Trade liberalization and the increased role of transnational food companies, urbanization, and migration, combined with the equalizing effects of rising incomes, has led to convergence between diets internationally. Yet cultural and religious factors appear to limit such convergence and to help retain dietary diversity (Bruinsma 2003).
8.4.1.1.5 The ‘‘diet transition’’
Excessive consumption, particularly of some food types, has been associated with the growing phenomena of excessive body weight and obesity and with the associated health risks. Urbanization and socioeconomic changes have resulted in diets that are higher in energy and lower in diversity of fruits and vegetables than those consumed historically. As a consequence, many countries now face a ‘‘double burden’’ of diet-related disease: the simultaneous challenges of increased morbidity and susceptibility to communicable diseases among undernourished populations and increased incidence of chronic diseases associated with the overweight and obese (WHO 2003a; Ezzati et al. 2002). The pathway from traditional rural diets to those of increasingly urban and affluent societies and its attendant implications for nutrition and health has been dubbed the nutrition transition or the diet transition (Popkin 1993; Smil 2000; Receveur et al. 1997). (See Box 8.4.) The diet transition can be viewed as the integration of many of the individual consumption-related drivers just described, having both significant human and ecosystem health outcomes.
|
BOX 8.4 Diet and Nutrition Drivers: The ‘‘Diet Transition’’ |
|
Popkin (1998) has described five broad nutrition patterns (see Figure), not restricted to particular periods of human history but presented as historical developments. ‘‘Earlier‘‘ patterns are not restricted to the periods in which they first arose, but continue to characterize certain geographic and socio- economic subpopulations. |
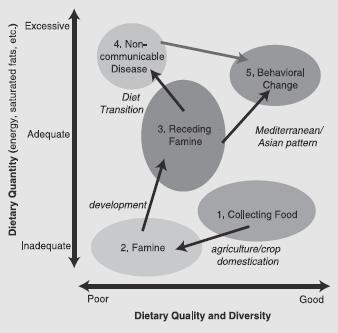
Pattern 1: Collecting Food. This diet, which characterizes hunter-gatherer populations, is high in carbohydrates and fiber and low in fat, especially saturated fat. The proportion of polyunsaturated fat in meat from wild animals is significantly higher than in meat from modern domesticated animals. Activity patterns are very high and little obesity is found among hunter-gatherer societies.
Pattern 2: Famine. The diet becomes much less varied and subject to larger variations and periods of acute scarcity of food. During the later phases of this pattern, social stratification intensifies, and dietary variation increases according to gender and social status. The pattern of famine has varied over time and space. Some civilizations have been more successful than others in alleviating famine and chronic hunger. The types of physical activities changed, but there is little change in activity levels associated with this pattern.
Pattern 3: Receding Famine. The consumption of fruits, vegetables, and animal protein increases, and starchy staples become less important in the diet. Many earlier civilizations made great progress in reducing chronic hunger and famines, but only in the last third of the last millennium have these changes become widespread, leading to marked shifts in diet. However, famines continued well into the eighteenth century in portions of Europe and remain common in some regions of the world. Activity patterns start to shift and inactivity and leisure becomes a part of the lives of more people.
Pattern 4: Nutrition-related Noncommunicable Disease. A diet high in total fat, cholesterol, sugar, and other refined carbohydrates and low in polyunsaturated fatty acids and fiber, and often accompanied by an increasingly sedentary life, is characteristic of most high-income societies (and increasing portions of the population in low-income societies), resulting in increased prevalence of obesity and contributing to the degenerative diseases that characterize Omran’s final epidemiologic stage.
Pattern 5: Behavioral Change. A new dietary pattern appears to be emerging as a result of changes in diet, evidently associated with the desire to prevent or delay degenerative diseases and prolong health. Whether these changes, instituted in some countries by consumers and in others also prodded by government policy, will constitute a large-scale transition in dietary structure and body composition remains to be seen. If such a new dietary pattern takes hold, it may be very important in increasing disability-free life expectancy.
The focus is increasingly on patterns 3 to 5, in particular on the rapid shift in much of the world’s low- and moderate-income countries from pattern 3 to pattern 4, commonly termed the ‘‘diet transition’’ or ‘‘nutrition transition.’’ |}
8.4.1.2 Drivers of Food Supply
8.4.1.2.1 Investments in agricultural research and development
It is well established that technological innovation is a major driver of increased agricultural productivity and in many cases is now the major source of increased productivity (Evenson et al. 1999; Acquaye et al. 2003; Roe and Gopinath 1998; Ruttan 2002). In turn, a major indirect driver of changes in food production systems has been the flow of innovations arising from investments in agricultural research and development. Worldwide, public investments in agricultural research nearly doubled in inflation-adjusted terms, from an estimated $11.8 billion (in 1993 dollars) in 1976 to nearly $21.7 billion in 1995. (See Table 8.7.) Developing countries account for just over half of the world’s public agricultural research (Pardey and Beintema 2001). (See Table 8.8.)
|
Table 8.7. Global Agricultural Research Spending, 1976–95. Figures in parenthesis indicate number of countries. (Pardey and Beintema 2001) Region 1976 1985 1995 (thousand 1993 dollars) Developing countries (119) 4,738 7,676 11,469 Sub-Saharan Africa (44) 993 1,181 1,270 China 709 1,396 2,063 Asia and Pacific, excluding China (23) 1,321 2,453 4,619 Latin America and the Caribbean (35) 1,087 1,583 1,947 Middle East and North Africa (15) 582 981 1,521 Industrial countries (34) 7,099 8,748 10,215 Total (153) 11,837 16,424 21,692 Regional totals fail to reveal, however, that the public spending was concentrated in only a handful of countries. Just four countries—the United States, Japan, France, and Germany— accounted for two thirds of the $10.2 billion of public agricultural research done by rich countries in 1995. Similarly, China, India, and Brazil (Ecosystems and Human Well-Being: Volume 1: Current State and Trends: Food Ecosystem Services) dominate the spending on agricultural research in developing countries. By the mid-1990s, about one third of the annual $33-billion investment in agricultural research worldwide was done by private firms, including those involved in providing farm inputs and processing farm products. The overwhelming majority ($10.8 billion, 94% of the global total) of this privately funded research was conducted in industrial countries (Pardey and Beintema 2001). |
|
Table 8.8. Public-Private Breakdown of Research Expenditures, Circa 1995 (Pardey and Beintema 2001) Region Public Private Total (thousand 1993 dollars) Developing countries 11,469 672 12,141 Industrial countries 10,215 10,829 21,044 Total 21,692 11,511 33,204 Chapter 7 of the Scenarios volume discusses the historical evolution of the impacts of investments in agricultural productivity. A meta-study of quantitative evidence on the economic payoffs from improved productivity attributable to agricultural research, which included 1,845 data points from evaluation studies published between 1950 and 1995, revealed that the mean average economic rate of return on investment was 30.4% per year, though the range was wide; there appeared not to have been, as was popularly believed, any observable decrease in the rate of return to research investment over time; nor was there any significant regional bias in payoffs—that is, the economic returns to research investments in sub-Saharan Africa were not statistically different from those in Asia (Alston et al. 2000). One persistent finding has been the importance in agricultural research of spillover of knowledge and technologies between different locations. Indeed, evaluation studies that have specifically taken account of knowledge and technology spillovers have shown that this has accounted for a large share, and in many cases more than half, of the overall economic benefits (Alston 2002). Nonetheless, local R&D is necessary to facilitate spillover, and the lower levels of local R&D in Africa as opposed to Asia help account for the former’s lower level of productivity growth (Masters 2005). (Ecosystems and Human Well-Being: Volume 1: Current State and Trends: Food Ecosystem Services) |
8.4.1.2.2 Agricultural policy and trade: producer subsidies and import Tariffs
One of the most important and controversial set of drivers conditioning food provision globally are agricultural production and trade policies, and especially the producer subsidy and tariff protection measures supported, in particular, by the European Union, the United States, and Japan. By subsidizing food production and exports, while keeping in place high import tariffs, particularly on semi-processed or processed foods, these OECD countries drive down food prices on the world market, undercutting the potential profitability of developing-country producers in their own markets while simultaneously limiting their export opportunities (Watkins and von Braun 2003).
In 2002, some $235 billion of the over $300 billion spent by OECD countries on their agricultural sectors (some six times the amount they allocate to overseas development aid) went to support agricultural producers. This support is paid for by higher domestic food prices and by taxes ($100 billion in the EU, $44 billion in Japan, and $31 billion in the United States). And it represents around 31% of average farm income (18% in the United States and 36% in the EU). For individual commodities that OECD countries target for support (wheat, maize, cotton, dairy, beef, sugar, rice, and oilcrops), the levels of support can be much higher (OECD 2003a; Watkins and von Braun 2003). Government support in Japan has consistently represented around 85% of farmers’ rice production revenues, while U.S. rice support has declined from around 50% in 2002 (OECD 2004). The economic losses to developing countries due to these policies has been estimated as some $24 billion a year in lost agricultural production and incomes of farm households and about $40 billion a year in lost access to [[market]s] in OECD countries (Diao et al. 2004).
Fisheries (Fisheries and aquaculture) are another area of food production where subsidies have become controversial. In the early 1990s it was established that subsidies had probably contributed to an excessive buildup of fishing fleets worldwide during the preceding decade. (See Chapter 18.) Since then, it has proved difficult to limit the fishing of existing fleets, and fish stocks continue to be overexploited as illegal, unreported, and unregulated fishing spreads. Subsidies to the fishing industry are regulated through WTO agreements; however, the international community has agreed that existing WTO rules are not sufficient to ‘‘discipline’’ their use, and efforts are now being made to seek improved measures under the socalled Doha round of trade talks (Chang 2003).
From an ecosystem perspective, these market distortions have two major effects. In countries where subsidies are paid, food output increases to levels that would be uneconomic in the absence of subsidies, drawing proportionately more land, labor, and other resources into production and creating higher levels of agricultural pollution. While other factors such as increasing productivity have caused the net amount of agricultural land to grow more slowly or even to decline in some OECD countries, those effects would have been more significant in the absence of subsidies. Recently, the OECD reported that while nitrogen runoff, pesticide use, and agricultural greenhouse gas emissions have fallen since the mid-1980s in most OECD countries, they have increased in the United States (OECD 2003b).
The other major impact of producer subsidies is the reduction of production and income opportunities in other parts of the world where subsidies are not paid, although these impacts can be ambiguous. While it could be argued that reduced production incentives might conserve more habitat and reduce demands on local natural resources, it also can make poor people even poorer by limiting productivity enhancement incentives on existing lands, thus accelerating land degradation and further increasing pressure to convert more land.
International processes and agreements under the World Trade Organization have a major bearing on these drivers, particularly WTO’s Agreement on Agriculture. This provides a framework for removing the ‘‘amber box’’ trade biases induced by producer subsidies and import tariffs, as well as for agreeing on a broader set of ‘‘green box’’ provisions dealing with support to producers for improving the environmental and landscape dimensions of farming through a range of ‘‘set-aside,’’ ‘‘conservation,’’ ‘‘countryside stewardship,’’ or similar programs. The espoused intent of ‘‘green box’’ measures is to provide incentives to farmers to follow less polluting, more environmentally sensitive production practices. However, such provisions have become highly contentious as they are seen by many, including most developing countries, as a way of legitimizing existing rich-country producer support in another guise.
There are other ecosystem-relevant dimensions of the Agreement on Agriculture, including the notion of decoupling support to producers from the quantity of production so as to limit perverse incentives to overproduce food, use more agricultural land, use more potentially polluting agricultural inputs, and generate more wastes. The impacts of the WTO on agriculture are still emerging and developing, but its potential ramifications will likely grow, bringing with it a significant change in food production incentives globally. Through the WTO, for example, developing countries are becoming increasingly effective at asserting demands for more liberal agricultural trade policies.
8.4.1.2.3 Food industry commercialization and integration
Just as agriculture has witnessed a gradual industrialization of the production process, so too have there been sweeping changes in food marketing, processing, and retailing practices. Even where industrialization of the production process has not taken place, the concentration and formalization of marketing is having significant repercussions on production decisions and on the need for improved smallholder collective action in order to stay engaged in food [[market]s]. Several forces at work are leading to the integration and formalization of food marketing and supply chains: growing economies of scope and scale in the transportation, processing, and retailing subsectors; falling food prices that have reduced profit margins and further encouraged consolidation in the postharvest sector; a growing need to respond to consumer demands for specific type and quality of product that provides incentives to shorten the marketing ‘‘chain,’’ such as vertical integration; a growing need for transparency and accountability in the certification of food sources, such as organic foods, and to satisfy appropriate (regulated or self–imposed) standards and food safety requirements; and the enormous expansion in the role of supermarkets, even in developing countries (Berdegue et al. 2003).
Thus an increasing share of food production is being contracted for before planting, with contracts that often involve producer obligations relating to minimum quantities, product quality, and delivery dates. Such stringent criteria are very difficult for smallholders to meet, and farmer associations and marketing groups are increasingly being formed to help respond to these needs. For example, in the United States there has been massive consolidation of farms due to the economic pressures to improve economies of scale for both production and marketing purposes (as well as, in recent times, to fully reap the benefit of production subsidies). In the 1920s and 1930s there were more than 6 million farms of around 40 hectares each. By the late 1990s, there were fewer than 2 million farms and they averaged 200 hectares each (Bread for the World 2003).
8.4.2 Direct Drivers
8.4.2.1 Climate Change and Climate Variability
Although there is a relatively rich literature on the potential impacts of long-term climate trends on future food production (see, for example, Rosenzweig and Parry 1996; Sombroek and Gommes 1996; Parry et al. 2004), evidence on the impacts of historical and recent climate change on food production is relatively sparse. Although climate is a major uncontrollable factor influencing food production (especially in areas of rain-fed agriculture), it is extremely difficult to reliably isolate the influence of climate from other factors such improved seeds, the use of irrigation, fertilizer, pesticides, crop and land management.
However, some data do exist. For example, based on over 80 years of crop yield and climate data in five central Corn Belt states in the United States, Thompson (1998) developed relationships describing the influence of monthly average temperature and total precipitation on corn yields. These suggest that 40 millimeters above normal precipitation in July would lead to a corn yield increase of 316 kilograms per hectare above the long-term average. It has also been suggested that U.S. corn and soybean yields could drop by as much as 17% for each degree that the growing season warms (Lobell and Asner 2003), although the level of certainty in such findings remains low (Gu 2003). Weather variability in China has been shown to have a measurable effect on year-to- year national grain output (Carter and Zhang 1998), and a study of the temperature and wine quality in the world’s top 27 wine regions over the past 50 years reveals that rising temperatures have already affected vintage quality (Jones et al. 2004).
Global-scale cyclical weather patterns have also strongly influenced food production. This includes the impact of, in particular, the El Niño-Southern Oscillation and the North Atlantic Oscillation. Carlson et al. (1996) found that a negative Southern Oscillation Index (a measure of pressure difference in an ENSO event) can result in a corn yield that is 10% above trend line in U.S. Corn Belt states, and ENSO-based climate variability has significant impact on cereal production in Indonesia (Naylor et al. 2002), where year-to-year fluctuations in the August sea-surface temperature anomaly explain about half the interannual variance in paddy production during the main (wet) growing season. The North Atlantic Oscillation has also been shown to significantly correlate to vegetation productivity in northern Asia, with a surprisingly long lag time of one-and-a-half years (Wang and You 2004).
8.4.2.2 Area Expansion and Intensification
There have been two main direct drivers of growth in food production: the increase in the area extent of cultivation, grazing, or fishing and the intensity of production or exploitation within cultivated areas. Figure 8.8 showed increasing trends in both harvested area (area expansion) and cereal yields (a proxy of increased intensification). It is clear that, for crops, it is intensification rather than area expansion that has mainly driven increased food output. Over the past 40 years cropland area has expanded globally by some 15%—from 1.3 billion to 1.5 billion hectares (see Chapter 26), the area of pasture has grown some 11% from 3.14 billion to 3.48 billion hectares (FAOSTAT 2004), and practically all corners of the world’s oceans are now accessible to the world’s fishing fleet (given the capacity of modern fishing vessels to stay at sea for extended periods and the large amounts of catch in refrigerated holds).
While physical expansion in the area dedicated to food provision has been important in the past, rates of growth are now relatively low—and in some places in decline (for instance, in the European Union and Australia). This slowdown reflects both the slowing growth in global food demand and the more limited opportunities for area expansion. Just as with the large growth in crop yields per hectare of cropland, there has also been substantial increase in livestock production per animal; however, intensive livestock systems are dependent on inputs from a significant land area for feed production. (These trends are described in more detail in Chapter 26.)
Investments in agricultural research and the resulting flow of innovation have been key to the intensification process. Technical change and increased use of external inputs such as irrigation, fertilizer, and mechanical power contribute to changes in productivity— the formal means by which changes in intensification can be measured. Increased productivity can also come from the introduction of less capital-intensive food-feed systems, whereby both the main crops as well as the introduction of legumes can enhance the cropping system. The complementary advantages of both food and feed enable intensification of mixed crop-livestock systems and can increase total factor productivity (Devendra et al. 2001).
8.5 Food Provision and Human Well-being
The MA defines five dimensions of human well-being—basic material for a good life, security, health, good social relations, and freedom and choice (MA 2003)—into which the production and consumption of food maps in several ways. Food production, distribution, processing, and marketing provide employment and income to a large share of the world’s population. About 2.6 billion people depend on agriculture for their livelihoods, either as actively engaged workers or as dependants (FAO 2004b). (The exact number of people dependent on food processing, distribution, and marketing for their livelihoods is not certain.) Food consumption contributes directly to health and is an important aspect of cultures and social relations, and indirectly supports improved security and freedom and choices.
There are several attributes of food that have a major bearing on its potential impact on human well-being—quantity and price, diversity and quality of its nutrient content, and safety. The actual impact of food depends on local food availability and the ability of consumers to gain access to and properly use it, as well as on individual food preferences. The dimensions of food availability, access, and utilization are integrated in the notion of food security, defined as ‘‘access by all people at all times to enough food for an active, healthy life’’ (Reutlinger and van Holst Pellekan 1986). For the poor, the price of food (as well as access to wild sources of food) is key to determining the value of incomes, and for many such people the relationship between wage rates and food prices is a critical determinant of human well-being. It is well established that a productive food and agriculture sector not only benefits individual farmers and food consumers but also provides a platform for economic growth (Mellor 1995; Hazell and Ramasamy 1991).
8.5.1 Health and Nutrition
The most direct and tangible benefit of food is its role in enabling individuals to pursue active, healthy, productive lives as a consequence of adequate nutrition. For these reasons, access to adequate, safe food has been recognized as a basic human right. The 1948 Universal Declaration of Human Rights proclaimed that ‘‘everyone has the right to a standard of living adequate for the health and well-being of himself and his family, including food.’’ Nearly 20 years later, the International Covenant on Economic, Social and Cultural Rights (1966) developed these concepts more fully, stressing ‘‘the right of everyone to . . . adequate food’’ and specifying ‘‘the fundamental right of everyone to be free from hunger.’’ These rights were specifically embodied in the 1989 International Convention on the Rights of the Child and have found further expression and practical interpretation through subsequent confirmation at the 1996 and 1999 World Food Summits (UN/SCN 2004).
Proper nutrition has many benefits for human, physical, and mental development. Better-fed children show improved educational performance, and better-fed adolescents and adults are able to lead more economically productive lives. Good nutrition also reduces neonatal and child mortality, helping to slow [[population (Population growth rate)] growth] by increasing birth intervals and reducing demand for large families. Well-nourished mothers are also more likely to survive childbirth themselves and to deliver healthier babies (ACC/ SCN 2002).
Inadequate consumption of protein and energy as well as deficiencies in key micronutrients such as iodine, vitamin A, and iron are key factors in the morbidity and mortality of children and adults. An estimated 55% of the nearly 12 million deaths each year among children under five in the developing world are associated with malnutrition (UNICEF 1998). Malnourished children also have lifetime disabilities and weakened immune systems (UNICEF 1998). Moreover, malnutrition is associated with disease and poor health, which places a further burden on households as well as health care systems.
A commonly used measure of the impact of ill health on human well being is disability-adjusted life years. This is a measure of the burden of disease, reflecting the total amount of healthy life lost, to all causes, whether from premature mortality or from some degree of disability during a period of time. Table 8.9 summarizes the available evidence regionally and globally on the burden of nutrition-related health impacts measured in terms of DALYs.
|
Table 8.9. Regional and Global Burden of Nutrition-related Disease Risk Factors. The Table shows the estimated disease burden for each risk factor considered individually. These risks act in part through other risks and act jointly with other risks. Consequently, the burden due to groups of risk factors will usually be less than the sum of individual risks. The disability-adjusted life year is a measure of the burden of disease. It reflects the total amount of healthy life lost to all causes, whether from premature mortality or from some degree of disability, during a period of time. (Adapted from Ezzati et al. 2002; Ollila n.d.; and WHO 2002a) Population/Risk Factor Africa Americas East Mediterranean Europe Southeast Asia Western Pacific World (thousand) Total population 639,593 827,345 481,635 873,533 1,535,625 1,687,287 6,045,017 Childhood and maternal-undernutrition-related diseases (DALYs as percent of regional and world population) Underweight 9.82 0.24 3.58 0.09 3.06 0.48 2.28 Iron deficiency 1.59 0.21 0.77 0.12 0.91 0.26 0.58 Vitamin A deficiency 2.57 0.04 0.61 0 0.42 0.03 0.44 Zinc deficiency 2.15 0.06 0.67 0.01 0.35 0.03 0.46 Malaria 0.74 HIV/AIDS 1.49 Respiratory infections 1.67 Iodine deficiency 0.04 Measles 0.4 Diarrhea 1.19 Other nutrition-related risks High blood pressure 0.69 0.78 1.02 2.22 0.98 0.83 1.06 High cholesterol 0.31 0.55 0.67 1.51 0.8 0.31 0.67 High BMI 0.23 0.89 0.6 1.35 0.27 0.35 0.55 Low fruit and vegetable intake 0.24 0.36 0.34 0.76 0.57 0.3 0.44 Diabetes 0.25 While the human health consequences of undernourishment, since they arise largely out of conditions of poverty and marginalization, legitimately dominate global humanitarian concerns, health problems associated with overconsumption of (certain types of) food have grown alarmingly over the past 40 years. The health-related aspects of nutrition are examined in three steps. First, micronutrient deficiency is considered, since although this is most often associated with undernourishment, it can arise even in diets with adequate or excessive protein and energy content. Second, undernourishment-related aspects are looked at, largely acute and communicable diseases. And third, the evidence on overnourishment-related noncommunicable diseases is reviewed. The constituents of good nutrition are fairly well understood, but dietary needs vary according to a range of context- and individual-specific characteristics, including climate, metabolism, and occupation. Guidelines indicate that a healthy adult diet includes a daily intake of 2,780 kilocalories for males and 2,235 kilocalories for females. Recommended daily allowances for protein are 37 grams for males and 29 grams for females (FAO/WHO/UNU 1985); however, these recommendations vary by country. Recommended daily intakes have also been established for a number of vitamins, minerals, and other micronutrients. For example, daily intakes have been established of 750 micrograms of vitamin A for both males and females, 130 micrograms of iodine for males, and 110 micrograms for females (FAO/WHO 2002). In addition, components of foods may have functions that include antibiotic (Ecosystems and Human Well-Being: Volume 1: Current State and Trends: Food Ecosystem Services) , immuno-stimulation, nervous system action, anti-inflammatory, antioxidant, anti-glycemic, and hypolipidemic properties (Johns and Sthapit 2004). |
Figure 8.10 presents a simplified schematic summary of the principal pathways of impact of food on human well-being, as mediated through nutrition. The following sections describe some of these pathways and, as far as available evidence permits, quantify the scale and intensity of specific nutrition, health, human development, and economic outcomes. But first the major trends in key measures of nutrition over the past 40 years are reviewed.
8.5.1.1 Diet Quantity: Dietary Energy Supply
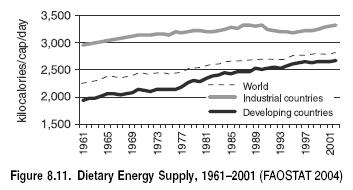
The most commonly used proxy of food availability is the gross availability of food, as proxied by the average per capita availability of calories from food products, the dietary energy supply. Figure 8.11 shows levels and trends in DES over the period 1961 to 2001 for industrial and developing countries and for the world. Expansion of food production, coupled with declining real prices for food, increased DES by 24% globally over that period (an 11% and a 39% average increase, respectively, in industrial and developing countries). In 1961, with a world population of around 3 billion, the average DES was around 2,250 kilocalories per capita per day. By 2001, average DES had reached 2,800 kilocalories per capita despite a doubling of world population to 6.1 billion (FAOSTAT 2004).
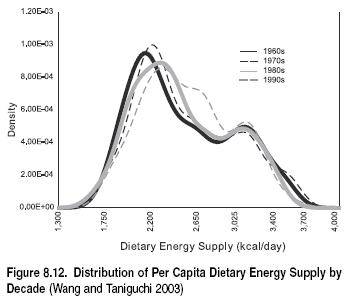
But there have been, and remain, large geographic and socioeconomic differences in DES. Such disparities largely arise from differences in income, in the disposition of and access to food and to lands favorable for food production, and in dietary preferences and food utilization practices. Figure 8.12 depicts an obvious twin peak structure—one peak for developing countries and another for industrial ones. From the 1960s through to and especially during the 1980s, there was a progressive shrinking of the DES gap between these two groups (Wang and Taniguchi 2003). Although the average DES of developing countries increased from 1929 to 2,675 kilocalories per day over 40 years, it is still lower than the DES in industrial countries in 1961, some 2,947 kilocalories per day. And during those 40 years the figure in industrial countries increased to 3,285 kilocalories a day (FAOSTAT 2004).
The progress of individual countries varies more markedly. Over the same 40 years Indonesia’s average DES grew by 68% from a very low 1,727 to 2,904 kilocalories per day, Uganda’s average figure barely increased from 2,318 to 2,398, while in the United States average DES grew by some 31%—from 2,883 to 3,766 kilocalories a day. With regard to overall shares of food consumption, industrial countries—with 24% of the world’s population— consumed 29% of global calories, 34% of global protein, and 43% of global fat in 2001 (FAOSTAT 2004). (Trends in hunger are discussed in further detail later.)
Of particular concern in Figure 8.12, however, is that the trend of improvement was reversed during the 1990s, when a noticeable leftward shift (lower DES) became apparent in several parts of the distribution (Wang and Taniguchi 2003). The figure suggests that the nutritional status of at least some developing and middle-income countries worsened during the 1990s.
8.5.1.2 Dietary Quality and Diversity
There are many other dimensions of good nutrition besides dietary energy supply. In addition to quantity, key elements of good nutrition are diet quality and diversity. A healthy diet comprises both sufficient quantities and a proper mix of carbohydrates, proteins, fats, fibers, vitamins, and micronutrients, as well as components with health-mediating functional properties (Johns and Sthapit 2004). These can be derived from a diverse range of crop and livestock products as well as wild and cultivated fisheries (Fisheries and aquaculture) products and other wild sources of food. (See Box 8.5.)
|
|
|
It is now possible to breed plants for increased vitamin and mineral content, making ‘‘biofortified’’ crops a promising tool in the fight to end malnutrition and save lives. An estimated 3 billion people suffer the effects of micronutrient deficiencies because they lack money to buy enough meat, fish, fruits, lentils, and vegetables. Women and children in sub-Saharan Africa, South and Southeast Asia, and Latin America and the Caribbean are especially at risk of disease, premature death, and impaired cognitive abilities because of diets poor in crucial nutrients, particularly iron, vitamin A, iodine, and zinc. We have the ability today to further improve and disseminate more widely iron-rich rice, quality protein maize, high-carotene sweet potato, and high-carotene cassava. The potential advantages of biofortification are that it does not require major changes in behavior by farmers or consumers, can directly address the physiological causes of micronutrient malnutrition, can readily be targeted to the poorest people, uses built-in delivery mechanisms, is scientifically feasible and cost-effective, and can complement other ongoing methods of dealing with micronutrient deficiencies. The potential disadvantages are that biofortification may not benefit small-scale and poor farmers; it undermines dietary diversity and creates possible conflict with distinctive food cultures; nutrient traits (except (-carotene) are difficult to verify without advanced technology; public investment is needed where infrastructure, including formal seed systems and marketing , and economies are weak; evaluations will be time-consuming; and resistance to and ethical issues related to transgenic crops are found in some regions. |
A handful of epidemiological studies from the United States and Europe, along with a few case studies from Africa and Asia, uphold the conventional wisdom concerning the benefits of a varied diet, particularly in fruits and vegetables. Nutritional status and child growth improve with consumption of greater food diversity, as do measures of functional properties of dietary components likely to play an important role (Johns and Sthapit 2004; Johns 2003).
Micronutrients are needed, as the term suggests, in only minuscule amounts; the consequences of their absence are severe, however, and contribute significantly to the burden of disease. Micronutrients enable the body to produce enzymes, hormones, and other substances essential for proper growth and development. Different micronutrients interact: there is a correlation, for example, between iron deficiency and deficiency in other vitamins and minerals (WHO 2004b). In addition, the content of specific micronutrients in foods can affect the absorption of other minerals.
Iodine, vitamin A, iron, and zinc are the most important individual micronutrients in global public health terms; their lack represents a major threat to the health and development of populations the world over, particularly to preschool children and pregnant women in low-income countries. Vitamin A deficiency and iron deficiency (related to anemia) alone affect as many as 3.5 billion people (WHO 2004b). Micronutrients with high bioavailability that are provided from animal-source foods include minerals, calcium, iron, phosphorus, zinc, Magnesium, and manganese, along with the vitamins thiamine B1, riboflavin B2, niacin, pyridoxine B6, and B12 (CAST 1999). Several other nutrients are known to be inadequate in developing countries, including B12, folate, and vitamin C. This section describes the four micronutrients most important for public health at present.
Vitamin A is derived from animal sources as retinol and from fruits and vegetables (such as dark leafy vegetables and yellow and orange non-citrus fruits) as carotene, which is converted into vitamin A in the body. Plant-derived vitamin A is more difficult to absorb than that from animals. Vitamin A deficiency significantly increases the risk of blindness and of severe illness and death from common childhood infections, particularly diarrheal diseases and measles. In communities where vitamin A deficiency exists, children are on average 50% more likely to suffer from acute measles.
Improvements in vitamin A status have been demonstrated to lead to a 23% reduction in mortality among children aged one to five (Rahmathullah 2003), so preventing between 1.3 million and 2.5 million deaths each year and saving hundreds of thousands of children from irreversible blindness. Vitamin A therapy is a standard treatment in children with measles infection in developing countries. Measles infection itself causes a transient immune-suppression. Measles as an acute catabolic disease is thought to use up body reserves of nutrients, making the child more vulnerable to disease in the first instance and unable to counter the effects of the disease. The risk of dying from diarrhea, malaria, and measles was increased by around 20–24% in Vitamin A–deficient children (Rice et al. 2003).
Iron is readily available in many foods, especially meat, fish, and poultry, as well as in some leafy vegetables such as spinach. WHO estimates that 4–5 billion people worldwide, many of them women of reproductive age and children under 12 (as many as half of all such women and children in developing countries), are affected by iron-deficiency-induced anemia. Iron deficiency is associated with malaria, intestinal parasitic infestations, and chronic infections. One strategy to mitigate iron deficiency has been to promote the use of home gardens with small animals. Other strategies include food fortification and the eradication of infections.
Iodine deficiency is the world’s most prevalent—yet easily preventable—cause of brain damage. Iodine deficiency disorders jeopardize children’s mental health. They affect over 740 million people, 13% of the world’s population; 30% of the remainder are at risk. Chronic iodine deficiency causes goiter in adults and children. Serious iodine deficiency during pregnancy may result in stillbirths, abortions, and congenital abnormalities such as cretinism— a grave, irreversible form of mental retardation that has affected people living in iodine-deficient areas of Africa and Asia (Aquaron et al. 1993; Hsairi et al. 1994; Foo et al. 1994; Yusuf et al. 1994). Global rates of goiter, mental retardation, and cretinism are all falling, attributed in varying degrees to the increased use of iodized salt (WHO 2004b). Of far greater global and economic significance, however, is iodine deficiency disorder’s less visible yet more pervasive level of mental impairment that lowers intellectual development.
The consequences of severe human zinc deficiency have been known since the 1960s, but only more recently have the effects of milder degrees of zinc deficiency, which are highly prevalent, been recognized. Trials have shown that zinc supplementation results in improved growth in children; lower rates of diarrhea, malaria, and pneumonia; and reduced child mortality. In total, about 800,000 child deaths per year and, through deaths and increased rates of infectious diseases in affected areas, some 1.9% of DALYs are attributed to zinc deficiency. The incidence of diarrhea is increased around 20% in zinc-deficient children and that of pneumonia around 10–40% (Black 2003).
8.5.1.3 Hunger
Undernutrition can be broadly categorized into protein energy undernutrition (the result of a diet lacking enough protein and calorie sources) and (specific) micronutrient deficiencies. PEM is probably the most important factor contributing to nutrition-related mortalities (Habicht 1992).
FAO estimates that 852 million people worldwide did not have enough food to meet their basic daily energy needs in 2000– 02. This includes 9 million in industrial countries, 28 million in countries in transition, and 815 million in developing countries (FAO 2004a). Some 519 million hungry people live in Asia and the Pacific and 204 million in sub-Saharan Africa, around 60% and 24% respectively of the global total of undernourished people. Viewed as a share of regional population, this means that some 16% of Asians and 33% of sub-Saharan Africans are undernourished. The two most populous countries in the world—China and India—alone account for almost 43% of the global total of hunger, but the highest incidence rates, ranging from 40% to 55% of the population, are found in Eastern, Southern, and Central Africa (FAO 2004a).
The latest hunger estimates signal a disturbing reversal of trends reported since around 1970 of a gradual decline in both hunger incidence and the absolute number of hungry people. Between 1969–71 and 1995–97, the absolute number of hungry people in developing countries had fallen from around 959 million to 780 million people. During the period 1995–97 to 2000–02, however, while the proportion of undernourished in developing countries fell by 1%, the number of hungry increased by some 18 million people to a total of 815 million.
This trend reversal reported by FAO (2003) confirms the analysis of overall DES patterns globally undertaken by Wang and Taniguchi (2003). The regional trends in the number of undernourished in developing countries for the early to mid-1990s and from the mid-1990s to around 2000 are clearly shown in the upper panel of Figure 8.13. The progress in hunger reduction in the early 1990s occurred predominantly in China and India. But in the second half of the decade, progress in China slowed and in India reversed, while in the Near East and Central Africa the numbers of hungry increased throughout the 1990s. The large-scale humanitarian crisis existing in Central Africa has escalated unabated.
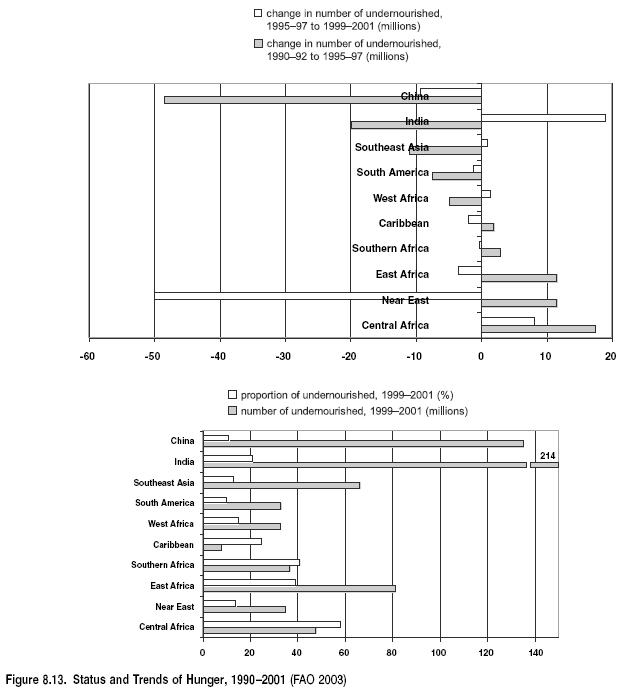
Chronic child hunger, in particular, is measured using anthropometric measures for height-for-age or stunting. Using cross-sectional data from 241 nationally representative surveys, de Onis et al. (2000) have shown that the prevalence of stunting in children has fallen in developing countries from 47% in 1980 to 33% in 2000 (by 40 million). Progress has not been uniform, however. Stunting has increased in East Africa but decreased in Southeast Asia, South Central Asia, and South America. Stunting has moderately improved in North Africa and the Caribbean. West and Central Africa show little progress. Despite the average decrease, child undernutrition remains a major public health problem.
Undernutrition has a huge global impact on morbidity and mortality due to infectious diseases. In spite of a general understanding that undernutrition increases susceptibility to infectious diseases, good estimates of etiological fractions for the influence of hunger on infectious disease mortality predominantly exist for children under five, where being underweight confers about 50% of the mortality risk for the main infectious diseases in the developing world like diarrhea, malaria, pneumonia, and measles (Schelp 1998; Cebu Study Team 1992). Child growth (also in utero, resulting in low birth weight) has again a very strong effect on morbidity and mortality. Birth weight alone is the single most important predictor of mortality in early life.
Evidence suggests that PEM is linked with higher malaria morbidity/mortality (Caulfield et al. 2004). Both malaria and chronic hunger have effects on child growth. Undernutrition is highly prevalent in many areas in which morbidity and mortality from malaria is unacceptably high. The global burden of malaria is associated with various nutrient deficiencies as well as underweight status. Although the association is complex and requires additional research, improved nutritional status lessens the severity of malaria episodes and results in fewer deaths due to malaria. Deficiencies in vitamin A, zinc, iron, and folate as well as other micronutrients are responsible for a substantial proportion of malaria morbidity and mortality. It is recommended that nutrition programs should be integrated into existing malaria intervention programs.
Diarrheal diseases are an important cause of mortality and morbidity in children, leading to more malnutrition but also being a consequence of undernutrition, as susceptibility to diarrheal diseases is increased in malnourished children (Lanata and Black 2001). There is ample evidence that giving formula and the early introduction of solids increases susceptibility to diarrhea, which emphasizes the importance of access to clean water.
Disease affects a person’s development from a very early age. Gastroenteritis, respiratory infections, and malaria are the most prevalent and serious conditions that can affect development in the first three years of life. It is estimated that children under the age of five in developing countries suffer from 3.5 episodes of diarrhea per year and between four and nine respiratory tract infections in their first two years of life (Mirza et al. 1997). Infections affect children’s development by reducing their dietary intake, by causing a loss of nutrients, or by increasing nutrient demand as a result of fever.
Undernutrition also plays a significant role in morbidity among adults. The link between morbidity from chronic disease and mortality, on the one side, and a high body mass index, on the other side, has been recognized and analyzed in industrial countries primarily for the purpose of determining life insurance risk. These relationships have also been studied in developing countries. A study on Nigerian men and women has shown mortality rates among chronically energy-deficient people who are mildly, moderately, and severely underweight to be 40%, 140%, and 150% greater than rates among non-chronically energy-deficient people (ACC/SCN 2000).
There are also linkages between food provision and HIV/AIDS. Not only does good nutrition of afflicted individuals help maintain the quality of their life, but in a rural environment there are implications for the feasibility of continued engagement in food production activities. One challenge is to minimize demands on a household labor pool that is severely depleted by the incapacitation of the afflicted family member and the time devoted to care giving by other family members (Gillespie and Haddad 2002).
8.5.1.4 Obesity and Overweight
Obesity has become a global epidemic. At present over 1 billion adults are overweight, with at least 300 million considered clinically obese, up from 200 million in 1995 (WHO 2003a). Obesity is now a major determinant of the global burden of chronic disease and disability. In many countries, significant incidence of both obesity and undernutrition may co-exist. (See Figure 8.14.) Obesity is a complex condition, with serious social and psychological dimensions, and can be found across almost all ages and socioeconomic groups (WHO 2003a). The prevalence of overweight and obesity is commonly assessed using the body mass index, which is defined as the weight in kilograms divided by the square of the height in meters (kilograms per square meter). A BMI of over 25 kilograms per square meter is defined as overweight, and a BMI of over 30 kilograms per square meter as obese (WHO 2003a).
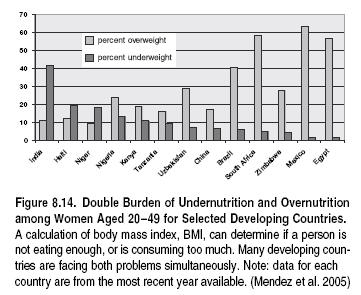
Rising rates of obesity and overweight are due to both reduced physical activity and increased consumption of more energy-dense, nutrient-poor foods with high levels of sugar and saturated fats. Obesity rates often increase faster in developing countries than in industrial ones (Chopra 2002; WHO 2003a). The underlying causes of these trends include urbanization, income growth, changing lifestyles, and globalization of and convergence of ‘‘western’’ diets, the ‘‘diet transition.’’ This transition is generally associated with an epidemiological transition in which disease patterns shift over time so that infectious and parasitic diseases are gradually but not completely displaced, and noncommunicable diseases become the leading cause of death (Uusitalo et al. 2002). WHO reports that NCDs now account for 59% of the 57 million deaths annually and 46% of the global burden of disease. There is a well-established link between an unhealthy diet and several of the most important of these NCDs, including coronary heart disease, cerebrovascular disease, various cancers, diabetes mellitus, dental caries, and various bone and joint diseases (WHO 2003b). Low levels of physical activity exacerbate dietary causes of increased risk of NCDs (WHO 2003b).
Obesity rates have tripled or more since 1980 in some areas of North America, the United Kingdom, Eastern Europe, the Middle East, the Pacific Islands, Australasia, and China. Current obesity levels range from below 5% in China, Japan, and certain African nations to over 75% in urban Samoa. But even in relatively low prevalence countries like China, rates are almost 20% in some cities (WHO 2003a). A study by the Centers for Disease Control and Prevention in the United States found that almost 65% of Americans are overweight and around one quarter are obese (Flegal et al. 2002).
Child obesity is a growing concern and is already an epidemic in some areas. Based on an analysis of 160 nationally representative cross-sectional surveys from 94 countries, the global prevalence of overweight among pre-school children was assessed at 3.3%, representing, in developing countries, some 17.6 million children (de Onis et al. 2000). According to the U.S. Surgeon General, the number of overweight children in the United States has doubled and the number of overweight adolescents has tripled since 1980 (WHO 2003a).
Overweight and obesity lead to adverse metabolic effects on blood pressure, cholesterol, triglycerides, and insulin insensitivity (Rguibi and Belahsen 2004). Non-fatal health problems include respiratory chronic musculoskeletal problems, skin problems, and infertility. The more life-threatening problems are cardiovascular disease, conditions associated with insulin resistance such as type-2 diabetes, and certain types of cancers, especially the hormonally related and large-bowel cancers and gall bladder disease (WHO 2003b). Four out of the 10 leading global disease burden risk factors for NCDs identified by WHO (2002a) were diet-related: high blood pressure, high cholesterol, obesity, and insufficient consumption of fruits and vegetables.
An estimated 16.7 million deaths, or almost 30% of the global total, result from various forms of cardiovascular disease (WHO 2004c). Many of these are preventable by action on the major primary risk factors: unhealthy diet, physical inactivity, and smoking. Cancer accounts for about 7.1 million deaths annually (12.5% of the global total). Dietary factors account for about 30% of all cancers in western countries and approximately up to 40% in developing countries. Diet is second only to tobacco as a preventable cause (WHO 2004c). And up to 2.7 million lives could potentially be saved each year with sufficient global fruit and vegetable consumption (WHO 2004c). Fruits and vegetables as part of the daily diet could help prevent major NCDs such as cardiovascular disease and certain cancers.
A number of concerns have been raised concerning the convergence of diets that accompanies globalization, in addition to the negative effects on health and nutrition. These are loss of cultural identity and increased resource use in food production and transportation (Bruinsma 2003). It is estimated, for example, that an average American diet requires about three times as much nitrogen fertilizer per capita as the average Mediterranean diet (Howarth et al. 2002).
The simplification of diets in terms of food sources as a consequence of the nutrition transition has also had implications on demand for certain types of food and hence on the structure of crop, livestock, and aquaculture production systems as well as the genetic diversity they embody (Johns 2003). Although an increasing number of processed foods are available, particularly in urban and higher-income [[market]s], the species (Species diversity) and intra-species diversity of food sources is narrowing (Johns 2003).
Conversely, agricultural intensification and the simplification of agricultural landscapes can limit the availability of and access to wild foods and to food plants growing as weeds that may be of nutritional importance, especially to landless poor people and to vulnerable groups within households (Scoones et al. 1992). Similarly, the decline of traditional fisheries (following commercial exploitation of coastal fisheries and damage to inland water ecosystems due to water extraction and diversion) can have severe negative nutritional consequences for poor artisanal fishers (DFID 2002).
8.5.2 Food Safety
Illness as a result of contaminated food is a widespread health problem and an important factor in reduced economic productivity. The global incidence of food-borne disease is difficult to estimate, but it has been reported that in 2000 alone 2.1 million people died from diarrheal diseases, and it is estimated that 70% of the 1.5 billion global episodes of diarrhea are due to biologically contaminated food (WHO 2002b). Additionally, diarrhea is a major contributor to malnutrition in infants and young children. In industrial countries, up to 30% of people reportedly suffer from food-borne diseases each year (WHO 2002b). In the United States, for example, around 76 million cases of food-borne diseases, resulting in 325,000 hospitalizations and 5,000 deaths, are estimated to occur each year (Mead et al. 1999).While the situation in developing countries is less documented, they bear the brunt of food safety problems due to the presence of a wide range of food-borne diseases, including those caused by parasites. For example, cholera is a major public health problem in developing countries (WHO 2002b).
Food contaminants can occur naturally or as a result of poor or inadequate production, storage, and handling. Hazardous agents include microbial pathogens, zoonotic disease agents, parasites, myco- and bacterial toxins, antibiotic drug residues, hormones, and pesticide residues. Genetically modified organisms and their potential to contain allergens or toxins have also begun to receive attention (Unnevehr 2003). Food safety risks vary with climate, diet, income level, and public infrastructure, and food-borne pathogens are more prevalent in developing countries, where food safety may be as important as food security for health and nutrition. Consumption of contaminated food may cause children to be stunted, underweight, and more susceptible to infectious diseases in childhood and later in life.
In addition to food safety risks associated with uncontrolled endemic diseases found in developing regions, there are also food safety risks that appear in highly developed production systems when animal concentrations are high, feeds contain contaminants, or meat and milk are improperly handled. There have been outbreaks of several zoonotic diseases (those naturally transmitted from animals to humans) recently in people, including avian influenza, severe acute respiratory syndrome, and Creutzfeldt-Jakob Disease. Of 1,709 human pathogens, 832 are zoonotic, and of 156 emerging diseases, 114 are zoonotic. Overall, zoonotic pathogens are more than three times more likely to be associated with emerging diseases than non-zoonotic pathogens. Examples include influenza, brucellosis, bovine spongiform encephalopathy, tuberculosis, and rabies (Kaufmann and Fitzhugh 2004).
Genetically modified foods are increasingly receiving attention in the food safety debate with regard to toxicity, allergenicity, stability of the modified genetic composition, nutritional effects associated with genetic modification, and unintended effects as a result of gene insertion (WHO 2005). Outcrossing (the movement of genes from GM plants into conventional crops or related species in the wild), as well as the mixing of crops derived from conventional seeds with those grown using GM crops, may have an indirect effect on food safety and food security if the gene products are toxic. The risk of seed mixing is real, as was shown when traces of a maize type that was only approved for feed use appeared in maize products for human consumption in the United States (WHO 2005).
GM foods currently available on the international market have passed risk assessments and are not likely to present risks for human health (WHO 2005). In the developing world, the approval and cultivation of GM crops is largely limited to soybean, maize, and cotton in Argentina, Brazil, China, India, Mexico, and South Africa (James 2004). Consumption of GM foods has not shown any adverse effects on human health in the general population in the countries where they have been approved. Nevertheless, food safety assessments are essential to GM approvals and thus need to be started early in the process of GM crop development (Unnevehr 2003).
Pesticide residues on food are also of growing concern. In the United States, for example, the Environmental Protection Agency has set maximum legal limits for pesticide residues on food commodities for sale domestically. In the most recent U.S. Food and Drug Administration studies, dietary levels of most pesticides were less than 1% of the acceptable daily intake established by the FAO and WHO (Bessin 2004). Consumption of pesticide residues in food remains a significant problem in most developing countries, however, especially for food that is produced and consumed locally (Dasgupta et al. 2002). Pesticides, especially organochlorides, are expected to increase in importance as a health concern, particularly in the context of multiple pesticide exposure. Although the long-term effects of pesticide exposure remain uncertain, evidence suggests that toxins may increase carcinogenic and neurotoxic health risks in susceptible sub-groups (Alavanja et al. 2004; Maroni and Fait 1993).
8.5.3 Household Economic Impacts
Consumption of food is also linked to cognitive development and labor productivity. Nutrition has a dynamic and synergistic relationship with economic growth through the channel of education, and the evidence shows that the causality works in both directions: better nutrition can lead to higher cognitive achievement and increased learning capacity, and thus to higher labor productivity as well as higher incomes. And higher levels of education lead to better nutrition.
8.5.3.1 Nutrition and Cognitive Development
This dual causality between nutrition and cognitive development is complex and varies over the life cycle of a family. In utero, infant, and child nutrition can all affect later cognitive achievement and learning capacity during school years, ultimately increasing the quality of education gained as a child, adolescent, and adult. Parental education affects in utero, infant, and child nutrition directly through the quality of care given (principally maternal) and indirectly through increased household income. Human capital development, primarily through education, has received merited attention as a key to economic development (Verner 2004), but early childhood nutrition has yet to obtain the required emphasis as a necessary facilitator of education and human capital development.
Despite the limited evidence demonstrating a causal link between poor nutrition and cognitive achievement, systematic evidence supports the argument that policy interventions in early childhood nutrition are crucially important for cognitive achievement, learning capacity, and, ultimately, household welfare. Specifically, available studies (Horton 1999) have shown that:
- PEM deficiency, as manifested in stunting, is linked to lower cognitive development and educational achievement;
- low birth weight is linked to cognitive deficiencies;
- iodine deficiency in pregnant mothers negatively affects the mental development of their children;
- iodine deficiency in children can cause delayed maturation and diminished intellectual performance; and
- iron deficiency can result in impaired concurrent and future learning capacity.
Children are most vulnerable to malnutrition in utero and before they reach three years of age, as growth rates are fastest and they are most dependent on others for care during this period. However, nutrition interventions, such as school feeding programs, among children of school age are also important for strengthening learning capacity.
Yet there remains significant uncertainty surrounding estimates of the monetary costs associated with the impact of hunger and malnutrition on school performance. Nevertheless, Behrman (2000) cites three studies suggesting that, by facilitating cognitive achievement, child nutrition and schooling can significantly increase wages. Micronutrients from animal-source foods are especially important in the health of women of reproductive age and in the cognitive development and school performance of children (Neumann and Harris 1999). Behrman (2000) concludes that while the link between health and educational attainment is not as robust as most studies suggest, and specific cost-benefit analysis is difficult to carry out, policies supporting nutrition make good sense, and the empirical basis for this is as sound as that of many other conventional assumptions in economics.
8.5.3.2 Nutrition and Labor Productivity
Much of the empirical work linking economic outcomes to nutrition to date has focused on agriculture, and it attempts to link farm output, profits, wages, or labor allocation choices to indicators of nutritional intake such as calories or to nutritional outputs such as weight-for-height, BMI, and height. Widely cited work by Strauss (1986) links the average calorie intake per adult in a household to the productivity of on-farm family labor in Sierra Leonean agriculture. For this sample, on average, a 50% increase in calories per consumer equivalent increased output by 16.5%, or 379 kilograms. For an increase of 50% in hours of family labor or in the area of cultivated land, this compares with an output response of 30% and 13%, respectively. Significantly, Strauss’s findings show that the lower the calorie intake is, the more significant the output response is to increased calorie intake. For example, based on a daily intake of 1,500 calories per consumer equivalent, a mere 10% increase in calorie intake would increase output by nearly 5%.
Findings from Ethiopia, presented in Croppenstedt and Muller (2000), show that a 10% increase in weight-for-height and BMI would increase output and wages by about 23% and 27%, respectively. They also find that height, an indicator of a person’s past nutritional experience, is a significant determinant of wages in Ethiopia, with a person who is 7.1 centimeters above the average height earning about 15% more wages. These findings have to be contrasted with the effect of other productivity-augmenting investments, such as education. Nutrition would appear to compare well with the 4% increase in cereal output attributed to an additional year of schooling in a rural Ethiopian household.
Poor nutritional status not only reduces a person’s output, it may also prevent them from carrying out certain tasks. A study in Rwanda found that those who are poorly fed have to choose activities that are physically less demanding—and less well paid (Bhargava 1997). A low BMI and poor nutritional status may also limit productivity indirectly through absenteeism and reduced employment opportunities. Moreover, to carry out certain activities, undernourished people may have to put their muscle mass and heart rate under much greater strain than well-nourished people do, requiring more energy to produce the same output, which may lead to health problems in the long term.
There is also an increasing awareness of the role of micronutrients in people’s nutritional status, as described earlier. For example, iron deficiency in adults negatively affects productivity as well as contributing to absenteeism. Basta et al. (1979) found that productivity among Indonesian rubber plantation workers with anemia was reduced by 20% compared with non-anemic workers. There is also some evidence that iodine deficiency during adulthood reduces productivity and work capacity (Hershman et al. 1986).
8.5.4 Macroeconomic Growth
There is clear evidence of an association between improvements in nutrition and improvements in macroeconomic growth, but the nature and strength of the association is sensitive to the context and time frame (Easterly 1999; Arcand 2001; Wang and Taniguchi 2003). Overall, inadequate nutrition is estimated to cause losses of between 0.23% and 4.7% per year in per capita GDP growth rates worldwide (Arcand 2001). Improved nutrition affects economic growth directly through its impact on labor productivity and indirectly through improvements in life expectancy. The reverse is also true, and analysis using 81 indicators found that a 1% increase in per capita GDP raises per capita calorie intake by approximately 540 kilocalories a day (Easterly 1999). Differences in economic growth explained 40% of cross-country differences in improved mortality rates over the last three decades (Pritchett and Summers 1996), while in a separate study covering some 65 countries between 1970 and 1995, half of the decline in child malnutrition from 1970 to 1995 could be attributed to income growth (Smith and Haddad 2000). Half of the economic growth that occurred in the United Kingdom and France in the eighteenth and nineteenth centuries has been attributed to improvements in nutrition and health (Fogel 1994).
More recent and comprehensive analysis of 114 countries over the period 1961–99 found that, on average, the GDP growth rate increased by 0.5% per capita for each 500 kilocalorie-per-day increase in dietary energy supply (Wang and Taniguchi 2003). However, the results differed significantly between country groups and short-term and long-term perspectives. For some groups (East and Southeast Asia), GDP growth was up to four times higher, while in others (sub-Saharan Africa) GDP growth was absent or negative. Furthermore, short-term GDP impacts were also ambiguous (a mix of positive, neutral, and negative impacts). This is explained on the basis of a ‘‘nutrition trap’’ for some countries, particularly—and persistently—in sub-Saharan Africa. In such countries, significant increases in DES often translate into an expansion in short-term [[population (Population growth rate)] growth rates] that depress both per capita DES and GDP. To overcome this, nutrition and income need to attain levels at which further increases in DES do not promote population expansion, or DES increases need to be large and sustained (Wang and Taniguchi 2003).
8.5.5 Cultural Aspects
Food is not just an economic good and a requirement for good health, but also a centerpiece of culture. It is no coincidence that the word ‘‘company’’ stems from com, meaning together and panis meaning bread. Recalling the quasi-mystical status of the yam in much of African culture, Wole Soyinka, the Nigerian Nobel laureate for literature, speaking on the role of cultural leaders in changing attitudes and behaviors related to food and nutrition, said ‘‘Food is allied to culture in the most organic, interactive way, and one may be brought to the aid of, in enhancement of, or in celebration of the other’’ (IFPRI 2004).
Cultural aspects of food and acquired tastes (a type of ‘‘food bias’’) can be significant determinants of both physical and economic well-being. For example, in drought-prone southern Zambia, some drought-resistant crops, such as millet and sorghum, are not cultivated because southern Zambians have not acquired a taste for them despite the fact that these foods could provide food security during times of drought.
Food is so integral to the formation of cultural identities and global unity that 2004 was declared ‘‘The International Year of Rice’’ by FAO, to commemorate rice as a life force having ‘‘enormous impact on human nutrition and global food security’’ (FAO 2004). A grain of rice is compared with a grain of gold in Southeast Asia, and many Japanese perceive rice as the ‘‘heart’’ of their culture. Rice, along with many other foods, is used for consumption by people every day, as well as to celebrate religious and social holidays, festivals, and other special occasions.
Indeed, food rituals form the core of many religious rituals, and inadvertently affect [[market]s] and trade. Taboos associated with different types of food also set apart cultures, sects, and denominations. Not only do these taboos and rituals help promote social solidarity and maintain cultural boundaries, they also promote ‘‘food bias’’ and, thereby, contribute to the kinds of food trade a culture will initiate and promote. For example, religious beliefs associated with pigs in the Judaic and the Muslim traditions are not likely to initiate any pork trade in these regions. Similarly, Hinduism’s taboo of beef, due to the sacred allegiance to the cow, can adversely affect the beef trade in certain regions of India. In North America, the turkey has become a cultural symbol associated with Thanksgiving, and more broadly is associated with Christmas, generating a large turkey trade during these seasons.
Recognizing that the enjoyment of wholesome food is important in the pursuit of happiness and, in part, as a backlash to the rapidly growing western/urban culture of fast food, a small but rapidly growing grassroots movement has been established that seeks to maintain the cultural significance of food and its consumption (Jones et al. 2003).
8.5.6 Distributional Dimensions
In low-income countries, most of which are characterized by a relatively large share of agriculture in the economy and a high proportion of rural population, food production has critical distributional impacts in the form, for example, of income or health inequalities. It has impacts on poverty alleviation, reduced inequalities in food consumption, improved nutrition and health, low commodity and food prices, and direct and indirect employment and income generation. The size and pattern of these impacts depend on a number of factors: the rate of growth of agricultural and food production across regions and types of crops, agriculture’s share in the economy, the proportion of the population that is rural, asset (mainly land) distribution, rural infrastructure, well-functioning markets, availability of agricultural inputs and credit to the poorer farmers and in remote areas, and adequate research and extension (von Braun 2003).
Thus a whole set of factors combine to have a broad and equitable impact from increased food productivity. This explains the continued food distributional inequalities despite food production per capita increasing globally. Increased local food production remains critical to alleviating poverty and providing food security. In general, the experience of the last few decades shows that the higher the food (and agricultural) output (especially when it is due to higher labor and land productivity), the more equal the land distribution, the better the small farmer’s access to inputs and markets, and the less suppression of agricultural prices, the greater is the positive impact on income and consumption distribution, poverty alleviation, and food security for the poor (von Braun 2003). Further, the more ‘‘distribution friendly’’ variables that are present, the stronger is their synergistic impact.
Livestock are also a significant source of income and consumption in low-income countries. Often they provide a supplementary source of income and income stability. However, in many cases livestock are a vital, even the sole, source of income for the poorest, the landless, pastoralists, sharecroppers, and widows. They are one of the few assets available to these groups. Livestock also allow the rural poor to exploit common property resources, such as open grazing areas, in order to earn incomes and reduce income variability, especially in semiarid areas.
References
- ACC/SCN (Administrative Committee on Coordination/Standing Committee on Nutrition), 2002: Nutrition: A Foundation for Development (12 briefs). Geneva.
- ACC/SCN, 2000: Fourth report on the World Nutrition Situation: Nutrition Throughout the Life Cycle. ACC/SCN in collaboration with the International Food Policy Research Institute, Geneva, 121 pp.
- Acquaye, A.K.A., J.M. Alston, and P.G. Pardey, 2003: Post-war productivity patterns in U.S. agriculture: influences of aggregation procedures in a statelevel analysis. American Journal of Agricultural Economics, 85(1), 59–80.
- Alavanja, M.C.R., J.A. Hoppin, and F. Kamel, 2004: Health effects of chronic pesticide exposure: Cancer and neurotoxicity. Annual Review of Public Health, 25, 155–197.
- Alston, J.M., 2002: Spillovers. Australian Journal of Agricultural and Resource Economics, 46(3), 315–346.
- Alston, J.M., C. Chan Kang, M.C. Marra, P.G. Pardey, and T.J. Wyatt. 2000. A Meta-Analysis of Rates of Return to Agricultural R&D: Ex Pede Herculem? Research Report 113. International Food Policy Research Institute, Washington. 148 pp.
- Aquaron, R., K. Zarrouck, M. Eljarari, R. Ababou, A. Talibia, and J.P. Ardissone, 1993: Endemic goiter in Morocco (Skoura-Toundoute areas in the high Atlas). Journal of Endocrinological Investigation, 16(1), 9–14.
- Arcand, J. 2001. Undernourishment and Economic Growth: the Efficiency Cost of Hunger. FAO Economic and Social Development Paper No. 147, FAO, Rome, 60 pp.
- Baillie J.E.M., C. Hilton-Taylor, and S. Stuart (eds.), 2004: 2004 IUCN Red List of Threatened Species: A Global Species Assessment. International Union for the Conservation of Nature, Gland, Switzerland, and Cambridge, UK, 217 pp.
- Basta, S., S. Soekirman, D. Karyadi, and N.S. Scrimshaw, 1979: Iron deficiency anemia and the productivity of adult males in Indonesia. American Journal of Clinical Nutrition, 32, 916–925.
- Behrman, J., 2000. Literature Review on Interactions between Health, Education and Nutrition and the Potential Benefits of Intervening Simultaneously in All Three. International Food Policy Research Institute, Washington, DC, 33 pp.
- Bene, C., A. Neiland, T. Jolley, S. Ovie, O. Sule, B. Ladu, K. Mindjimba, E. Belal, F. Tiotsop, and M. Baba, 2003: Inland fisheries, poverty, and rural livelihoods in the Lake Chad Basin. Journal of Asian and African Studies, 38(Part 1), 17–51.
- Berdegue, J.A., F. Balsevich, L. Flores, D. Mainville, and T. Reardon, 2003: Food Safety and Food Security in Food Trade. Case Study: Supermarkets and Quality and Safety Standards for Produce in Latin America. Focus 10. Brief 12 of 17. International Food Policy Research Institute, Washington, DC, 2 pp.
- Bessin, R.T., 2004: Pesticide residues in foods: is food safety just a matter of organic vs. traditional farming? [online] Lexington: University of Kentucky Entomology. Cited February 18, 2005. Available at http://www.uky.edu/ Agriculture/Entomology/entfacts/misc/ef009.htm.
- Bhargava, A., 1997. Nutritional status and the allocation of time in Rwandese households. Journal of Econometrics, 77, 277–295.
- Black, R.E., 2003. Zinc deficiency, infectious disease and mortality in the developing world. The Journal of Nutrition, 133(5), 1485–1489.
- Blisard, N. and J.R. Blaylock, 1993: US Demand for Food: Household Expenditures, Demographics and Projections for 1990–2010, Economic Research Service, United StatesWashington, DC. Department of Agriculture, Technical Bulletin 1818, December 1993,
- Bread for the World Institute, 2003: Agriculture in the Global Economy, Hunger 2003. 13th Annual Report on the State of the World’s Hunger. Washington DC, 157 pp.
- Bruinsma, J. (ed.), 2003: World Agriculture: Towards 2015/2030, An FAO Perspective. Earthscan and FAO, London and Rome, 432 pp.
- Caddy, J.F, 1993: Contrast between recent fishery trends and evidence for nutrient enrichment in two large marine ecosystems: the Mediterranean and the Black Seas. In: Kenneth Sherman, et al. (eds.), Large Marine Ecosystems: Stress, Mitigation, and Sustainability, American Association for the Advancement of Science, Washington, DC, pp.137–147.
- Carlson, R.E., D.P. Todey, and S.E. Taylor, 1996: Midwestern corn yield and weather in relation to extremes of the Southern Oscillation. Agronomy Journal/ Production Agriculture, 9, 347–352.
- Carter, C. and B. Zhang, 1998: The weather factor and variability in china’s grain supply. J Comparative Economic 26, 529.
- Cassman, K.G., 2001. Crop science research to assure food security. In: J. Noesberger et al. (eds.), Crop Science: Progress and Prospects. CAB International, Wallingford, UK. pp. 33–51.
- Cassman, K.G., 1999: Ecological intensification of cereal production systems: yield potential, soil quality, and precision agriculture. Proceedings of the National Academy of Sciences, 96, 5952–5959.
- Cassman, K.G., A. Dobermann, D.T. Walters, and H. Yang, 2003: Meeting cereal demand while protecting natural resources and improving environmental quality. Annual Review of Environmental Resources, 28, 315–358.
- CAST (Council for Agricultural Science and Technology), 1999: Animal Agriculture and Global Food Supply. Ames, Iowa, 92 pp.
- Caulfield, L.E., S.A. Richard, and R.E. Black. Undernutrition as an Underlying Cause of Malaria Morbidity and Mortality. DCPP Working Paper No. 16, Center for Human Nutrition, Bloomberg School of Public Health, The Johns Hopkins University, Baltimore, MD, 38 pp.
- Cebu Study Team, 1992: A child health production function estimated from longitudinal data. Journal of Development Economics, 38(2), 323–351.
- Chang, S.W., 2003: WTO Disciplines on fisheries subsidies: a historic step towards sustainability? Journal of International Economic Law, 6(4), 879–921.
- Chopra, M., 2002: Globalization and food: implications for the promotion of healthy diets. In: Globalization, Diets and Non-communicable Diseases. WHO, Geneva, 185 pp.
- Clark, G., M. Huberman, and P. Lindert, 1995: A British food puzzle, 1770– 1850, Economic History Review, 48 (2), 215–37.
- Coates, D., 1995: Inland Capture Fisheries and Enhancement: Status, Constraints and Prospects for Food Security. FISHAID Project, Port Moresby, Papua New Guinea. Report presented at the International Conference on Sustainable Contribution of Fisheries to Food Security, Kyoto, Japan, 4–9 December.
- Conway, G., 1999: The Doubly Green Revolution: Food for all in the 21st Century. Cornell University Press, Ithaca, 335 pp.
- Cooper, H.D., T. Hodgkin, and C. Spillane, 2000: Broadening the Genetic Base of Crop Production. Commonwealth Agricultural Bureaux International/ Food and Agriculture Organization/ International Plant Genetics Research Institute. Rome, 480 pp.
- Cromwell, E., D. Cooper, and P. Mulvany, 2001: Agricultural Biodiversity and Livelihoods: Issues and Entry Points for Development Agencies. Overseas Development Institute, London, 52 pp.
- Croppenstedt, A. and C. Muller, 2000: The impact of farmers’ health and nutritional status on their productivity and efficiency: evidence from Ethiopia. Economic Development and Cultural Change, 48 (3), 475–502.
- Dasgupta S., C. Meisner, D. Wheeler, and Y. Jin, 2002: Agricultural trade, development and toxic risk. World Development, 30(8), 1401–1412.
- Delgado, C., M. Rosegrant, and N. Wada, 2003: Meating and milking global demand: stakes for small-scale farmers in developing countries. In: The Livestock Revolution: A Pathway from Poverty? Record of a Conference Conducted by the ATSE Crawford Fund. Parliament House, Canberra, 13 August 2003. A festschrift in honor of Derek E. Tribe.
- Delgado C., M. Rosegrant, H. Steinfeld, S. Ehui, and C. Courbois, 1999: Livestock to 2020: The Next Food Revolution. Food, Agriculture and the Environment Discussion Paper 28. 2020 Vision. International Food Policy Research Institute. Washington, DC, 83 pp.
- Delgado C., J. Hopkins, and V. Kelly, with P. Hazell, A. McKenna, P. Gruhn, B. Hoijati, J. Sil, and C. Courbois, 1998: Agricultural Growth Linkages in sub- Saharan Africa. International Food Policy Research Institute, Research Report No.107, Washington, DC, 154 pp.
- Delisle, H., 1990: Patterns of Urban Food Consumption in Developing Countries: Perspectives from the 1980s. FAO, Rome, 92 pp.
- Denison, R.F., 2003: Darwinian agriculture: When can humans find solutions beyond the reach of natural selection? Quarterly Review of Biology 78, 145– 168.
- de Onis M., E.A. Frongillo, and M. Blossner, 2000: Is malnutrition declining? an analysis of changes in levels of child malnutrition since 1980. Bulletin of the World Health Organization, 78 (10), 1222–1233. World Health Organization, Geneva.
- Devendra, C., 2000: Animal production and rainfed agriculture in Asia: potential opportunities for productivity enhancement. Outlook on Agriculture, 29(3), 161–75.
- Devendra, C., C. Seville, and D. Pezo, 2001: Food-feed systems in Asia: review. Asian-Australasian Journal of Animal Science, 14(5), 733–745.
- DFID (Department for International Development, UK), 2002: Marine fisheries. Key sheets for sustainable livelihoods [online], cited February 28, 2005. Available at http://www.keysheets.org/green_8_marinefish.pdf.
- Diamond, J., 1999: Guns, Germs and Steel: The Fates of Human Societies. W. W. Norton and Company, New York. 480 pp.
- Diao, X., E. Diaz-Bonilla, S. Robinson, and D. Orden, 2005: Tell Me Where It Hurts, and I’ll Tell You Who to Call: Industrialized Countries’ Agricultural Policies and Developing Countries, MTID Discussion Paper No 84. International Food Policy Research Institute, Washington, DC.
- Döll, P. and S. Siebert, 1999: A Digital Map of Irrigated Areas. Report No. A9901, Center for Environmental Systems Research, Germany, University of Kassel.
- Easterly, W., 1999. Life during growth. Journal of Economic Growth, 4(3), 239– 276.
- Ehui, S., S. Benin, T. Williams, and S. Meijer, 2002: Food Security in sub-Saharan Africa to 2020. Socio-economics and Policy Research Working Paper 49. International Livestock Research Institute (ILRI): Nairobi, Kenya, 60 pp.
- Etkin, N.L. (ed.), 1994: Eating on the Wild Side: The Pharmacologic, Ecologic, and Social Implications of Using Noncultigens. University of Arizona Press, Tucson, AZ, 305 pp.
- Evans, L.T., 1998: Feeding the 10 Billion: Plants and Population Growth. Cambridge University Press, Cambridge, UK, 247 pp.
- Evenson, R.E. and D. Gollin, 2003: Assessing the impact of the green revolution. Science, 300, 758–762.
- Evenson, R.E., C. Pray, and M.W. Rosegrant, 1999: Agricultural Research and Productivity Growth in India. IFPRI Research Report No. 109. Washington, D.C., International Food Policy Research Institute, 103 pp.
- Ezzati, M., A. Lopez, A. Rodgers, S. Vander Hoorn, C. Murray, and the Comparative Risk Assessment Collaborating Group, 2002: Selected major risk factors and global and regional burden of disease. The Lancet, 360 (November), 1347–1360.
- FAO (Food and Agriculture Organization of the United Nations), 2004: International year of rice: rice is life. Online at: http://www.fao.org/rice2004/ en/rice-us.htm.
- FAO, 2004a: The State of Food Insecurity in the World. Monitoring Progress towards the World Food Summit and Millennium Development Goals. Rome.
- FAO, 2004b: The State of Food and Agriculture. Food and Agriculture Organization of the United Nations, Rome, 208 pp.
- FAO, 2003: The State of Food Insecurity in the World. Monitoring Progress Towards the World Food Summit and Millennium Goals. Rome. 37 pp.
- FAO, 2002: The State of World Fisheries and Aquaculture. FAO, Rome, 150 pp.
- FAO, 2001: The State of Food Insecurity in the World. Monitoring Progress towards the World Food Summit and Millennium Development Goals. Rome, 36 pp.
- FAO, 1999: Fishery Information, Data and Statistics Unit Fisheries Circular No. 929, Revision 2. Number of fishers 1970–1997. Rome, 106pp.
- FAO, 1998: The State of the World’s Plant Genetic Resources for Food and Agriculture. Rome, 29 pp.
- FAO, 1997: Computer Printout of FAOSTAT’s International Commodity Prices 1989–91. Personal communication via Technical Advisory Committee, CGIAR. Rome.
- FAO, 1996: The Global Plan of Action for the Conservation and Sustainable Use of Plant Genetic Resources for Food and Agriculture. Rome, 63 pp.
- FAO FISHSTAT, 2003: Online at: http://www.fao.org/fi/statist/statist.asp.
- FAO/ NACA (Network of Aquaculture Centers in Asia-Pacific), 2001: Manual of Procedures for the Implementation of the Asia Regional Technical Guidelines on Health Management for the Responsible Movement of Live Aquatic Animals, FAO Fisheries Technical paper 402/1. Rome. 106 pp.
- FAOSTAT, 2004: Food and Agriculture Organization of the United Nations, Statistical Databases. Online at: http://faostat.fao.org
- FAO/WHO (World Health Organization), 2002: Human Vitamin and Mineral Requirements. Report of a Joint Expert Consultation, Bangkok, Thailand. FAO, Rome, 303 pp.
- FAO/WHO/UNU (United Nations University), 1985: Energy and Protein Requirements. Report of a Joint FAO/ WHO/ UNU Expert consultation. WHO Technical Report Series, 724, 1–206.
- Flegal, K.L., M.D. Carroll, C.L. Ogden, and C.L. Johnson, 2002: Prevalence and trends in obesity among US adults, 1990–2000. Journal of the American Medical Association. 288(14), 1723–1727.
- Fogel, R., 1994: Economic growth population theory and physiology: the bearing of long-term processes on the making of economic policy. American Economic Review, 84 (3), 369–95.
- Foley, J.A., M.H. Costa, C. Delire, N. Ramankutty, and P. Snyder, 2003: Green surprise? how terrestrial ecosystems could affect earth’s climate. Frontiers in Ecology and the Environment, 1(1), 38–44.
- Foo, L.C., T. Zainab, G.R. Letchuman, M. Nafikudin, R. Arriman, P. Doraisingam, and A.K. Khalid, 1994: Endemic goiter in the Lemanak and Ai river villages of Sarawak. Southeast Asian Journal of Tropical Medicine and. Public Health, 25(3), 575–8.
- Galloway, J.N., F. Dentener, D. Capone, E. Boyer, R. Howarth, et al., 2004: Nitrogen cycles: past, present and future. Biogeochemistry, 70(2), 153–226.
- Gillespie, S. and L. Haddad, 2002: Food Security as a Response to AIDS. International Food Policy Research Institute, Annual Report Essay, in Aids and Food Security, IFPRI, WashingtonDC, pp. 10–16.
- Green, R.E., S.J. Cornell, J.P.W. Scharlemann, and A. Balmford, 2005: Farming and the fate of wild nature. Science 307, 550–555.
- Gu, L., 2003. Comment on ‘‘climate and management contributions to recent trends in US agricultural yields.’’ Science 300, 1505b.
- Habicht, J.P., 1992: Discussion: mortality, malnutrition and synergies: determinants and interventions. In: Child health priorities for the 90’s. K. Hill for The Johns Hopkins University, Baltimore, MD, pp. 215–220.
- Hazell, P.B.R. and C. Ramasamy (eds.), 1991: The Green Revolution Reconsidered: The Impact of High-yielding Rice Varieties in South India. Johns Hopkins University Press, Baltimore, MD, 286 pp.
- Hershman, J.M., G.A. Melnick, and R. Kastner, 1986: Economic consequences of endemic goiter. In: Towards the eradication of endemic goiter, cretinism and iodine deficiency. J.T. Dunn, E.A. Pretell, C.H. Daza, and F.E. Viteri (eds.), Pan-American Health Organization, Scientific Publication No. 502, Washington, DC, pp. 96–106.
- Horton, S., 1999: Opportunities for investment in nutrition in low-income Asia. Asian Development Review, 17 (1,2), 246–273.
- Howarth R.W., E. Boyer, W. Pabich, and J.N. Galloway, 2002: Nitrogen use in the United States from 1961–2000 and potential future trends. Ambio 31, 88–96.
- Hsairi, M., F. Ben Slama, C. Ben Rayana, R. Fakhfakh, B. Romdhane, et al., 2003: Prevalence of endemic goiter in the north western region of Tunisia. Tunis Medicine, 72(12), 663–669.
- IFPRI (International Food Policy Research Institute), 2004: Ready for Action in Africa? 2020 Vision Initiative. IFPRI Forum, Special Issue. May. Washington, DC, 8 pp.
- IFPRI/CIAT (International Center for Tropical Agriculture), 2002: Biofortification: Harnessing Agricultural Technology to Improve the Health of the Poor. Future Harvest, Washington, DC, 4 pp.
- Jackson, B.C.J., M.X. Kirby, W.H. Berger, K.A. Bjorndal, L.W. Botsford, et al., 2001: Historical overfishing and the recent collapse of coastal ecosystems. Science 293, 692.
- James, C., 2004: Preview: Global Status of Commercialized Biotech/GM Crops: 2004. ISAAA Briefs. No. 32. ISAAA, Ithaca, NY. 12 pp.
- Janick, J. and J.E. Simon (eds.), 1993: New Crops: Exploration, Research and Commercialization. American Society of Agronomy, John Wiley & Sons, Inc., New York, 710 pp.
- Johns, T., 2003. Plant biodiversity and malnutrition: simple solutions to complex problems. African Journal of Food, Agriculture, Nutrition and Development. 3(1), 45–52.
- Johns, T., 1990: With Bitter Herbs They Shall Eat It: Chemical Ecology and The Origins of Human Diet and Medicine. University of Arizona Press, Tucson, AZ, 356 pp.
- Johns, T. and B.R. Sthapit, 2004: Biocultural diversity in the sustainability of developing country food systems. Food and Nutrition Bulletin 25, 143–155.
- Jones, G.V., M.A. White, and O.R. Cooper, 2004: Climate change and global wine quality. Climatic Change (in review).
- Jones, P., P. Shears, D. Hillier, D. Comfort, and J. Lowel, 2003: Return to traditional values? a case study of slow food. British Food Journal, 105(4–5), 297–304.
- Kaimowitz, D., 1996: Livestock and Deforestation in Central America in the 1980s and 1990s: A Policy Perspective. Center for International Forestry Research CIFOR, Bogor, Indonesia, 95 pp.
- Kaufmann, R. and H. Fitzhugh, 2004: Importance of livestock for the world’s poor. In: Perspectives in World Food and Agriculture. C. Scanes and J. Miranowski (eds). Iowa State Press, 485 pp.
- Kent, G., 1987: Fish, Food and Hunger: The Potential of Fisheries for Alleviating Malnutrition. Westview Press, London, 201 pp.
- Koziell, I. and J. Saunders (eds.), 2001: Living Off Biodiversity: Exploring Livelihoods and Biodiversity Issues in the Natural Resources Management, International Institute for Environment and Development, London, 269 pp.
- Kuhnlein, H.V., O. Receveur, and H.M. Chan, 2001, Traditional food systems research with Canadian indigenous peoples. International Journal of Circumpolar Health 60(2), 112–112.
- Lanata, C.F. and R.E. Black, 2001: Diarrheal diseases. In: Nutrition and Health in Developing Countries. R. Semba and M.W. Bloem (eds.) Humana Press Inc, Totowa, NJ, pp. 93–129.
- Lobell, D. and G. Asner, 2003: Climate and management contributions to recent trends in US agricultural yields. Science, 299, 1032.
- Mahar, D. and R. Schneider, 1994. Incentives for tropical deforestation. some examples from Latin America. In: The Causes of Tropical Deforestation. K. Brown, D.W. Pearce, (eds.), UCL Press, London, pp.159–171.
- Maroni, M. and A. Fait, 1993: Health—effects in man from long-term exposure to pesticides: a review of the 1975–1991 literature. Toxicology, 78, 1–3.
- Masters, W.A., 2005: Paying for prosperity: how and why to invest in agricultural R&D for development in Africa. Journal of International Affairs 58(2), 35–64.
- McIntire, J., D. Bourzat, and P. Pingali, 1992: Crop-livestock interactions in sub- Saharan Africa. World Bank, Washington, DC, 246 pp.
- Mead P.S., L. Slutsker, V. Dietz, L. F. McCaig, J.S. Bresee, et al., 1999: Food related illness and death in the United States. Emerging Infectious Diseases, 5(5), 607–625.
- Mellor, J.W. (ed.), 1995: Agriculture on the Road to Industrialization. Johns Hopkins University Press, Baltimore, MD, 358 pp.
- Mendez, M.A., C.A. Monteiro, and B.M. Popkin, 2005: Overweight exceeds underweight among women in most developing countries. American Journal of Clinical Nutrition, 81, 714 -21.
- Millennium Ecosystem Assessment, 2003: Ecosystems and Human Well-being. Island Press, Washington DC, 245 pp.
- Mirza, M.N., L.E. Caulfield, R.E. Black, and W.M. Macharia, 1997: Risk factors for diarrheal duration. American Journal of Epidemiology, 146(9), 776.
- Mori, H. andW.D.Gorman, 1999: A cohort analysis of Japanese food consumption– old and new generations. Senshu Economics Bulletin, 34( 2), 71–111.
- Myers, N.A., R.A. Mittermeier, C.G. Mittermeier, G.A.B. da Fonseca, and J. Kent, 2000: Biodiversity hotspots for conservation priorities. Nature, 403, 853–858.
- Naylor, R.L., W. Falcon, R. Goodman, M. Jahn, T. Sengooba, H. Tefera, and R. J. Nelson, 2004: Biotechnology in the developing world: a case for increased investments in orphan crops. Food Policy 29, 15–44.
- Naylor, R., W. Falcon, N. Wada and D. Rochberg, 2002: Using El Nino- Southern Oscillation climate data to improve food policy planning in Indonesia. Bulletin Indonesian Economic Studies, 38, 75.
- Naylor, R., R. Goldburg, J. Primavera, N. Kautsky, M. Beveridge, et al., 2000: Effect of aquaculture on world fish supplies. Nature, 405, 1017–1024.
- Neumann, C.G. and D.M. Harris, 1999: Contribution of Animal Source Foods in Improving Diet Quality for Children in the Developing World. [online] Commissioned paper for the World Bank, Washington, DC, cited 18 February 2005. Available at http://glcrsp.ucdavis.edu/projects/project_subpages/CNP_ folder/CNPWB.pdf.
- OECD (Organisation for Economic Co-operation and Development), 2004: Producer and Consumer Support Estimates OECD Database, 1986–2003. User Guide and Data Files. Online at: www.oecd.org/document/58/ 0,2340,en_2649_201185_32264698_1_1_1_1,00.html.
- OECD, 2003a: Agricultural Policies in OECD Countries: Monitoring and Evaluation. Paris, 296 pp.
- OECD, 2003b: OECD Agricultural Outlook 2003/2008. Paris, 212 pp.
- Ollila, E., n.d.: Kansainvälinen terveyspolitiikka.[online] Cited February 28 2005. Available at http://www.valt.helsinki.fi/staff/jkoponen/b1104/eeva ollilla220304.pdf.
- Pardey, P.G. and N.M. Beintema, 2001: Slow Magic: Agricultural R&D a Century after Mendel. International Food Policy Research Institute Food Policy Report. Washington DC, 30 pp.
- Parry, M.L., C. Rosenzweig, A. Iglesias, M. Lovermore, and G. Fishcher, 2004: Effects of climate change on global food production under SRES emissions and socio-economic scenarios. Global Environmental Change, 14, 53–67.
- Pauly, D., J. Alder, E. Bennett, V. Christensen, P. Tyedmers, and R. Watson, 2003: The future for fisheries. Science 302, 1359–1361.
- Pauly, D, V. Christensen, J. Dalsgaard, R. Froese, and F. Torres, 1998: Fishing down marine food webs. Science, 279, 860–863.
- Pimbert, M., 1999: Agricultural Biodiversity. In Cultivating Our Futures. FAO, Rome.
- Popkin, B., 2000: Urbanization and the Nutrition Transition. Policy Brief 7 of 10. Focus 3. In: Achieving Urban Food and Nutrition Security in the Developing World. J. Garret and M. Ruel (eds.), International Food Policy Research Institute, Washington, DC, 20 pp.
- Popkin, B., 1998: The nutrition transition and its health implications in lower income countries. Public Health Nutrition, 1, 5–21.
- Popkin, B.M., 1993: Nutritional patterns and transitions. Population and Development Review 19(1), 138–157.
- Popkin B.M., S. Horton, and S. Kim, 2001: The nutrition transition and prevention of diet-related diseases in Asia and the Pacific. Food Nutrition Bulletin, 22, 51–58.
- Pritchett, L. and L.H. Summers, 1993: Wealthier is healthier. Journal of Human Resources, 31(4), 842–868.
- Rahmathullah, L., J.M. Tielsch, R.D. Thulasiraj, J. Katz, C. Coles, et al., 2003: Impact of supplementing newborn infants with vitamin A on early infant mortality: community based randomized trial in Southern India. British Medical Journal, 327(7409), 254.
- Ramankutty, N. and J. A. Foley, 1998: Characterizing patterns of global land use: an analysis of global croplands data. Global Biogeochemical Cycles, 12(4), 667–685.
- Receveur O., M. Boulay, and H.V. Kuhnlein, 1997: Decreasing traditional food use affects diet quality for adult Dene/Metis in 16 communities of the Canadian Northwest Territories. Journal of Nutrition 12(11), 2179–2186._
- Regmi, A. and J. Dyck, 2001: Effects of urbanization on global food demand. In: Changing Structure of Global Food Production and Trade, A. Regmi (ed.), Economic Research Service, U.S. Department of Agriculture, Washington, DC, pp. 23–30.
- Reutlinger, S. and J. van Holst Pellekan, 1986: Poverty and Hunger: Issues and Options for Food Security in Developing Countries. World Bank, Washington, DC, 82 pp.
- Rguibi M. and R. Belahsen, 2004: Metabolic syndrome among Moroccan Sahraoui adult women. American Journal of Human Biology, 16, 598–601.
- Rice, A.L., K.P.West, and R.E. Black, 2003: Vitamin A deficiency. In: Comparative Quantification of Health Risks: Global and Regional Burden of Disease Attributable to Selected Major Risk Factors. M. Ezzati et al. (eds.), WHO, Geneva, 2248 pp.
- Roe, T. and M. Gopinath, 1998: The ‘‘miracle’’ of U.S. agriculture. Minnesota Agricultural Economist, 69, 1–4.
- Rosenzweig, C. and M. Parry. 1996. Potential impact of climate change on world food supply. Nature, 367, 133–138.
- Runge, C.F., B. Senaur, P. Pardey, and M. W. Rosegrant, 2003: Ending Hunger in Our Lifetime: Food Security and Globalization. Johns Hopkins University Press, Baltimore, MD, 204 pp.
- Ruttan, V., 2002: Technology, Growth and Development: An Induced Innovation Perspective. New York, Oxford University Press, 672 pp.
- Satheesh, S.V., 2000: Uncultivated Food and the Poor. Proceedings of South Asian Workshop on Uncultivated Food and Plants. Policy Research for Development Alternative, Shaymoli, Dhaka, Bangladesh, pp.78–92.
- Schelp, F.P., 1998: Nutrition and infection in tropical countries—implications for public health intervention: a personal perspective. Nutrition, 14(2), 217– 222.
- Science Daily, 2003: Climate change in the vineyards: a taste of global warming [online]. Cited April 21, 2005. Available from Science Daily at http:// www.sciencedaily.com/releases/2003/11/031104064327.htm.
- Scoones, I., M. Melnyck, and J. Pretty (eds.), 1992: The Hidden Harvest—A Literature Review and Annotated Bibliography. International Institute for Environment and Development, London, 260 pp.
- Shand, H., 1997: Human Nature: Agricultural Biodiversity and Farm-based Food Security. Rural Advancement Foundation International, Ottawa, 110 pp.
- Simmonds, N.W., 1993: Introgression and incorporation. strategies for the use of crop genetic resources. Biological Reviews, 68, 539–562.
- Sinclair, T.R., L.C. Purcell, and C.H. Sneller, 2004: Crop transformation and the challenge to increase yield potential. Trends in Plant Science, 9, 70–75.
- Smil, V., 2000: Feeding the World – A Challenge for the 21st Century. The MIT Press, Cambridge, MA, 360 pp.
- Smith, B.D., 1995 The Emergence of Agriculture. Scientific American Library, New York, 231 pp.
- Smith, L. and L. Haddad, 2000: Overcoming Child Malnutrition in Developing Countries: Past Achievements and Future Choices. Food Agriculture and the Environment Discussion Paper 30. International Food Policy Research Institute, Washington, DC, 66 pp.
- Sombroek, W.G. and R. Gommes, 1996: The climate change-agriculture conundrum. In Global Climate Change and Agricultural Production. F. Bazzaz and W. Sombroek, eds. West Sussex, Wiley, 345 pp.
- Strauss, J., 1986: Does better nutrition raise farm productivity? Journal of Political Economy, 94(2), 297–320.
- Thompson, L.M., 1998: Effects of changes in climate and weather variability on the yield of corn and soybean. Agronomy Journal/Production Agriculture, 1, pp. 20–27.
- Tomek, W.G. and K.L. Robinson, 1981: Agricultural Product Prices. Cornell University Press, Ithaca, NY, 367 pp.
- Trichopoulou, A. and E. Vaasilopoulou, 2000: Mediterranean diet and longevity. British Journal of Nutrition, 84, S209.
- UN (United Nations), 2004: World Urbanization Prospects: The 2003 Revision. New York, 335 pp.
- UN, 2001: World Urbanization Prospects: The 2001 Revision. New York, 190 pp.
- UN, 1998: World Urbanization Prospects: The 1998 Revision. New York.
- UNDP (United Nations Development Programme), 2003: Human Development Report 2003. Oxford University Press, New York, 384 pp.
- UNICEF (United Nations Children’s Fund), 1998: State of the World’s Children. Oxford University Press, New York, 131 pp.
- Unnevehr, L.J. (ed.), 2003: Food Safety in Food Security and Food Trade. 2020 Focus No. 10. International Food Policy Research Institute, Washington, DC, 38 pp.
- UN/SCN (United Nations Standing Committee on Nutrition), 2004: Nutrition for Improved Development Outcomes. 5th Report on The World Nutrition Situation. WHO, Geneva, 143 pp.
- Uusitalo, U., P. Pietinen, and P. Puska, 2002: Dietary transition in developing countries: challenges for chronic disease prevention. In: Globalization, Diets and Non-communicable Diseases. WHO, Geneva, pp.1–25.
- Verner, D., 2004: Education and Its Poverty-reducing Effects: The Case of Paraíba, Brazil, Policy Research Working Paper 3321. World Bank, Washington DC.
- Vosti, S., J. Witcover, and C. L. Carpentier, 2002: Agricultural Intensification by Smallholders in the Western Brazilian Amazon. International Food Policy Research Institute, Research Report 130, Washington, DC, 147 pp.
- Wang, G. and L. You, 2004: Delayed impact of the North Atlantic Oscillation on biosphere productivity in Asia. Geophysical Research Letters, 31 (12), L12210, doi:10.1029/2004GL019766.
- Wang, X. and K. Taniguchi, 2003: Does better nutrition enhance economic growth? the economic cost of hunger. In: Nutrition Intake and Economic Growth. Studies on the Cost of Hunger. K. Taniguchi and X. Wang (eds.), FAO, Rome, 126 pp.
- Watkins, K. and J. von Braun, 2003: Time to Stop Dumping On The World’s Poor. 2002–2003 International Food Policy Research Institute, Annual Report Essay. Washington, DC, 18 pp.
- WHO (World Health Organization), 2005: Modern Food Biotechnology, Human Health and Development: An Evidence-based Study. Geneva. 84 pp.
- WHO, 2004a: 20 questions on genetically modified foods [online]. WHO Geneva, cited February 28, 2005. Available at http://www.who.int/foodsafety/ publications/biotech/20questions/en/.
- WHO, 2004b: Micronutrient deficiencies [online]. WHO, Geneva, cited February 28, 2005. Available at http://www.who.int/nut/mic.
- WHO, 2004c: Chronic disease information sheets. Global strategy diet and physical activity [online]. WHO, Geneva, cited February 28, 2005. Available at http://www.who.int/dietphysicalactivity/publications/facts/en/.
- WHO, 2004d: Global database on bodymass index [online]. WHO, Geneva, cited February 28, 2005. Available at http://www.who.int/nut/db_bmi.htm.
- WHO, 2003a: Obesity and overweight. Global strategy on diet, physical activity and health [online] WHO, Geneva, cited February 28, 2005. Available at http://www.who.int/dietphysicalactivity/publications/facts/obesity/en/.
- WHO, 2003b: Diet, Nutrition and the Prevention of Chronic Diseases. WHO Technical Report Series 916. Geneva, 160 pp.
- WHO, 2002a: Globalization, Diets and Non-communicable Diseases. WHO, Geneva, 185 pp.
- WHO, 2002b: Food safety and food borne illness [online] WHO, Geneva, cited February 28, 2005. Available at http://www.who.int/mediacentre/fact sheets/fs237/en/.
- WHO, 2000: Collaborative study team on the role of breastfeeding on the prevention of infant mortality. Effect of breastfeeding on infant and child mortality due to infectious diseases in less developed countries: a pooled analysis. The Lancet, 355, 451–455.
- Wood, S., K. Sebastian and S.J. Scherr, 2000: Pilot Analysis of Global Ecosystems: Agroecosystems. A joint study by International Food Policy Research Institute and World Resources Institute. Washington, DC, 110 pp.
- World Bank, 2004: World Development Indicators [CD-ROM] World Bank, Washington, DC.
- World Bank, 2003: World Development Indicators [CD-ROM].World Bank, Washington, DC.
- Yusuf H.K., S. Quazi, M.N. Islam, T. Hoque, K.M. Rahman, et al., 1994: Current status of iodine-deficiency disorders in Bangladesh. The Lancet, 343(8909), 1367–1368.
|
|