Ecosystems and Human Well-Being: Volume 1: Current State and Trends: Freshwater Ecosystem Services

This is Chapter 7 of the Millenium Ecosystem Assessment report Ecosystems and Human Well-Being: Volume 1: Current State and Trends
Coordinating Lead Authors: Charles J. Vörösmarty, Christian Lévêque, Carmen Revenga
Lead Authors: Robert Bos, Chris Caudill, John Chilton, Ellen M. Douglas, Michel Meybeck, Daniel Prager
Contributing Authors: Patricia Balvanera, Sabrina Barker, Manuel Maas, Christer Nilsson, Taikan Oki, Cathy A. Reidy
Review Editors: Frank Rijsberman, Robert Costanza, Pedro Jacobi
Main Messages
Global freshwater use is estimated to expand 10% from 2000 to 2010, down from a per decade rate of about 20% between 1960 and 2000. These rates reflect population (Population growth rate) growth, economic development, and changes in water use efficiency. Projections that this trend will continue have a high degree of certainty. Contemporary water withdrawal is approximately 3,600 cubic kilometers per year globally or 25% of the continental runoff to which the majority of the population has access during the year. If dedicated instream uses for navigation, waste processing, and habitat management are considered, humans then use and regulate over 40% of renewable accessible supplies. Regional variations from differential development pressures and efficiency changes during 1960–2000 produced increases in water use of 15– 32% per decade.
Four out of every five people live downstream of, and are served by, renewable freshwater services, representing 75% of the total supply. Because the distribution of fresh water is uneven in space and time, more than 1 billion people live under hydrologic conditions that generate no appreciable supply of renewable fresh water. An additional 4 billion (65% of world population) is served by only 50% of total annual renewable runoff that is positioned in dry to only moderately wet conditions, with concomitant pressure on that resource base. Only about 15% live with relative water abundance.
Forest and mountain ecosystems serve as source areas for the largest amounts of renewable freshwater supply—57% and 28% of total runoff, respectively. These ecosystems each provide renewable water supplies to at least 4 billion people, or two thirds of the global population. Cultivated and urban ecosystems generate only 16% and 0.2%, respectively, of global runoff, but because of their close proximity to human settlements, they serve 4–5 billion people. Such proximity is also associated with nutrient and industrial water pollution.
From 5% to possibly 25% of global freshwater use exceeds long-term accessible supply. Overuse implies delivery of freshwater services through engineered water transfers or nonrenewable groundwater supplies that are currently being depleted. Much of this water is used for irrigation with irretrievable losses in water-scarce regions. All continents record overuse. In the relatively dry Middle East and North Africa, non-sustainable use is exacerbated, with current rates of freshwater use equivalent to 115% of total renewable runoff. In addition, possibly one third of all withdrawals come from nonrenewable sources, a condition driven mainly by irrigation demand. Crop production requires enormous quantities of fresh water; consequently, many countries that aim at self-sufficiency in food production have entrenched patterns of water scarcity. Alternatively, crops can be traded on global food markets, with some countries accruing substantial benefits from importing ‘‘virtual water’’ that would otherwise be required domestically to irrigate crops.
The water requirements of aquatic ecosystems in the context of expanding human freshwater use results in competition for the same resources. Changes in flow regime, transport of sediments and chemical pollutants, modification of habitat, and disruption of migration routes of aquatic biota are some of the key consequences of this competition. In many parts of the world, competition for fresh water has produced impacts that fully extend to the coastal zone, with effects including oxygen depletion, coastal erosion, and harmful algal blooms. Through consumptive use and interbasin transfers, several of the world’s largest rivers (the Nile, the Yellow, and the Colorado in the United States) have been transformed into highly stabilized and in some cases seasonally nondischarging river channels.
The supply of fresh water continues to be reduced by severe pollution (Water pollution) from anthropogenic sources in many parts of the world. Over the past half-century, there has been an accelerated release of artificial chemicals into the environment. Inorganic nitrogen pollution of inland waterways, for example, has increased substantially, with nitrogen loads transported by the global system of rivers rising more than twofold over the preindustrial state. Increases of more than tenfold are recorded across many industrialized regions of the world. Many anthropogenic chemicals are long-lived and transformed into by-products whose behaviors, synergies, and impacts are for the most part unknown as yet. As a consequence of pollution, the ability of ecosystems to provide clean and reliable sources of fresh water is impaired. Severe deterioration in the quality of fresh water is magnified in cultivated and urban systems (high use, high pollution sources) and dryland systems (high demand for flow regulation, absence of dilution potential).
The demand for reliable sources of fresh water and flood control has encouraged engineering practices that have compromised the sustainability of inland water systems and their provision of freshwater services. Prolific dam-building (45,000 large dams and possibly 800,000 smaller ones) has generated both positive and negative effects. Positive effects on human well-being have included flow stabilization for irrigation, flood control, drinking water, and hydroelectricity. Negative effects have included fragmentation and destruction of habitat, loss of species, health issues associated with stagnant water, and loss of sediments and nutrients destined to support coastal ecosystems and fisheries (Fisheries and aquaculture).
Water scarcity is a globally significant and accelerating condition for 1–2 billion people worldwide, leading to problems with food production, human health, and economic development. A high degree of uncertainty surrounds these estimates, and defining water scarcity merits substantial further analysis in order to support sound water policy formulation and management. Rates of increase in a key water scarcity measure—water use relative to accessible supply—from 1960 to present averaged nearly 20% per decade globally, with values of 15% to more than 30% per decade for individual continents. Inequalities in level of economic development, education, and governance result in differences in coping capacity for water scarcity.
The annual burden of disease from inadequate water, sanitation, and hygiene totals 1.7 million deaths and the loss of at least 50 million healthy life years. Some 1.1 billion people lack access to safe drinking water and 2.6 billion lack access to basic sanitation. Investments in drinking water supply and sanitation show a close correspondence with improvement in human health and economic productivity. Each person needs only 20 to 50 liters of water free of harmful contaminants each day for drinking and personal hygiene to survive, yet there remain substantial challenges to providing this basic service to large segments of the human population. Half of the urban population in Africa, Asia, and Latin America and the Caribbean suffers from one or more diseases associated with inadequate water and sanitation.
The state of freshwater resources is inadequately monitor (Environmental monitoring and assessment)ed, hindering the development of indicators needed by decision-makers to assess progress toward national and international development commitments. Substantial deterioration of hydrographic networks is occurring throughout the world, increasing the difficulty of making an accurate assessment of global freshwater resources. The same is true for groundwater monitoring, standard water quality monitoring, and freshwater biological indicators. New techniques make it possible to identify literally thousands of chemicals, including long-lived synthetic pharmaceuticals, in freshwater resources. But universal application of these techniques is lacking, and there are no systematic epidemiological studies to understand their impact on long-term human well-being.
Trade-offs in meeting the Millennium Development Goals and other international commitments are inevitable. It is very certain that the condition of inland waters and coastal ecosystems has been compromised by the conventional sectoral approach to water management, which, if continued, will jeopardize human well-being. In contrast, the implementation of the established ecosystem-based approaches adopted by the Convention on Biological Diversity, the Convention on Wetlands, the Food and Agriculture Organization, and others could substantially improve the future condition of water-provisioning services by balancing economic development, ecosystem conservation, and human well-being objectives.
7.1 Introduction to Fresh Water as a Provisioning Service
This chapter provides a picture of the recent history and contemporary state of global freshwater provisioning services. It documents a growing dependence of human populations on these services, which has resulted in a variety of activities aimed at stabilizing and delivering water supplies. So effective has been the ability of water management to influence the state of this resource, in terms of both its physical availability and chemical character, that anthropogenic signatures are now evident across the global water cycle. Much of this influence is negative due to overuse and poor management. The capacity of ecosystems to sustain freshwater provisioning services is thus strongly compromised throughout much of the world and may continue to remain so if historic patterns of managed use persist.
7.1.1 Fresh Water in the Millennium Ecosystem Assessment (MA) Context
Within the MA conceptual framework (see Chapter 1 (Ecosystems and Human Well-Being: Volume 1: Current State and Trends: Freshwater Ecosystem Services)), water is treated as a service provided by ecosystems as well as a system (inland waters). Because the water cycle plays so many roles in the climate, chemistry, and biology of Earth, it is difficult to define it as a distinctly supporting, regulating, or provisioning service. Precipitation falling as rain or snow is the ultimate source of water supporting ecosystems. Ecosystems, in turn, control the character of renewable freshwater resources for human well-being by regulating how precipitation is partitioned into evaporative, recharge, and runoff processes. Together with energy and nutrients, water is arguably the centerpiece for the delivery of ecosystem services to humankind (Falkenmark and Folke 2003).
While recognizing the role of water in supporting and regulating services, the placement of this chapter among other provisioning services is done from a practical point of view, in part because water resources are the most tangible and well-documented aspect of this broader spectrum of freshwater services. This chapter assesses the condition and recent trends in global freshwater resources, examining the amount and condition of renewable and nonrenewable surface and groundwater supplies, changes in these supplies over time and into the near future, and the impacts on human well-being of changes in the service. Chapter 20 examines the role of inland water ecosystems that provide a multitude of services, including water, fish, habitat, cultural and aesthetic values, and flood prevention. Because fresh water is so essential to life on Earth, its assessment overlaps with services and ecosystem chapters across the MA.
Throughout this chapter reference is made to summary statistics on the fresh water associated with specific ecosystems. While ecosystems are strongly dependent on the water cycle for their very existence, at the same time these systems represent domains over which precipitation is processed and transferred back to the atmosphere as ‘‘green water’’ (through evapotranspiration drawn from soils and plant canopies in natural ecosystems and rain-fed agriculture). The remainder runs off as ‘‘blue water’’ which constitutes the renewable water supply that can pass to downstream users—both aquatic ecosystems and humans such as farmers who irrigate. These water flows can be tabulated across ecosystems to identify areas that are critical to human well-being as well as those that require particular attention in designing strategies for environmental protection. Box 7.1 defines key terms used in this analysis.
|
|
|
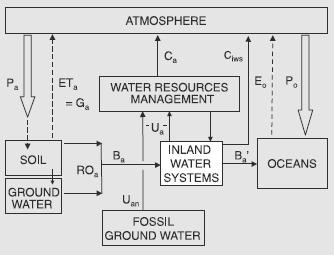
The global water cycle involves major transports that link Earth’s atmosphere, land mass, and oceans, though the emphasis in this chapter is on the continental hydrologic cycle. The Figure here outlines the major fluxes of fresh water, which help to define the renewable supplies on which humans and ecosystems depend. The water cycle can be divided into a portion that is accessible to humans and that which is not. The portion of the global water cycle that is accessible to humans is shown in the diagram. The following nomenclature is used throughout this chapter. Total Precipitation (Pt). This term is equivalent to the total sustainable water supply falling as rain and snow over the terrestrial portion of Earth. Pt represents the ultimate source of fresh water for recharge into soils, evaporation, and transpiration by plants in natural and cropped ecosystems, recharge into [[groundwater]s], and, eventually, runoff and discharge through river corridors. For the purposes of this study, Pt represents climatic means, unless otherwise noted. Pt can be divided into precipitation that is accessible (Pa) or inaccessible (Pi) to humans on the land mass. Ocean precipitation is denoted as Po. Total Blue Water Flow (Bt). This term represents the global renewable water supply computed as surface (Surface runoff) and sub-surface runoff. ‘‘Total’’ here refers to ‘‘blue water’’ that is both accessible and inaccessible to humans. It is a subcomponent of Pt, representing the net fresh water remaining after accounting for evapotranspiration (ET) losses to the atmosphere from the soils and vegetation (Land-cover) of natural ecosystems and rain-fed agriculture, known as ‘‘green water’’ (Gt). Blue water represents the sustainable supply of fresh water that emanates from ecosystems and is then transferred through rivers, lakes, and other inland aquatic systems. These downstream ecosystems evaporate and consume water (Ciws) and reduce blue water flows. In basins occupied by humans, accessible blue water (Ba) is further reduced (Ba’) through consumptive losses (Ca) from water resource management, such as irrigation. Water Use (Ua). This represents water withdrawn or used by humans. Ua is derived from either accessible blue water flows (Ba) or nonrenewable sources, predominantly fossil groundwater mining, which constitutes a non-sustainable water use. Use is divided into domestic (Da), industrial (Ia), and agricultural (Aa) applications, a part of which can be returned to inland water systems, though sometimes degraded in its quality in such return flows. Water Consumption (Ca). The portion of water that is lost as net evapotranspiration after being withdrawn from an accessible supply source (Ua). Such losses are associated predominantly with irrigation, and emerge from both renewable and nonrenewable freshwater supplies. Ca is also referred to as irretrievable losses. While humans ‘‘consume’’ water directly for drinking, this is not termed water consumption but simply a component of domestic water use tabulated under Ua. Non-sustainable Water Use (Uan). This is computed by comparing total water demand or withdrawals for human use (Ua) to the available renewable water supply (Ba). Where Ua exceeds Ba at the point of extraction, non-sustainable use is tabulated. For most parts of the planet, this will refer to the ‘‘mining’’ of groundwaters, especially in arid and semiarid areas, where recharge rates to the underground aquifer are limited. Uan can also embody the interbasin transport of fresh water from water rich to water poor areas. Environmental Flows. These are the water requirements needed to sustain freshwater (Freshwater biomes) ecosystems. Water Abundance and Scarcity. The conjunction of renewable freshwater supply, withdrawals, consumptive losses, and level of development can be used to define quantitative measures of water abundance or scar city. The number of people supported on a unit of renewable freshwater flows (the ‘‘water crowding’’ index) will define thresholds of chronic water scarcity, as will use-to-supply ratios (Ua /Bt or Ua / Ba). |
7.1.2 Setting the Stage
Prior to the twentieth century, global demand for fresh water was small compared with natural flows in the hydrologic cycle. With population (Population growth rate) growth, industrialization, and the expansion of irrigated agriculture, however, demand for all water-related goods and services has increased dramatically, putting the ecosystems that sustain this service, as well as the humans who depend on it, at risk. While demand increases, supplies of clean water are diminishing due to mounting pollution of inland waterways and [[aquifer]s]. Increasing water use and depletion of fossil groundwater adds to the problem. These trends are leading to an escalating competition over water in both rural and urban areas. Particularly important will be the challenge of simultaneously meeting the food demands of a growing human population and expectations for an improved standard of living that require clean water to support domestic and industrial uses.
Meeting even the most basic of needs for safe drinking water and sanitation continues to be an international development priority. Some 1.1 billion people lack access to clean water supplies and more than 2.6 billion lack access to basic sanitation (WHO/ UNICEF 2004). Reducing these numbers is a key development priority. By adopting the initial targets of the Millennium Development Goals, governments around the world have made a commitment to reduce by half the proportion of people lacking access to clean water supply and basic sanitation between 1990 and 2015.
The ministerial declaration from the 2nd World Water Forum in The Hague in 2000 captured the essence of the goals and challenges faced (see Box 7.2), including articulation of the importance of ecosystems in sustaining freshwater services. Water continues to rise in importance in major policy circles, with 2003 declared the International Year of Fresh Water, release of the first World Water Development Report (UN/WWAP 2003) by a collaboration of 24 U.N. agencies through the World Water Assessment Programme, and proclamation by the UN General Assembly of the International Decade of Action ‘‘Water for Life’’ in 2005–15.
|
|
|
The ongoing series of World Water Forums (Marrakech 1997, Hague 2000, Kyoto 2003, Mexico 2006), organized by the World Water Council and its partners, brings together a broad array of thousands of stakeholders to discuss strategies for sustainable development with respect to water. While there have been three such gatherings to date, outputs from the affiliated Ministerial Conference of the 2nd Forum are most relevant to the MA. This Ministerial Declaration captures the interconnections among ecosystem integrity, human actions affecting water supply, and human well-being. It is precisely these interactions that define the contemporary conditions and trends and that are suggestive of responses that foster water stewardship, sustainable water use, and progress toward development. These fundamental goals highlight the need for well-functioning ecosystems. They also reflect strongly the Millennium Development Goals:
|
Societies have benefited enormously through their use of fresh water. However, due to the central role of water in the Earth system, the effects of modern water use often reverberate throughout the water cycle. Key examples of human-induced changes include alteration of the natural flow regimes in rivers and waterways, fragmentation and loss of aquatic habitat, species extinction, water pollution, depletion of groundwater aquifers, and ‘‘dead zones’’ (aquatic systems deprived of oxygen) found in many inland and coastal waters. Thus, trade-offs have been made—both explicitly and inadvertently—between human and natural system requirements for freshwater services.
The challenge for the twenty-first century will be to manage fresh water to balance the needs of both people and ecosystems, so that ecosystems can continue to provide other services essential for human well-being. Human impacts on the capacity of ecosystems to continue delivering freshwater services are assessed in Chapter 20. Some options on balancing human and ecosystem water requirements are discussed in Chapter 7 of the MA Policy Responses volume.
Before describing the details of this chapter’s assessment, a word is in order on the quality of information on which it is based. Monitoring (Environmental monitoring and assessment) the continental water cycle in a timely manner at the global scale using traditional discharge gauging stations— the mainstay of water resource assessment—continues to challenge the water sciences (IAHS 2001; NRC 1999; Kanciruk 1997). Data collection is now highly project-oriented, yielding often poorly integrated time series of short duration, restricted spatial coverage, and limited availability. In addition, there has been a legal assault on the open access to basic hydrometeorological data sets, aided in large measure by commercialization and fears surrounding piracy of intellectual property. Delays in data reduction and release (up to several years in some places) are also prevalent. Much information has yet to be digitized, and exists in difficult-to-use book and report formats.
Based on available global archives at the WMO Global Runoff Data Center, to which member states contribute voluntarily, there was arguably a better knowledge of the state of renewable surface water supplies in 1980 than today. Such statements apply to many parts of the world, including otherwise well monitored countries like the United States and Canada (IAHS 2001; Shiklomanov et al. 2002), though most marked declines are in the developing world. Our understanding of groundwater resources is even more limited, since well-log, groundwater discharge/ recharge, and aquifer property data for global applications are only beginning to be synthesized (Foster and Chilton 2003; UNESCOIHP 2004). Information on water use and operation of infrastructure has never been assembled for global analysis (IAHS 2001; Vörösmarty and Sahagian 2000).
While remote sensing and models of the water cycle can be used to fill some data gaps, these approaches themselves produce a range of outputs arising from differences in their input data streams and detailed calculation procedures (e.g., Fekete et al. 2004). Without a sustained international commitment to baseline monitoring, global water assessments will be difficult to make and fraught with uncertainty. Box 7.3 gives the range of current estimates used in global water resource models, an uncertainty that in part arises from these data problems.
|
BOX 7.3 Uncertainties in Estimates of Contemporary Freshwater Services, Use, and Scarcity |
|
All entries are ranges in the units indicated and represent near-contemporary conditions. 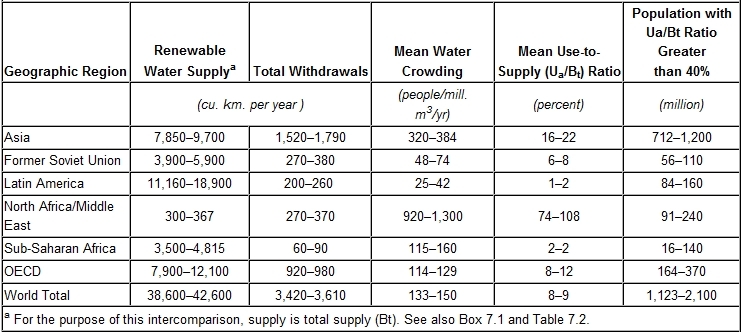 The ranges reported here are from three global-scale water resource models, two of which were used directly in the MA: University of New Hampshire (Vörösmarty et al. 1998a; Fekete et al. 2002; Federer et al. 2003) for the Condition and Trends Working Group assessment and Kassel University (Alcamo et al. 2003; Döll et al. 2003) used in the Scenarios Working Group. A third model from the University of Tokyo and Global Soil Wetness Project (Oki et al. 2001, 2003b; Dirmeyer et al. 2002) was also compared. The global-scale correspondence for total supply, withdrawals, water crowding, and demand-to-supply ratio is high, but masks continental-scale differences. Such disparities can be large, as for water supply in Latin America, where large remote tropical river systems have proved difficult to monitor (Environmental monitoring and assessment) systematically. Substantial differences at the continental scale are noted for population living under severe water scarcity (use-to-supply 40%). The order-of-magnitude range apparent for sub-Saharan Africa can be linked in part to the distribution of sharp climatic gradients that are difficult to analyze geographically. The result is also a function of the assumptions made regarding access to water. Because of such uncertainties, the current state-of-the-art in global models put 1–2 billion people at risk worldwide arising from high levels of water use. The MA models predict a much smaller range, from 2.0–2.1 billion. Large uncertainties surround current estimates of water consumption by the largest user of water, agriculture. Recent estimates vary from 900 (Postel 1998) up to 2000 cubic kilometers per year (Shiklomanov and Rodda 2003). A value of 1200 cubic kilometers per year is reported in this assessment (Table 7.4). |
7.2 Distribution, Magnitude, and Trends in the Provision of Fresh Water
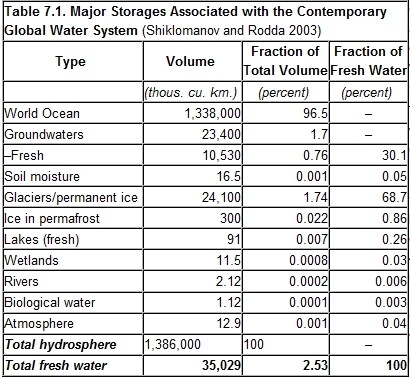
While it is true that there is an abundance of water across blue planet Earth, only a small portion of it exists as fresh water, and even a smaller fraction is accessible to humans. Nearly all water on Earth is contained in the oceans, leaving only 2.5% as fresh water. (See Table 7.1.) Of this small percentage, nearly three quarters is frozen, and most of the remainder is present as soil moisture or lies deep in the ground. The principal sources of fresh water that are available to society reside in lakes, rivers, wetlands, and shallow groundwater aquifers—all of which make up but a tiny fraction (tenths of 1%) of all water on Earth. This amount is regularly renewed by rainfall and snowfall and is therefore available on a sustainable basis.
Global averages fail to portray a complete picture of the world’s water resource base, however. The basic climatology of the planet dictates that fresh water will be distributed unevenly around the globe, with abundant supplies across zones like the wet tropics and absolute water scarcity across the desert belts and in the rain shadow of [[mountain]s]. For this assessment, both locally available runoff and water transported though river networks is considered (Vörösmarty et al. 2005). River corridor flows convey essential water resources to those living on the banks of large rivers, such as along the lower Nile. Figure 7.1 (in Appendix A) shows the broad range of sustainable water resources (blue water flows), which varies from essentially zero in many arid and semiarid regions to hundreds and thousands of cubic kilometers per year as major river corridor flow. Such regional differences in the quantity of available fresh water establish the diverse patterns of water supply across the globe.
The supply of fresh water is conditioned by several additional factors, which amplify the patterns of abundance and scarcity. These factors include the distribution of humans relative to the supply of water (that is, access to water), patterns of demand, presence of water engineering to stabilize flows, seasonal and interannual climate variations, and water quality. The following sections assess the state of global freshwater supplies, demands (withdrawals or use), and water quality. The time domain covered here is the last several decades and into the near future of 2010–15.
7.2.1 Available Water Supplies for Humans
Estimates of global water supply are imprecise and complicated by several factors, including differences in data and methodologies used, loss of hydrographic monitoring capacity, alternative time frames considered, and distortions from land cover, climate, and hydraulic engineering that are increasingly a part of the water cycle. The renewable resource base expressed as long-term mean runoff has been estimated to fall between 33,500 and 47,000 cubic kilometers per year (Korzoun et al. 1978; L’vovich and White 1990; Gleick 1993; Shiklomanov and Rodda 2003; Fekete et al. 2002; Nijssen et al. 2001; Döll et al. 2002). Within-year variations also define the basic nature of water supply. At the continental scale, maximum-to-minimum runoff ratios vary between 2:1 and 10:1 (Shiklomanov and Rodda 2003), with individual rivers experiencing ratios far higher, such as in snowmelt-dominated basins or episodically flooded arid and semiarid river systems. These variations necessitate flow stabilization through hydraulic engineering for either protection (for example, from floods) or seasonal supply augmentation (for example, for dry-season agriculture or hydroelectricity).
Water supply can also be assessed from the standpoint of societal access to renewable runoff and river flow, from which humans can secure provisioning services. By one estimate (Postel et al. 1996), one third of global renewable water supply is accessible to humans, when taking into account both its physical proximity to population and its variation over time, such as when flood waves pass uncaptured on their way to the ocean. Such accessibility is considered as part of this assessment later in this chapter.
Groundwater plays an important role in water supply. It has been estimated that between 1.5 billion (UNEP 1996) and 3 billion people (UN/WWAP 2003) depend on groundwater supplies for drinking. It also serves as the source water for 40% of self-supplied industrial uses and 20% of irrigation (UN/WWAP 2003). For certain countries this dependency is even greater; for example, Saudi Arabia meets nearly 100% of its irrigation requirements through groundwater (Foster et al. 2000). Two important classes of groundwater can be identified. The first is renewable groundwater resources, closely linked to the cycling of fresh water, through which the ground is periodically replenished when sufficient precipitation is available to recharge soils or when floodplains become inundated. The second, fossil groundwater, is typically locked in deep [[aquifer]s] that often have little if any longterm net recharge. Whenever this is extracted, it is functionally ‘‘mined,’’ a particularly acute problem in arid regions, where replenishment times can be on the order of thousands of years (Margat 1990a, 1990b).
Establishing the contribution of groundwater to the global supply of freshwater inserts a substantial element of uncertainty into the overall assessment. Problems of poor data harmonization, incomplete and fragmentary inventories, and methodological difficulties are well documented (Revenga et al. 2000; UN/WWAP 2003; Morris et al. 2003). As a result, there is large uncertainty in estimates of fresh groundwater resources, ranging from 7 million to 23 million cubic kilometers (UN/WWAP 2003; Morris et al. 2003). While abundant, their use can be severely restricted by pollution (Foster and Chilton 2003) or by the cost of extracting water from aquifers, which rises progressively in the face of extraction rates exceeding recharge (Dennehy et al. 2002).
Another important water supply is represented by the widespread construction of artificial impoundments that stabilize river flow. Today, approximately 45,000 large dams (>15 meters high or between 5 and 15 meters high and a reservoir volume of more than 3 million cubic meters) (WCD 2000) and possibly 800,000 smaller dams (McCully 1996; Hoeg 2000) have been built for municipal, industrial, hydropower, agricultural, and recreational water supply and for flood control. Recent estimates place the volume of water trapped behind documented dams at 6,000– 7,000 cubic kilometers (Shiklomanov and Rodda 2003; Avakyan and Iakovleva 1998; Vörösmarty et al. 2003). In drainage basins regulated by large reservoirs (>0.5 cubic kilometers) alone, one third of the mean annual flow of 20,000 cubic kilometers is stored (Vörösmarty et al. 2003). Assuming seasonal six-month low flows constitute roughly 40% of annual discharge (Shiklomanov and Rodda 2003), this impounded water represents a global potential to carry over an entire year’s minimum flows.
Desalinization constitutes a renewable water supply using distillation and membrane techniques to withdraw salt from otherwise unusable water. While the technology continues to improve, desalinization remains the most costly means of supplying fresh water and is highly energy-intensive (Gleick 2000). Costs range between $1 and $4 per cubic meter, placing it well above the most expensive traditional sources (Gleick 2000). Despite this, in 2002 there were over 10,000 desalinization plants in 120 countries supplying more than 5 cubic kilometers per year, with a global market of $35 billion per year (UN/WWAP 2003). Collectively, these plants provide for much less than 1% of global freshwater use.
More than 70% of global installed desalinization capacity is in the oil-rich states of the Middle East and North Africa (UN/ WWAP 2003). While its use may be difficult to justify for high-water-consumptive activities like irrigation, investments in desalinization technologies are likely to improve efficiency and bring down costs, creating a potentially important source at least for domestic drinking water (Gleick 2000), and the annual supply of desalinized water could double in 15 years (UN/WWAP 2003). The unresolved issue of adequately managing brine waste from the desalinization process to protect nearby coastal ecosystems requires special attention.
Finally, rainwater harvesting through traditional methods or modern technology is another way in which humans augment freshwater supply. Rainwater harvesting can directly increase the soil water content or be stored for later application as supplemental irrigation during dry periods. This is particularly important in places like India, which relies heavily on a short period of intense rainfall (WWC 2000). The groundwater authorities in India, for instance, have made it mandatory for multistoried buildings in New Delhi and several other states to have a rooftop rainwater harvesting system (Hindustan Times, Patna, September 2002). Rainwater harvesting can also be an appropriate technology for maintaining groundwater base flow and reducing flood peaks. (See MA Policy Responses, Chapter 7, for further discussion.)
7.2.1.1 Total Flows of Fresh Water
Ecosystems vary greatly in their exposure to precipitation and hence as source areas for renewable runoff that emerges as part of the hydrologic cycle. (See Table 7.2.) The proportional contribution of each ecosystem to global runoff is generally equivalent to the fraction of precipitation to which it is exposed. [[Forest]s] therefore are associated with slightly more than half of global precipitation and yield about half of global runoff, while [[mountain]s] represent one quarter of both global precipitation and runoff. Cultivated and island systems are the next most important source areas, each constituting about 15% of global runoff. All other systems contribute 10% or less. Paradoxically, dryland ecosystems, due to their large aerial extent, receive a nearly identical fraction of global precipitation as mountains do, yet because of substantial losses from the system due to evapotranspiration, they are a relatively minor contributor to global renewable water supply (<10%). Urban systems, because of their restricted extent (<<1% of land area), receive only 0.2% of global precipitation and provide the same very minor proportion of global runoff.
From a regional perspective, Latin America is most water-rich, with about one third of global runoff. Asia is next, with one quarter of global runoff, followed by OECD (20%), and sub-Saharan Africa and the former Soviet Union, each with 10%. The Middle East and North Africa is clearly driest and most water-limited, accounting for only 1% of global runoff.
7.2.1.2 Freshwater Flows Accessible to Humans
Ecosystems constitute the ultimate source areas for freshwater provisioning services. The accessibility of renewable water supply can be estimated through an index measuring the proportion of total annual renewable runoff generated locally that eventually flows through river corridors and encounters downstream human populations. The importance of upstream ecosystems as source areas for freshwater supply is demonstrated in Table 7.2. Cultivated, coastal, and urban systems, with sizable fractions of the global population, have from 90% to 100% of their renewable runoff accessible. Drylands also show high accessibility, likely reflecting the propensity of humans to settle near scarce freshwater resources. Mountains, forests, and inland waters each show 70– 80% of total runoff as accessible to downstream populations. The exception is polar systems, which yield less than 20% of total runoff as accessible, reflecting their remote and generally uninhabited environment.
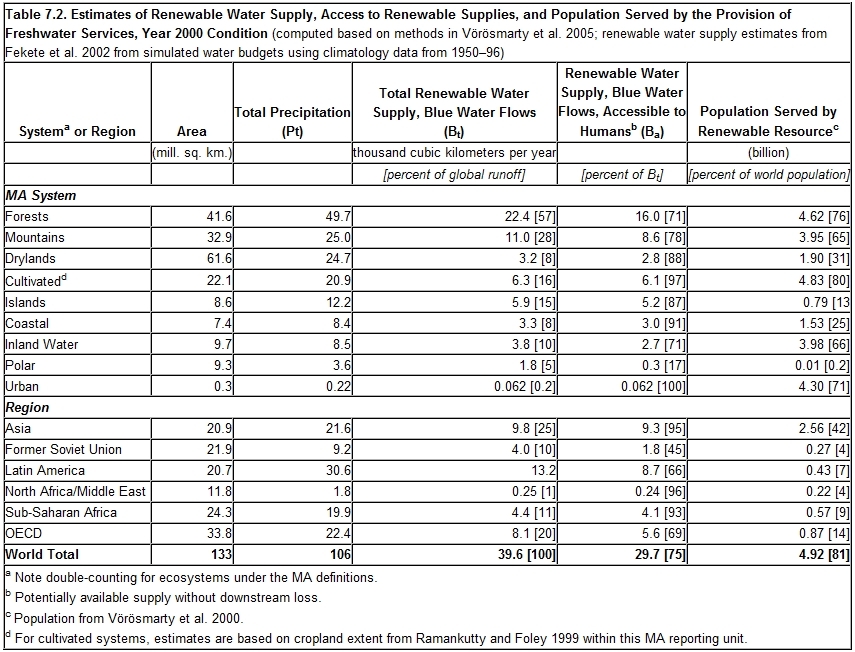
Populations served by accessible runoff emerging from individual ecosystems are typically in the billions. Cultivated systems, forests, inland waters, and mountains each serve at least 4 billion people. Four fifths of the world lives downstream of runoff from cultivated lands, followed by a nearly identical fraction downstream from forests. Inland waters and mountains provide water to two thirds of global population and drylands to one third. Remote islands and polar systems serve the fewest people. Runoff from urban systems, nearly all generated in close proximity to densely settled areas, serves nearly three quarters of the world’s population.
The large fractions of total runoff expressed as accessible runoff indicate that, by and large, human society has positioned itself into areas with identifiable local sustainable water supplies or river corridor flows. A geographic distribution of human settlement thus is linked to the availability of fresh water (see also Meybeck et al. 2001). The global geography of accessible runoff, expressed in units of dependent population per unit of delivered flow, was shown in Figure 7.1. Mountains serve 3 times, forests 4 times, and inland waters 12 times as many people downstream through river corridors as they do through locally derived runoff. Urban areas nearly double the total service when tabulating downstream populations. Remaining ecosystems show more-limited importance in transferring precipitation as accessible runoff to downstream populations. For drylands, this is due to a lack of substantial quantities of runoff, while for coastal or island systems it is a consequence of short flow pathways to the ocean. Each of these systems still supplies 15–30% of global population with renewable and accessible runoff.
From a regional perspective, Latin America and Asia constitute the largest proportion (together nearly 60%) of global accessible runoff. And while the OECD, sub-Saharan Africa, and the former Soviet Union generate a large portion of the global runoff, substantial quantities are remote and inaccessible particularly in the former Soviet states (see also Postel et al. 1996). The Middle East and North Africa generates less than 1% of renewable accessible runoff.
Overall, the global fraction of total annual runoff that is accessible to humans is 75%, with slightly more than 80% of world population (4.9 billion people) being served by these renewable and accessible water flows. However, while providing an estimate of long-term water supply, these figures overstate the effective availability of fresh water. Given that approximately 30% of annual runoff is uncaptured flood flow (Shiklomanov and Rodda 2003), the world’s population has its access reduced from 75% to 53% of total runoff.
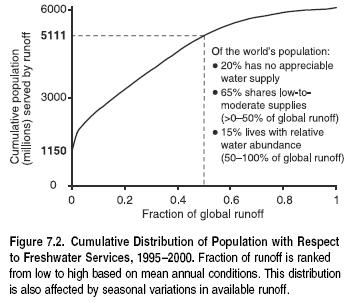
Globally, renewable freshwater services reflect the geographic distributions of both water supply and human populations. Four out of every five people live downstream of and are served by renewable freshwater services. (See Figure 7.2.) Thus, while the human population is generally well organized with respect to the availability of fresh water, 20% of humanity remains without any appreciable quantities of sustainable supply or must gain access to such resources through costly interbasin transfers from more water-rich areas. (See also Table 7.2.) These people are highly reliant on unsustainable water resources. For those with access to renewable supplies, a total of 65% of the world’s population is served by the 50% of total annual renewable runoff that is positioned in dry to moderately wet conditions, with concomitant pressure on that resource base. Only 15% live with relative water abundance—that is, in conjunction with the remaining 50% of total runoff (represented by the high runoff-producing regions shown in the upper part of the curve in Figure 7.2). If uncaptured flood flow is incorporated into these calculations, for the 80% of world population who reside in the lower half of the water availability spectrum in Figure 7.2 (65% plus 15% with no appreciable renewable freshwater flows), the effective supply is reduced from 50% to 35% of total runoff.
7.2.2 Water Use
Over the last few centuries, global water use has shown roughly an exponential growth and been linked closely to both population (Population growth rate) growth and economic development. There was a fifteenfold increase in global water withdrawals between 1800 and 1980 (L’vovich and White 1990), when population increased by a factor of four (Haub 1994). Since the 1900s, the overall increase has been sixfold (WMO 1997). Global consumptive water losses, primarily from evapotranspiration through irrigation, increased thirteenfold during this same period. A major, recent feature of human water use is the reduction in per capita use rates, dropping as of around 1980 from about 700 to 600 cubic meters per year, though the aggregate global withdrawal continues to increase (Gleick 1998; Shiklomanov and Rodda 2003).
While the general features of a historical rise in freshwater demands are clear, there are substantial uncertainties surrounding water use estimates, reflecting the current state of knowledge, assumptions (or lack thereof ) on potential efficiency changes and reuse potential, number of years projected into the future, and interactions with market forces (Gleick 2000; Shiklomanov and Rodda 2003). The summary statistics from three global tabulations provided earlier, in Box 7.3, demonstrate the current degree of uncertainty.
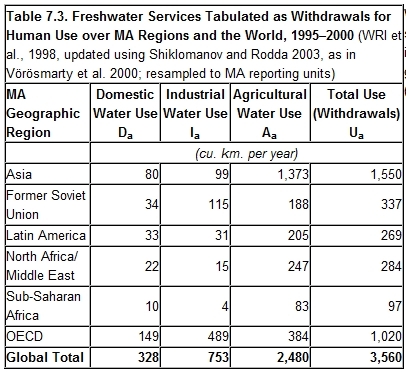
Global water withdrawals today total about 3,600 cubic kilometers per year, with a wide range of use over individual continents. (See Table 7.3.) The largest user is Asia, accounting for nearly half of the world total, with OECD next, using about one third. The remaining continents each represent less than 10% of global use. Water use today is dominated by agricultural withdrawals (70% of all use), followed by industrial and then domestic applications. Withdrawals in agriculture are fundamentally defined by irrigation. In Asia, the Middle East and North Africa, and sub-Saharan Africa, agriculture accounts for 85–90% of all withdrawals. Driven by irrigation demand, overall withdrawals across MENA constitute 120% of renewable accessible supplies, meaning that this region relies on nonrenewable supplies for food production. Agricultural water use in the former Soviet Union and the OECD is proportionally much lower, reflecting the water needs of other sectors in these industrial economies. In contrast, industrial water use is only 4% in sub-Saharan Africa, reflecting a low level of economic development.
Water lost from groundwater and surface water sources to the atmosphere through net evaporation (such as from irrigation, cooling towers, or reservoirs) is termed water consumption or irretrievable losses, which today represent a substantial fraction of water use. Contemporary irretrievable losses through irrigation, computed as the evapotranspiration component of agricultural withdrawals, are assessed here. (See Table 7.4.) Irretrievable losses from irrigation represent one third of all water use globally. The efficiency computed for irrigated agriculture (the ratio of water withdrawn to water consumed or lost through evapotranspiration on irrigated cropland) is on average 50% globally and varies from 25% (in Latin America) to 60% (in Asia). Additional losses from evaporation from reservoirs, irrigation ditches, and so on are difficult to estimate accurately but could total over 500 cubic kilometers per year (Postel 1998), thus indicating the conservative nature of the consumption estimates in Table 7.4. (See Box 7.3 earlier in this chapter for the range in current estimates of consumptive loss from irrigation.)
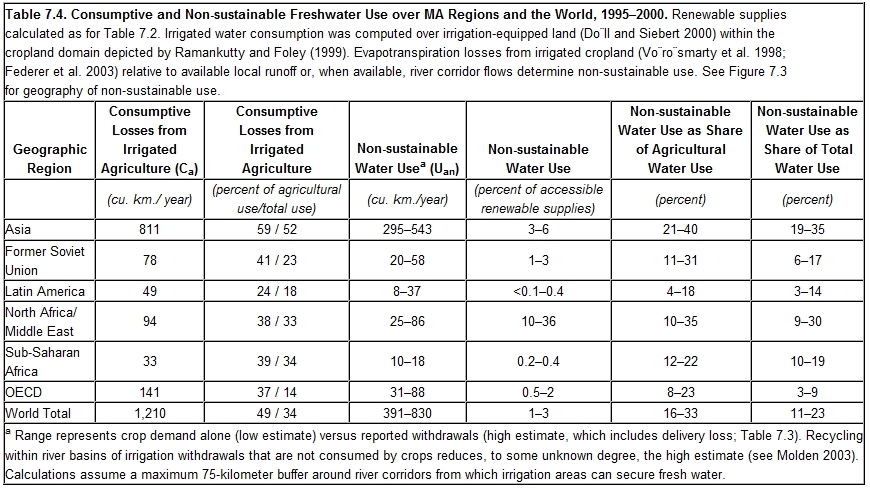
Non-sustainable water use could be a substantial component of total withdrawals. Earlier work based on documentary evidence showed approximately 200 cubic kilometers per year of global aquifer overdraft (Postel 1999; WWC 2000), though the estimate is regarded as highly uncertain (Foster 2000). This assessment of water supply and use (based on Vörösmarty et al. 2000, 2005; Fekete et al. 2002) using a geospatial framework (about 50- kilometer resolution) enables calculations to be made of the degree to which water withdrawal exceeds locally accessible supplies— in other words, non-sustainable water use (Uan).Worldwide, non-sustainable withdrawals can be computed using two endpoints: crop evaporative demands or water use statistics, which include both consumption and transport losses, some unknown fraction of which reenters the surface-groundwater system for potential reuse (Molden 2003). These endpoints give a calculated non-sustainable use of about 400–800 cubic kilometers per year. In terms of total freshwater withdrawals, 10–25% could represent nonrenewable use. When the earlier estimate of 200 cubic kilometers per year is also included, a large degree of uncertainty results, and from 5% to 25% of freshwater withdrawals could represent nonrenewable use.
Nevertheless, each of these estimates reflects a high dependence on existing water services, especially in areas where induced, chronic water stress necessitates costly water engineering remedies, groundwater depletion, or curtailment of water-using activities. Each continent shows a heavy reliance on such nonrenewable extraction, ranging up to one third of total use based on the high estimates. Asia and MENA show the greatest level of such dependence; OECD, the least. In MENA, 30% of all water use is from non-sustainable sources, and this use is equivalent to over one third of accessible renewable supplies.
Figure 7.3 (in Appendix A) shows the contemporary geography of such non-sustainable use and demonstrates the much larger impacts that arise at subcontinental scales. The summary in Table 7.4 may thus understate the true degree of this overconsumption locally. The spatial pattern of overuse is broadly consistent with previously reported regions of use exceeding supply, major water transfer schemes, or groundwater overdraft: Australia, western Asia, northern China, India, North Africa, Pakistan, Spain, Turkey, and the western United States (Muller 2000; Shah et al. 2000; Vörösmarty and Sahagian 2000; Dennehy et al.2002; EEA 2003; MDBC 2003; NLWRA 2004).
Non-sustainable use expressed as a proportion of irrigated agricultural withdrawals shows an even higher degree of dependency on nonrenewable supplies. Globally, about 15–35% of irrigation withdrawals are computed to be non-sustainable. Individual continental areas show percentages ranging from less than 10% to 40%, as in the case of Asia. Such high rates indicate an increasing degree of food insecurity. Given projections showing no major expansion in global cropland area (Bruinsma 2003), increasing pressure will be placed on irrigated cropland, which today provides nearly 40% of crop production (Shiklomanov and Rodda 2003; UN/WWAP 2003). By its very nature, this water use cannot persist indefinitely, and many regions of the world have well-documented cases of aquifer depletion and abandonment of irrigation, adding constraints to irrigated crop production arising from rising development costs, soil salinization, and competition for water required by sensitive ecosystems and commercial fisheries (Fisheries and aquaculture) (Postel and Carpenter 1997; Postel 1998; Foster and Chilton 2003).
7.2.3 The Notion of Water Scarcity
The assessment thus far has shown a growing dependence of human society on accessible freshwater resources. To assess the state of these provisioning services more comprehensively, the supply of renewable water must be placed into the context of interactions with people and their use of water. A set of relative measures can be used in this regard.
One measure of dependence on fresh water is the population served per million cubic meters per year of accessible runoff (renewable supply). This is known as the ‘‘water crowding’’ index, with levels on the order of 600–1,000 people per million cubic meters per year (that is, 1,000–1,700 cubic meters per year supply per person) showing water stress, and above 1,000 people (that is, less than 1000 cubic meters per year per person) indicating extreme water scarcity (Falkenmark 1997). Another measure is the relative water use or water stress index (WMO 1997; UN/ WWAP 2003), expressed as the ratio of water withdrawals to supply. More sophisticated indicators are available that incorporate social and economic dimensions of water use (Raskin 1997; Sullivan et al. 2003), and these will be described in the section on water and human well-being. A major water scarcity indicator effort is under way through the World Water Assessment Programme (UN/WWAP 2003).
Worldwide, a substantial quantity of renewable freshwater supply—nearly 30,000 cubic kilometers per year—is accessible to humans. Thus contemporary use represents slightly more than 10% of annual supply. However, there is a substantial range in the share of accessible runoff used by humans across different continents as well as a rapidly changing picture over the last few decades. Time series of use indicate increasing pressures on the freshwater resource base.
Between 1960 and 2000, world water use doubled from about 1,800 to 3,600 cubic kilometers per year, a rate of about 17% per decade, with a slower (10%) increase projected to 2010. (See Table 7.5.) Individual continents show increases over the 1960– 2000 timeframe from 15% up to 32% per decade. MENA has historically shown a great dependence on its freshwater supply, using well over half as early as 1960 and exceeding all renewable supplies shortly after 1980. Today its withdrawals represent 120% of accessible sustainable supply, and these are projected to rise to >130% by 2010. Asia, the former Soviet Union, and OECD countries show intermediate levels of use relative to supply over this period. In sub-Saharan Africa, substantial contributions of fresh water from river basins in the wet tropics coupled with rela- tively poor water delivery infrastructure and restricted development mean that only 2% of renewable supply is tapped. In water-rich Latin America, relative use rates also remain low, at less than 5%.
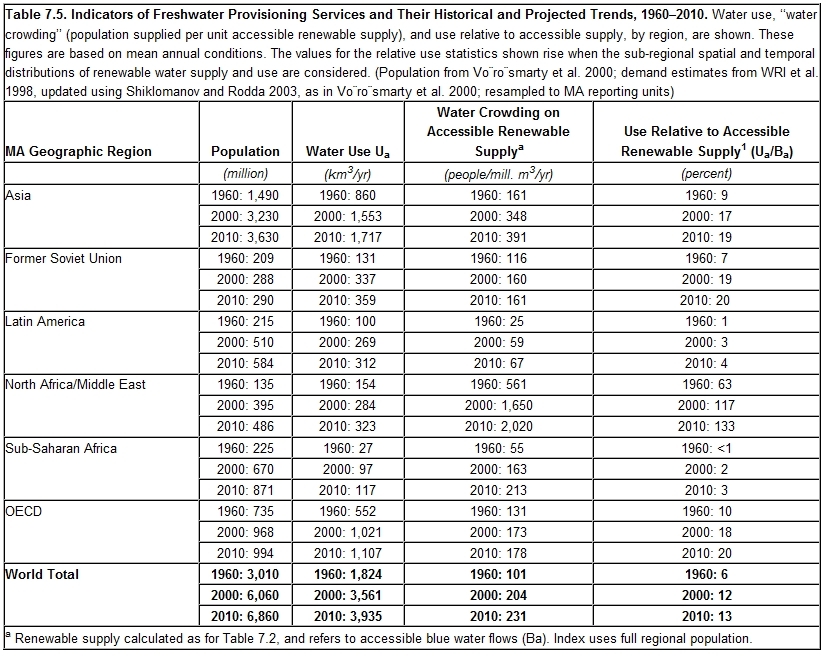
The contemporary water crowding index is modest in almost all regions. Only MENA shows a value reflective of its well-known position as a highly water-scarce region. Over the last four decades there has been a sustained and substantial increase in the water crowding index with respect to accessible runoff, reflecting directly the impact of population (Population growth rate) growth. Worldwide, the number of people served per unit of supply has doubled during this period, at an average rate of 20% per decade. Several regions show even greater rates of increase—a tripling for MENA and sub- Saharan Africa and a more than doubling for Asia and Latin America. Globally, an additional 13% crowding in renewable supply is predicted between 2000 and 2010, with greatest regional increases expected in sub-Saharan Africa (30%) and MENA (20%). A slight slowing in rate of increase is noted globally, with near stability in the index for OECD and the former Soviet states.
Several cautionary notes are needed in interpreting these trends. The statistics are based on mean annual flows and access computed for 100% of individual continental and global populations. In the context of the 50% of continental runoff generated in dry to moderately wet climate zones (19,800 cubic kilometers per year) that serves the majority of global population, contemporary use represents nearly 20% of the mean annual supply. When seasonal variations in runoff are considered (reducing supplies to 13,900 cubic kilometers per year), withdrawals exceed 25% of the renewable resource. In addition, if dedicated instream uses of about 2,000 cubic kilometers per year for navigation, waste processing, and habitat management are considered (based on Postel et al. 1996), humans then use and regulate 40% or more of renewable accessible supplies.
Further, the crowding index does not take into account different countries’ abilities to deal with water shortages. For example, high-income countries that are water-scarce may be able to cope to some degree with water shortages by investing in desalination or reclaimed wastewater. The study also discounts the use of fossil water sources because such use is unsustainable in the long term.
In addition, while the global numbers are well below the extreme scarcity threshold of 1,000 people per million cubic meters per year of renewable supply, they mask important local and regional differences and thus understate the true degree of stress (Vörösmarty et al. 2000, 2005). Prior assessments (Revenga et al. 2000) show that as of 1995 some 41% of the world’s population, or 2.3 billion people, were living in river basins under water stress, with some 1.7 billion of these people residing in river basins under conditions of extreme water scarcity. From a river basin perspective, the Volta, Nile, Tigris and Euphrates, Narmada, and Colorado in the United States will show ongoing pressure through 2025 (Revenga et al. 2000). Another 29 basins will descend further into scarcity by 2025, including the Jubba, Godavari, Indus, Tapti, Syr Darya, Orange, Limpopo, Yellow, Seine, Balsas, and Rio Grande. Indicators based on mean annual conditions also mask important supply limits imposed by seasonal and inter-annual variability. For example, in India most of the annual water supply is generated as a result of the monsoons, which in many cases means both flooding downstream as well as seasonal drought.
Another measure of adequacy of the freshwater supply is the mean use-to-supply ratio. A set of thresholds for water stress was given by the United Nations in a recent global analysis that used this ratio based on mean annual conditions (WMO 1997): low (<10%), moderate (10–20%), medium/high (20–40%), and high (>40%). Using this classification and a grid-based approach necessary to capture the high degree of spatial heterogeneity (see Vörösmarty et al. 2000), the contemporary global-scale ratio is from low-to-moderate, as seen in Table 7.5, although entire continents are under a moderate (Asia, former Soviet Union, and OECD) to high (MENA) state of scarcity. This is in stark contrast to the situation in 1960, when uniformly low levels of scarcity were noted (with the exception of MENA). Globally, it has been shown that 2.5 billion people suffer from at least moderate levels of chronic water stress (Vörösmarty et al. 2000) and from 1–2 billion people suffer high levels of scarcity even when tabulations are made conservatively on total renewable supplies. Calculating the population at risk through a ratio based on accessible supplies would increase the overall exposure to stress.
Water scarcity as a globally significant problem is a relatively recent phenomenon, evolving only over the last four decades. Rates of increase in the relative use ratio from 1960 to the present averaged about 20% per decade globally, with values from 15% to more than 30% for individual regions. A slowing in the rate of increase in use is projected between 2000 and 2010, to 10% per decade globally. With anticipated population (Population growth rate) growth, economic development, and urbanization, a further increase in the relative use ratio for some continents is likely to remain high (MENA at 14% per decade, Latin America at 16%, and sub-Saharan Africa at 20%).
7.2.4 Environmental Flows for Ecosystems
In light of the expanding use of fresh water by humans and several indicators of growing water stress, an important issue emerges with respect to the sustainability of water provisioning services— that is, being able to continue providing water for human use while also meeting the water requirements of aquatic ecosystems so as to maintain their capacity to provide other services. ‘‘Environmental flows’’ refers to the water considered sufficient for protecting the structure and function of an ecosystem and its dependent species. These flow requirements are defined by both the long-term availability of water and its variability and are established through environmental, social, and economic assessment (King et al. 2000; IUCN 2003).
Determining how much water can be allocated to human uses or distorted through flow stabilization (such as dam construction) without loss of ecosystem integrity is central to an understanding of how freshwater (Freshwater biomes) ecosystems support human well-being through the range of provisioning, supporting and regulating services. Assessment of water availability, water use, and water stress at the global scale has been the subject of on-going research. However, water requirements of aquatic ecosystems are only now being estimated globally and considered explicitly in these assessments (Smakhtin et al. 2003). Flow requirements can range globally from 20% up to 80% of mean annual flow, depending on the river type, its species composition, and the river health condition objectives sought (for instance, pristine, moderate modification from natural conditions, minimum flows), indicating the high degree of potential conflict with river regulation and human uses should the environment be preserved.
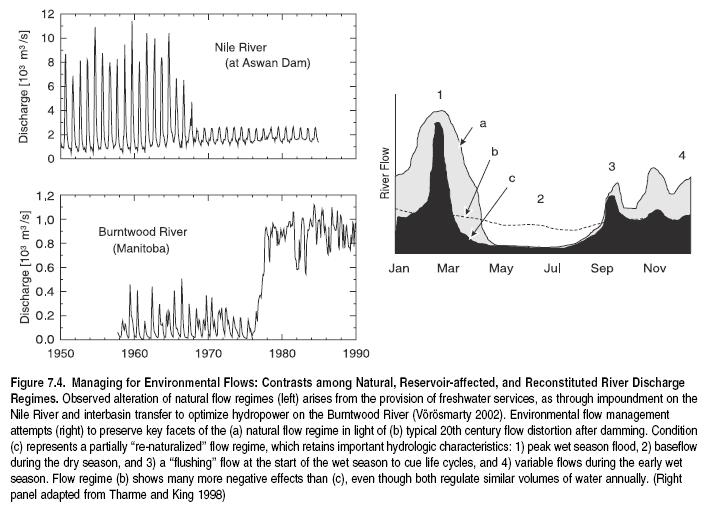
If human systems are viewed as being embedded within natural systems, human water use can expand to a ‘‘sustainability boundary’’ beyond which a substantial degradation of ecosystem services results (King et al. 2000; Postel and Richter 2003). Determining the location of the sustainability boundary is critical to successful management and rests on clearly defining what constitutes a degraded ecosystem. Environmental flows should consider both the quantity and timing of flow to maintain ‘‘naturally variable flow regimes’’ (Poff et al. 1997), whereby seasonal flow patterns are maintained with the aim of retaining the benefits provided by low and high flows. (See Figure 7.4.) Naturally low flows, for example, help exclude invasive species while high flows, especially floods, shape channels and allow the delivery of nutrients, sediments, seeds, and aquatic animals to seasonally inundated floodplains. High flows may also provide suitable migration and spawning cues for fish (Poff et al. 1997; Baron et al. 2002).
7.2.4.1 Global Trends in Water Diversion and Flow Distortion
While global trends in altered water regime are difficult to assemble with certainty due to incomplete information, they reflect an overall increase in regulation of the world’s inland river systems (Revenga et al. 2000; Vörösmarty and Sahagian 2000). Tables 7.4 and 7.5 provided an indication of the scope of such changes. Water withdrawals show a doubling between 1960 and 2000, by which time irretrievable losses from irrigation alone totaled 34% of all global use.
One third of all rivers for which contemporary and predisturbed discharges could be compared in a compendium (Meybeck and Ragu 1997) showed substantial declines in discharges to the ocean. Long-term trend analysis (more than 25 years) of 145 major world rivers indicated more than one fifth with declines in discharge (Walling and Fang 2003). From 1960 to 2000 there was a near quadrupling of reservoir storage capacity and more than a doubling of installed hydroelectric capacity (Revenga et al. 2000). Worldwide, large artificial impoundments (storing each 0.5 cubic kilometers or more) now hold two to three months of runoff, capable of significant hydrograph distortion, with several major basins showing storage potentials of greater than a year’s runoff (Vörösmarty et al. 2003). Much of this regulation occurred over the last 40 years.
Through consumptive use and interbasin transfers, several of the world’s largest rivers (Nile, Yellow, Colorado) have been transformed into highly stabilized and in some cases seasonally nondischarging river channels (Meybeck and Ragu 1997; Kowalewski et al. 2000). In the case of the Yellow River, improved water management since 2000 has helped to restore flows (MWR 2004).
7.2.4.2 Recent History of Governance and Management for Environmental Flows
Over the last decade, policy solutions to developing environmental flows have taken several forms, depending on social and historical context, degree of scientific knowledge, water infrastructure, and local ecosystem conditions. These approaches include managing the quantity and temporal pattern of water withdrawals or releases (Poff 2003; Postel and Richter 2003), developing water markets, and preemptively managing land use to protect watersheds.
Water allocation for environmental flows to sustain functioning freshwater (Freshwater biomes) ecosystems is practiced in parts of Australia, Europe, New Zealand, North America, and South Africa. However, there appears to be very little consideration of this matter anywhere in Asia, despite aggressive water extraction from many rivers during the dry season across the continent. But there is cause for cautious optimism. The calculation, adoption, and implementation of environmental flows are under consideration in other parts of the world. In addition, more than 2,000 river, lake, and floodplain restoration projects in at least 20 countries, particularly in Europe but also in Africa and Asia, are being carried out (DRRC 1998; UKRRC 2004; Richter et al. in prep.). Some key examples include the restoration of the Diawling delta in Mauritania (Hamerlynck and Duvail 2003), the Waza Logone floodplain in Cameroon (Loth 2004), the Danube and Rhine Rivers, and the South Florida Everglades—one of the largest ecosystem restoration projects ever attempted (Baron et al. 2002).
The shift toward management for natural flow regimes is also reflected by parallel shifts in public policy from laws favoring private interests and prior appropriations (as in much of the American West) to protecting water rights and environmental flows as part of the ‘‘public trust.’’ In 1998, South Africa passed landmark legislation to aid decision-making on all or part of any significant water resource (National Water Act 1998). One of the most progressive aspects of this act was establishment of a Reserve to support both essential human needs (water for drinking, food preparation, personal hygiene) and aquatic ecosystem integrity. Notably, this two-part Reserve—with human and environmental components—takes priority over other uses such as irrigation and industrial withdrawal. In Burkina Faso, a new water framework law (Loi d’Orientation sur L’eau), adopted in 2001, establishes the legal and institutional framework for promoting integrated basin management, equitable access, water for nature, and international cooperation. The legislation recognizes that ‘‘infrastructures which are built on a water course must maintain a minimal flow that guaranties aquatic life’’ (MEE 2001).
For many highly regulated river systems in North America (e.g., Colorado, Columbia, Missouri, Savannah), recent changes in dam operations and adaptive management plans are now fostering conditions that improve fish habitat, river-floodplain connectivity, and estuarine ecosystems, often at the cost of hydroelectric generation or navigability to barges (Postel and Richter 2003; Richter et al. in prep.). In addition, the decommissioning and removal of some dams has begun in the United States (Hart et al. 2002). In Australia, water allocation reforms have led to limits on future withdrawal (that is, a ‘‘water cap’’) in the Murray-Darling River basin, subsequent development of a water market where allocations are traded, and creation of incentives to increase water productivity and efficiency (Blackmore 1999; MDBC 2004). Similarly, water markets developed in Mexico, Chile, and some western states in the United States have been used to secure flows for ecosystems (Thobani 1997).
Watershed management strategies that integrate ecological principles have been used to prevent water supply crises from developing. An often-cited example is the New York City water supply management strategy, which includes protection of riparian habitat in the nearby source area of the Catskills Mountains, thus eliminating the need to construct a water filtration plant at an estimated cost of $6 billion. The ~400,000-hectare Pinelands National Reserve in nearby New Jersey is regulated under a Comprehensive Management Plan developed at the local, state, and federal level in 1978–79 (Good and Good 1984). The plan permits a wide spectrum of land use development categories, ranging from intensive development to full protection, and it successfully redirected human activities to areas deemed appropriate while protecting a large core area, which is ecologically sensitive, drought-prone, and nutrient-poor and which harbors a unique community of wildlife with a large number of endemic species (Walker and Solecki 1999; Bunnell et al. 2003). The benefits of maintaining high water quality are recognized outside the reserve through the delivery of relatively high-quality fresh water to an estimated 9 million people in New York City for less than if a water filtration plant were built. In addition, water discharged into Delaware Bay helps to support populations of anadromous fish and spawning horseshoe crabs, which in turn support large numbers of migrating shorebirds and local industries.
7.2.5 Water Quality
Summarizing patterns and trends in water quality, particularly at a global scale, encompasses an array of challenges that include basic definitional problems, a lack of worldwide [[monitor (Environmental monitoring and assessment)]ing (Environmental monitoring and assessment)] capacity, and an inherent complexity in the chemistry of both natural and anthropogenic pollutants. From a management perspective, water quality is defined by its desired end use. Water for recreation, fishing, drinking, and habitat for aquatic organisms thus require higher levels of purity, whereas for hydropower, quality standards are much less important. For this reason, water quality takes on a broad definition as the ‘‘physical, chemical, and biological characteristics of water necessary to sustain desired water uses’’ (UN/ ECE 1995).
Natural water chemistry is inherently highly variable over space and time (Meybeck and Helmer 1989; Meybeck 2003), and aquatic biota are adapted to this variability. With added pressure from human activities, the biogeophysical state of inland waters plus their variability is altered, often to the detriment of aquatic species (see Chapter 20), thereby compromising the sustainability of aquatic ecosystems. Many chemical, physical, biological, and societal factors affect water quality: organic loading (such as sewage); pathogens, including viruses in waste streams from humans and domesticated animals; agricultural runoff and human wastes laden with nutrients (such as nitrates and phosphates) that give rise to eutrophication and oxygen stress in waterways; salinization from irrigation and water diversions; heavy metals; oil pollution; literally thousands of synthetic and persistent engineered chemicals, such as plastics and pesticides, medical drug residues, and hormone mimetics and their by-products; radioactive pollution; and even thermal pollution from industrial cooling and reservoir operations.
Furthermore, despite important improvements in analytical methodologies (UN/ECE 1995; Meybeck 2002), the capacity to operationally monitor contemporary trends in water quality is even more limited than monitoring the physical quantity of water. In terms of the spatial coverage, frequency, and duration of monitoring, data currently available for global and regional-scale assessments are patchy at best, leading to oversimplified and sometimes misleading information. (See Table 7.6.)

Data abundance is generally associated with level of economic Development: industrial countries show a higher level of data availability, while water quality in developing countries is less well monitored. Even when data from monitoring stations are available, they only provide a fragmented view of water quality issues for very local sections of rivers, necessitating potentially unreliable extrapolation to the rest of the basin (Meybeck 2002). For this reason, water quality assessments or trajectories are usually river- or station-specific. Even for the best-represented regions of the globe, a coherent time series of data is available for only the last 30 years or less, constraining the ability to clearly quantify trends in water quality.
Data comparability problems are yet another constraint on the utility of water quality data. Standardized protocols, in terms of sampling frequency, spatial distribution of sampling networks, and chemical analyses, are still not in place to ensure the production of comparable data sets collected in disparate parts of the world. The monitoring of groundwater supplies is even more problematic (Meybeck 2003; Foster and Chilton 2003); because groundwater is hidden from view, many pollution and contamination problems that affect supplies have been more difficult to detect and have only recently been discovered.
These many factors make it difficult to estimate the impact of changing water quality on global water supply. The following sections provide an overview assessment of trends in water quality that have bearing on the capacity of the contemporary water cycle to provide provisioning services for fresh water and on the sustainability of inland water systems. Other assessments specifically target water quality issues over selected regional-to-continental domains (e.g., AMAP 2002; Hamilton et al. 2004).
7.2.5.1 General Trends in Water Quality
The state of inland water quality illustrates the long-term and complex nature of human interactions with their environment. The earliest changes attributable to humans likely occurred in tandem with land use change in small to medium-sized catchments some 5,000 or 6,000 years ago in the Middle East and Asia, where water and sediment budgets were substantially altered (Wasson 1996; Vörösmarty et al. 1998b; Alverson et al. 2003; Meybeck et al. 2004). Water also has been considered since ancient times to be the preferred medium for cleaning, transporting, and disposing of wastes—establishing a tradition that today has substantially transformed the physical, biological, and chemical properties of global runoff.
A set of syndromes depicting riverine changes arising from anthropogenic pressures has been proposed (GACGC 2000; Meybeck 2003) through which society transforms inland fresh waters from a pristine state fully controlled by the natural Earth system to a modern condition in which humans provide many of the predominant controls. In most of the densely populated areas of the world, river engineering, waste production, and other human impacts have significantly changed the water and material transfers through river systems (Vörösmarty and Meybeck 1999, 2004) to the extent that this now likely exceeds the influence of natural drivers. This is true today in many parts of the Americas, Africa, Australasia, and Europe (Vörösmarty and Meybeck 1999, 2004).
The contrast between pristine and contemporary states can be dramatic and potentially global in scope. Changes to the global nitrogen cycle are emblematic of those in water quality more generally, through which high concentrations of people or major landscape disturbances (such as industrial agriculture) translate into a disruption of the basic character of natural water systems. In addition, modern changes often ‘‘reverberate’’ far downstream of the original point of origin. Compared with the preindustrial condition, loading of reactive nitrogen to the landmass has doubled from 111 million to 223 million tons per year (Green et al. 2004) or possibly 268 million tons (Galloway et al. 2004). (See also Chapter 12.) Model results show these accelerated loadings transformed into elevated freshwater transports through inland waterways to the coastal zone, doubling pre-disturbance rates from 21 million to 40 million tons per year (Green et al. 2004; Seitzinger et al. 2002). North America, continental Europe, and South, East and Southeast Asia show the greatest change. (See Figure 7.5 in Appendix A.)
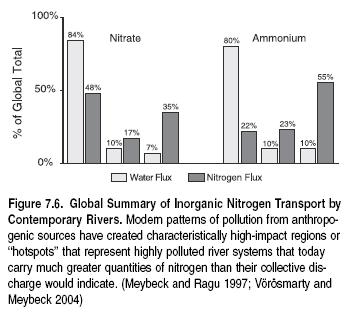
Riverine transport of dissolved inorganic nitrogen (immediate precursors to nutrient pollution, algal blooms, and eutrophication) have increased substantially from about 2–3 million tons per year from the preindustrial level to 15 million tons today, with order-of-magnitude increases in drainage basins that are heavily populated or supporting extensive industrial agriculture. Rivers with high concentrations of inorganic nitrogen constitute a major global source for inorganic nitrogen, despite relatively modest contributions to aggregate water runoff. (See Figure 7.6.) While it is noteworthy that aquatic ecosystems ‘‘cleanse’’ on average 80% of their global incident nitrogen loading (Green et al. 2004; Howarth et al. 1996; Seitzinger et al. 2002; Galloway et al. 2004), the intrinsic self-purification capacity of aquatic ecosystems varies widely and is not unlimited (Alexander et al. 2000; Wollheim et al. 2001). As a result, sustained increases in loading from land-based activities are already reflected in the deterioration of water quality over much of the inhabited portions of the globe, they extend their impacts to major coastal receiving waters (e.g., Rabalais et al. 2002), and they are likely to continue well into the future (Seitzinger and Kroeze 1998).
While the stark contrast between pristine and contemporary states demonstrates the overall impact of anthropogenic influences on water quality, much of the contamination of fresh water has occurred over the last century. The main contamination problems 100 years ago were fecal and organic pollution from untreated human wastewater. Even though this type of pollution has decreased in the surface waters of many industrial countries over the last 20 years, it is still a problem in much of the developing world, especially in rapidly expanding cities (WMO 1997; UN/WWAP 2003). (See also Chapter 27.)
In developing countries, sewage treatment is still not commonplace, with 85–95% of sewage discharged directly into rivers, lakes, and coastal areas (UNFPA 2001; Bouwman et al. 2005), some of which are also used for water supply. Consequently, water-related diseases, such as cholera and amoebic dysentery, among others, claim millions of lives annually (WHO/UNICEF 2000). In Europe, organic pollution and contamination by toxic metals are probably now less than the levels observed between the 1950s and1980s, due to improved environmental regulation (Meybeck 2003). In the developing world, the riverine evolution is likely to be similar to that found in Europe, with a major lag corresponding to their different stages of industrialization, urbanization, and intensification of agriculture (Meybeck 2003).
New pollution problems from agricultural and industrial sources have emerged in industrial and developing countries and have become one of the biggest challenges facing water resources in many parts of the world (WMO 1997). In Western Europe and North America, on the one hand phosphorus contamination in waterways has been reduced considerably with the introduction of phosphate-free household detergents, investments in wastewater treatment plants, and to some degree modified agroecosystem management. On the other hand, residues of synthetic pharmaceuticals for humans and livestock are increasingly being discovered at low doses in rivers and lakes (Schiermeier 2003). There are indications that these residues can disturb the physiology of invertebrates, and it is still a matter of debate whether and, if so, to what degree these newly discovered pollutants may affect human physiology (Daughton and Ternes 1999; Jones et al. 2003).
Water contamination by pesticides has grown rapidly since the 1970s. In a medium-sized river basin like the Seine, over 100 different types of active molecules from pesticides can be found (Chevreuil et al 1998). Even if the use of xenobiotic substances is increasingly being regulated in Western Europe and North America, bans—when they exist—occur generally two to three decades after the first commercial use of the products. For example, DDT, atrazine (a common pesticide), and PCBs were in use for a long time before they were banned in parts of the industrial world. In general these bans take longer to implement in the developing world, so these products are still commercialized and used in some countries.
In the United States, PCB and DDT records in estuarine sedimentary archives peaked in the 1970s and are now markedly decreasing (Valette-Silver 1993). At the same time, persistent xenobiotics are widespread, with a recent study (Kolpin et al. 2002) finding traces of at least one drug, endocrine-disrupting compound, insecticide, or other synthetic chemical in 80% of samples from 139 streams in 30 states of the United States. The persistence of these products in continental aquatic systems can be high, and their degradation products can be more toxic than the parent molecules (Daughton and Ternes 1999). Because of the poor monitoring of the long-term effects of xenobiotics, the global and long-term implications of their use cannot be fully assessed.
7.2.5.2 Global Ranking of Water Quality Issues Based on Regional Assessment
A global water quality assessment, originally as part of the Dublin International Conference on Water and the Environment and in preparation for the Rio Summit (Meybeck et al. 1991) is summarized here. The original report determined a global ranking of key water quality issues based on U.N. Global Environmental Monitoring System data, the perceptions of local/regional scientists and managers, published reports and papers, and expert knowledge. Lakes, groundwater, and reservoir issues were considered, although as Siberia and northern Canada were not expressly covered in the 1991 report, these have been considered separately using the same approach (Meybeck 2003). Eleven variables were considered and ranked, the scoring of which ultimately reflects the aggregate impact of human pressures, natural rates of self-purification, and pollution control measures.
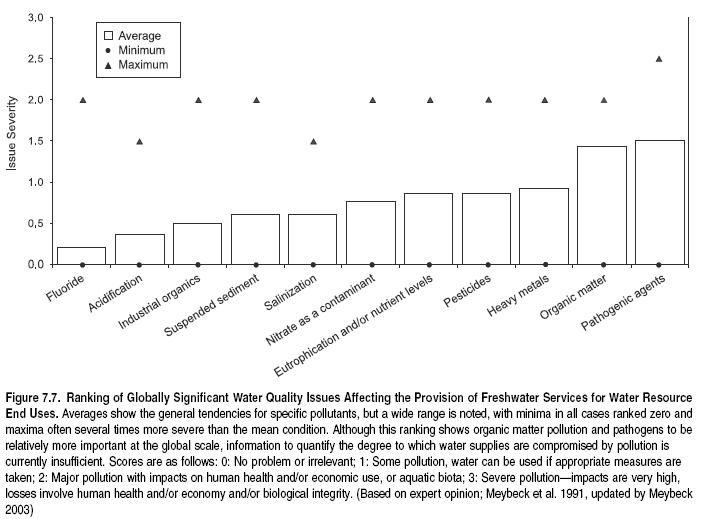
The results show that pathogens and organic matter pollution (from sewage outfalls, for example) are the two most pressing global issues (see Figure 7.7), reflecting the widespread lack of waste treatment. As water is often used and reused in a drainage basin context, a suite of attendant public health problems arises, thus directly affecting human well-being. At the other extreme, acidification is ranked 10 and fluoride pollution 11. The importance of the various issues varies between regions, however, and some of these globally low-ranked issues are particularly important in certain areas, such as acidification in Northern Europe, salinization in the Arabic peninsula, and fluoride in the Sahel and African Great Lakes (see maximum scores on Figure 7.7). Fluo- ride and salinization issues are mostly due to natural conditions (rock types and climate), but mining-related salinization can also be found (for instance, in Western Europe). All other concerns directly arise through human influences. An annotated continental summary is given in Table 7.7.
Although these updated results correspond well to the state of water quality in the 1980–90s (Meybeck 2003), since the 1990s the situation in most developing countries and countries in transition is likely worse in terms of overall water quality. In Eastern Europe, Central and South populated Americas, China, India, and populated Africa, it is probably worse for metals, pathogens, acidification, and organic matter, while for the same issues Western Europe, Japan, Australia, New Zealand, and North America have shown slight improvements. Nitrate is still generally increasing everywhere, as it has since the 1950s. In the former Soviet Union there has been a slight improvement in water quality due to the economic decline and associated decrease in industrial activities. Eastern Europe has also seen some improvements, such as those in the Danube and the Elbe basins. A few rivers, such as the Rhine, have seen a stabilization of nitrate loads after 1995.
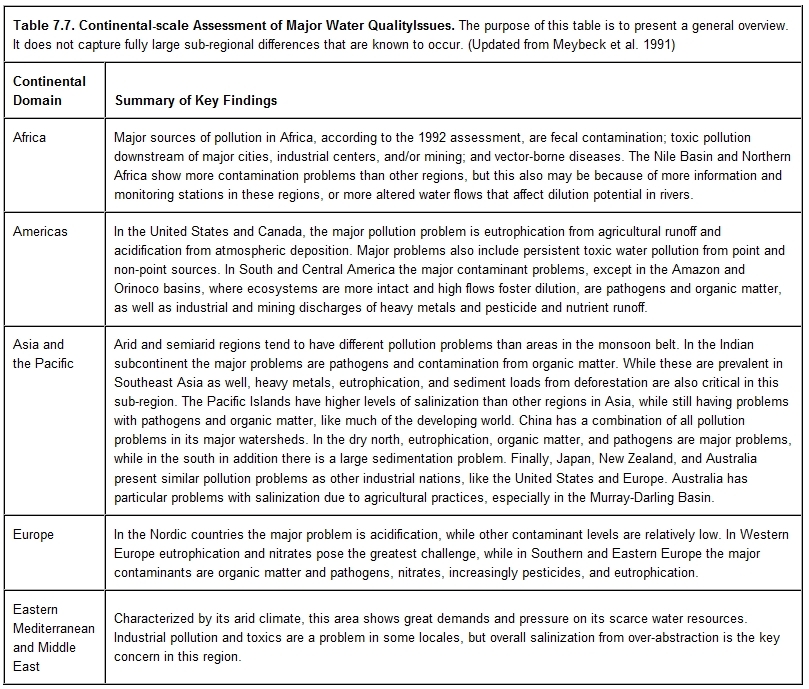
7.3 Drivers of Change in the Provision of Fresh Water
The drivers of change in the global water cycle and the system’s capacity to generate freshwater provisioning services act on a variety of spatial and time scales. Throughout history, humans have pursued a very direct and growing role in shaping the character of inland water systems, often applied at local scales, but sometimes reflecting provincial or national policies on water. The collective significance of human influences on the hydrologic cycle may today be of global significance, but this has only recently begun to be articulated (Vörösmarty and Meybeck 2004).
Humans today control and use a significant proportion of the runoff—from 40% to 50% (Postel et al. 1996)—to which the vast majority has access. Given high numbers of people dependent on water provisioning services derived from ecosystems and the growing degree of water crowding, urbanization, and industrialization, the global water cycle is and will continue to be affected strongly by humans.
Water engineering to facilitate use by humans has fragmented aquatic habitats, interfered with migration patterns of economically important fisheries (Fisheries and aquaculture), polluted receiving waters, and compromised the capacity of inland water ecosystems to provide reliable, high-quality sources of water. Land cover changes have also altered the patterns of runoff and created sources of pollution, negatively affecting human health, aquatic ecosystems, and biodiversity. (See Chapter 20.) Due to a growing reliance on irrigated agriculture for domestic food production and international trade, freshwater services—in decline in many parts of the world through non-sustainable resource use practices—are directly linked to the global food security issue. (See Chapters 8 and 26.) Finally, natural climate variability and anticipated changes associated with greenhouse Warming convey additional, major constraints on the provision of renewable freshwater services.
7.3.1 Population Growth and Development
Population growth is a major indirect driver of change in the provision of fresh water. Although freshwater supplies are renewed through a more or less stable global water cycle that produces precipitation in excess of evapotranspiration over the continents, the mean quantity of water supply available per capita is ever-decreasing due to population growth and expanding consumptive use (Shiklomanov and Rodda 2003). Human population doubled from 1960 until the present (Cohen 2003), and nearly 20 contemporary cities are home to 10 million people or more (Cohen 2003). Substantial flow stabilization and increased withdrawals have occurred across all regions, supporting an increase in the number of people sustained by the accessible, renewable water supply.
Continued growth in population will fuel increases in food production, which in the context of a stable cropland base (Bruinsma 2003) will require greater diversions of fresh water for irrigation or considerably more efficient use of water supplies. The same applies to industry and municipalities, amplifying current pressures on the global water supply. Economic development, technology, and lifestyle changes (such as increasing meat consumption) further define the functional availability of water in the context of declining per capita supplies. Over the twentieth century, water withdrawals increased by a factor greater than six—more than twice the rate of population growth (WMO 1997).
In addition to increased water demands, as mentioned in section 7.2.5, pollution from industry, urban centers, and agricultural runoff limits the amount of surface and groundwater available for domestic use and food production. Threats of water quality degradation are most severe in areas where water is scarce because the dilution effect is inversely related to the amount of water in circulation.
7.3.2 Managed Water Supplies
A broad array of water engineering schemes has enabled variability in the hydrologic cycle to be controlled and increasing amounts of water to be stored and withdrawn for human use. This technology refers to any sort of engineering used in the storage, management, and distribution of water, such as dams, canals, water transfers, irrigation ditches, levees, and so on. It also includes both traditional water harvesting techniques as well as modern production and treatment facilities like desalinization plants.
Global patterns of water management are not driven solely by investments in technology and large-scale engineering. Water is also managed through international trade, by way of the embodied or ‘‘virtual’’ water content of commodities exchanged. The agricultural sector, in particular, requires huge amounts of rainfall or irrigation water, much of which is lost to evapotranspiration, and in the case of irrigation there are also transit losses. Water input-to-crop output ratios, expressed on a weight-to-weight basis, vary from the hundreds to the thousands. Given enormous contrasts in local availability of fresh water, there is a potentially enormous comparative advantage in virtual water trade strategies that transport products from water-rich to water-poor areas.
This section first assesses the role of major engineering works in the provision of water and then considers the significance of virtual water trade of agricultural products in the global economy.
7.3.2.1 The Role of Engineering on Water Supply
7.3.2.1.1 Dams and reservoirs
Humans have altered waterways around the world since historical times to harness more water for irrigation, industry, and domestic and recreational use. Dams have been a particularly significant driver of change, buffering against both spatial and temporal scarcity of water supplies and increasing the security of water and food supply over the past half-century. However, large engineering works that impound and divert fresh water have caused damage to key [[habitat]s] and migratory routes of important commercial and subsistence fisheries (Fisheries and aquaculture) (Revenga et al. 2000), as well as serious societal disruptions, including public health problems (as described later; see also Chapter 14) and forced displacements (WCD 2000).
Large dams are today the fundamental feature of water management across the globe (FC/GWSP 2004). Approximately 45,000 large dams (>15 meters in height) (WCD 2000) and possibly 800,000 smaller dams (McCully 1996; Hoeg 2000) are in place and an estimated $2 trillion has been invested in them over the last century. These facilities have served as important instruments for development, with 80% of the global expenditure of $32–46 billion per year focused on the developing world (WCD 2000).
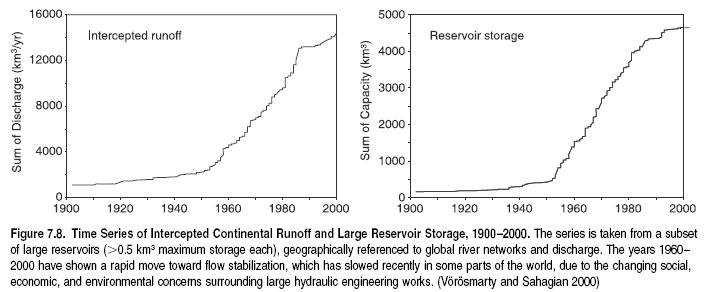
Major stabilization of global river runoff from major engineering works expanded greatly between 1950 and 1990. (See Figure 7.8.) Currently the largest reservoirs—those with more than 0.5 cubic kilometers of storage capacity—intercept locally 40% of the water that flows off the continents and into oceans or inland seas (Vörösmarty et al. 2003). The volumetric storage behind all large dams represents from three to six times the standing stock of water held by natural river channels (Vörösmarty et al. 1997a, 2003; Shiklomanov and Rodda 2003). In addition, large reservoir construction has doubled or tripled the residence time of river water—that is, the average time that a drop of water takes to reach the sea, with the mouths of several large rivers showing delays on the order of many months to years (Vörösmarty et al. 1997a).
Such regulation has enormous impacts on the water cycle and hence aquatic habitats, suspended sediment, carbon fluxes, and waste processing (Dynesius and Nilsson 1994; Vörösmarty et al. 2003; Stallard 1998; Syvitski et al. 2005). Large dams, in particular, have been a controversial component of the freshwater debate. While contributing to economic development and food security, they also produce environmental, social, and human health impacts. A World Bank review (1996a) of the impacts and economic benefits of 50 large dams concluded that these projects showed proven economic and development benefits but had a mixed record in terms of their treatment of displaced people and environmental impacts. A further review by the World Commission on Dams on the performance of large dams showed considerable shortfalls in their technical, financial, and economic performance relative to proposed expectations, particularly irrigation dams, which often have not met physical targets, failed to recover cost, and have been less profitable than expected (WCD 2000).
In Pakistan, for example, the direct benefits from irrigation made possible by the Tarbela and Mangla dams are estimated at about $260 million annually, with the farmers who own irrigated land clearly benefiting from increased incomes (World Bank 1996a). However, the increased use of irrigation water has led to waterlogging and increased soil salinity in the Punjab area, with a direct link to a decline in crop productivity, and an increase in malaria transmission (World Bank 1996b).
Hydroelectricity is another important benefit from dams. Total production of hydropower reached 2,740 terawatt-hours in 2001 or 19% of global electrical production, and many industrial (such as Norway and Iceland) and developing countries (Democratic Republic of Congo, Mozambique, Brazil, Honduras, Tajikistan, and Laos) rely on dams for more than 90% of their power production (UN/WWAP 2003). As with irrigation dams, in many circumstances the effectiveness of large dams for hydroelectricity generation has not been sufficient to meet the predicted benefits (WCD 2000), and they have caused loss of habitats and species as well as the displacement of millions of people (WCD 2000).
Flood control continues to be another major objective for building large dams. In Japan, for example, 50% of the population lives in flood-prone areas, and in the last 10 years floods have affected 80% of municipalities in the country. Japan is one of the top five dam-building countries in the world. Matsubara and Shimouke Dams on the Chikugo River in the Kyushu District in southern Japan, for instance, were built for flood control after a flood in 1953 inundated one fifth of the entire catchment, killing 147 people and destroying 74,000 households. These two dams successfully reduced peak flows in the river years later during a 1982 flood, saving lives and property (Green et al. 2000).
However, the effectiveness of large dams to replace the role of natural wetlands for flood mitigation is not well supported by scientific evidence. Wetlands and floodplains act as natural sponges; they expand by absorbing excess water in time of heavy rain and they contract as they release water slowly throughout the dry season to maintain streamflow. (See Chapter 20.) The large-scale conversion of floodplains and wetlands (some of it through dams) has resulted in declines in the natural mechanism for flood regulation. And while a handful of dams are being decommissioned in some countries (268 out of 80,000 in the United States, for example), an estimated 1,500 dams are under construction worldwide and many more are planned, particularly in the developing world (WWF and WRI 2004). River basins with the largest number of dams over 60 meters high planned or under construction include the Yangtze Basin in China with 46 large dams, the La Plata Basin in South America with 27, and the Tigris and Euphrates River Basin in the Middle East with 26 (WWF and WRI 2004).
The debate on cost, benefits, and performance of large dams continues, but given recent reviews (see WCD 2000), the traditional reliance on constructing such large operations for water supply is being called into question on environmental, political, and socioeconomic grounds (Gleick 1998; WCD 2000).
7.3.2.1.2 Interbasin transfers
Interbasin water transfers represent yet another form of securing water supplies that can greatly alleviate water scarcity. They include any canals, ditches, tunnels or pipelines that divert water from one river or groundwater system to another, typically from dammed reservoirs, and often represent massive engineering works involving both ground and surface waters. Changes to natural surface water hydrographs can be enormous and virtually instantaneous. The Great Man-Made River Project in Libya, for example, transports over 2 cubic kilometers of fossil groundwater a year through 3,500 kilometers of desert to huge coastal storage reservoirs that support 135,000 hectares of irrigable cropland, one third of the country’s total (UN/WWAP 2003).
Two of the world’s largest interbasin transfers are the 93% loss of flow (27 cubic kilometers per year) from the Eastmain River and a 97% gain of flow (53 cubic kilometers per year) in the La Grande River (Dynesius and Nilsson 1994), both in Canada. In total, the flow being diverted without return to its stream of origin in Canada alone totaled 140 cubic kilometers a year in the 1980s (Day and Quinn 1987), more than the mean annual discharge of the Nile River and twice the mean annual flow of Europe’s Rhine River. The Farraka Barrage alone diverts over 9% of the Ganges River’s historical mean annual flow and over 5% of the flow for the entire Ganges-Brahmaputra basin (Nilsson et al. 2005).
A gigantic diversion project is also under way in China, which proposes to move 40 cubic kilometers per year (MWR 2004) of water from southern China to the parched parts of northern China, thus connecting the Yangtze River with the Hai, Huai and Yellow Rivers. Three channels, two of which are over 1,000 kilometers long, will be needed for this transfer, which corresponds to 4% of the average flow of the Yangtze River (U.S. Embassy in China 2003). Developers plan to bring enough water to replenish groundwater aquifers in the north. This withdrawal from the Yangtze, even though it represents only a small fraction of the river’s annual flow, will likely still have some effect on downstream ecosystems: sediment loads needed to maintain riparian and coastal wetlands will be reduced, and pollutants will be marginally less diluted, raising their concentration in the Yangtze River’s lower reaches (U.S. Embassy in China 2003). In addition, as water flows north from one basin to another, the introduction of non-native species and the transfer of contaminants could affect native fauna in the receiving basins (Snaddon and Davies 1998; Snaddon et al. 1998; U.S. Embassy in China 2003).
Social effects of interbasin water transfers are complex. Populations in the recipient basin of water transfers gain water for irrigation, industry, and human consumption, all leading to indisputable economic and social benefits. However, those living in the basin of origin (and particularly those downstream of the diversion point) often lose precisely those same benefits (Boyer 2001), and many times they are displaced to other parts of the country, losing their homes and cultural heritage. While sometimes economic compensation is offered to people displaced by dams, the amounts usually do not cover the potential losses in terms of livelihoods, economic productivity, and cultural and historical heritage (WCD 2000).
Resettlement is an issue for water transfers as well as for dams, with many resettled communities suffering from a marginalized status, and cultural and economic conflicts with the population into which they are resettled. The central route of the Yangtze-to- Yellow water transfer in China, for example, will require the resettlement of 320,000 people, each of whom is supposed to receive the equivalent of $5,000 in compensation (U.S. Embassy in China 2003).
The trade-offs involved in interbasin transfer schemes include both direct societal costs and benefits, as well as those involving ecosystems services and biodiversity. Yet given increasing demands for water in the future, such transfers are likely to remain an important mechanism for alleviating regional water shortages (Nilsson et al. 2005).
7.3.2.2 Virtual Water in Trade
Virtual water, or VW, refers to the amount of fresh water used during the production process and thus ‘‘embodied’’ in a good or service (Allan 1993). While tabulations could be made for any product, VW has been explored mainly from the perspective of crop and livestock production and trade, given the predominance of agriculture in water use globally.
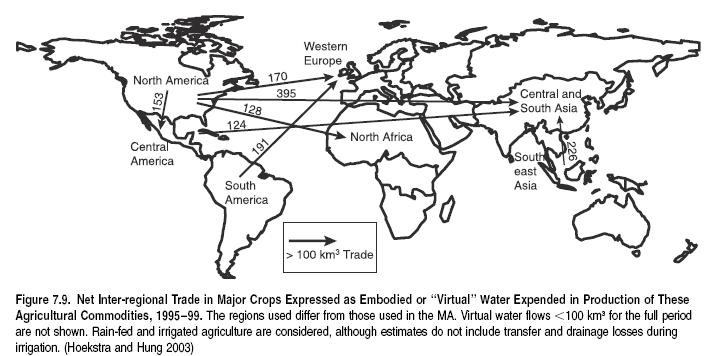
Operationally, VW in agriculture can be defined as the quantity of water used to support evapotranspiration in crops, which are then consumed domestically (as human food or animal feeds) or traded internationally. Additional water to process food products and to care for livestock can also be tabulated (Oki et al. 2003a), but VW estimates are fundamentally determined by irretrievable water losses through crops. There is a vast mismatch between the weight of agricultural commodities produced and the VW embodied in their production. For example, 1 kilogram of grain requires 1,000–2,000 kilograms (liters) of water, even under the most favorable of climatic conditions (Hoekstra and Hung 2002), producing 1 kilogram of cheese requires >5,000 kilograms of water, and 1 kilogram of beef requires an average of 16,000 kilograms of water (Hoekstra 2003).
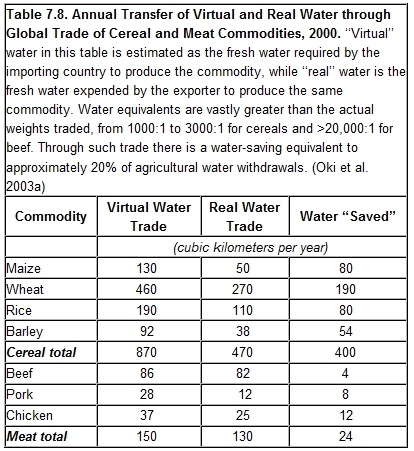
Water has been transported in internationally traded products for hundreds of years, but the concept of trading VW has only recently begun to be considered as a mechanism to alleviate regional or global water security by exploiting the comparative advantage of water-rich or water-efficient countries (Allan 1996; Jaeger 2001). However, VW does not take into account the nature of food production systems and other factors, such as soil erosion, biodiversity impacts, or pollution. Moreover, for political and social reasons, countries may elect to be self-sufficient and independent in food production. For example, India, which is food self-sufficient in aggregate, serves as a net exporter of food and virtual water despite being water-stressed.
A substantial volume of VW trade in food commodities has nonetheless been taking place. (See Figure 7.9.) Worldwide, international VW trade in crops has been estimated at between 500 and 900 cubic kilometers per year, depending on tabulations made from the exporting or importing country perspective and the number of commodities considered (Oki et al. 2003a; Hoekstra and Hung 2002; Hoekstra 2003). (See Table 7.8.) An additional 130–150 cubic kilometers per year is traded in livestock and livestock products. For comparison, current rates of water consumption for irrigation total 1,200 cubic kilometers per year, and taking into account the use of precipitation in rain-fed agriculture as well, the total water use by crops has been estimated to range from 3,200 to 7,500 cubic kilometers per year, depending on whether allied agroecosystem evapotranspiration is included (Postel 1998; Rockstro¨m and Gordon 2001). The most important exporters of crop-related VW are the OECD and Latin America, though individual sub-regions, such as Western Europe, are net importers of VW. Asia (Central and South) is the largest importer of VW.
Of the top 10 virtual water exporters, 7 countries are in water-rich regions, while of the 10 largest importers of VW, 7 are highly water-short, indicating a general redistribution of VW from relatively wet to dry regions. However, the notable absence of clear-cut relationships linking the degree of domestic water scarcity to dependence on external VW supplies (Hoekstra and Hung 2002) suggests that an optimal redistribution of water through crop production and trade is yet to emerge. The consequences of food self-sufficiency thus entrench present-day patterns of water scarcity, as can decisions to pursue an aggressive export marketing strategy in the face of unsustainable water use. Future increases in water stress over the coming decades (Vörösmarty et al. 2000; Alcamo et al. 2000) and further integration of a global economy are likely to be powerful forces in adopting the notion of VW into food production and trade policies. An analysis of international trade in VW for Africa is provided in Box 7.4.
|
BOX 7.4 Virtual Water Content Associated with African Food Supply |
|
The interplay between water availability and irrigation is critical in defining whether a country (or regions within a country) can be self-sufficient in food production and do so in a sustainable manner. This is especially true in Africa, where the climate and hydrology are highly unpredictable and as much as 40% of irrigation withdrawals in the driest regions are estimated to be non-sustainable (Vörösmarty et al. 2005). Africa also represents a flashpoint for future water scarcity and food security, with a large and rapidly growing population (Population growth rate), enormous expanses of dry landscapes, extensive poverty, lack of investment in water infrastructure, and a lingering human health crisis. Virtual water is the fresh water needed to produce crops embodying all evapotranspiration on rain-fed or irrigated cropland, plus any transit losses for irrigation (Raskin et al. 1995; Allan 1996). There are enormous throughputs of water within agroecosystems to satisfy the evaporative demands of crops, with ratios of >1,000-to-1 by weight for cereal products and >15,000-to-1 for beef (Hoekstra 2003). Thus, while food trade can be highly beneficial in simply economic terms, it could also help compensate for local water scarcity by exploiting the comparative advantage of water-rich countries to produce food (Allan 1996; Jaeger 2000). The map of Africa (see Box 7.4 Figure A in Appendix A) shows the spatial distribution of annual virtual water production on rain-fed and irrigated croplands, computed from long-term average (1950–95) water balance terms. VW embodied in meat (beef, pork, and chicken) production was also estimated as the sum of VW in feed and fodder plus a portion of evapotranspiration that occurs over grazing lands, where it is assumed that 30% of net primary production and hence evapotranspiration could be used sustainably. In Africa, much of the sustainable (rain-fed) agriculture occurs within the more humid regions of the continent, while most irrigated agriculture occurs in the semiarid and arid regions in northern and southern Africa and along the Sahel. At the continental scale, about 18% of total African VW is used for meat production, although this number is probably much higher because it is doubtful that all grazing land is used sustainably. Food imports (both crops and meat) represent over 20% of Africa’s total VW consumption, illustrating a reliance on external sources for meeting the food needs of today’s population. This reliance will likely continue to increase in the future, though some unknown fraction is intra-continental. Globally, VW from crop production is computed to co-opt 14,600 cubic kilometers (20%) of the 66,400 cubic kilometers annual evapotranspiration. For Africa, crop production co-opts only 9% of annual evapotranspiration, a reflection of the fact that three quarters of Africa’s cropland is located in arid and semiarid climates characterized by highly limited soil moisture stocks (Vörösmarty et al. 2005). The bar chart (see Box 7.4 Figure B in Appendix A) illustrates that while sub-Saharan Africa relies heavily on rain-fed agriculture (60–75% for South, East, West) and very little on irrigated agriculture (3–7%) for food production, North Africa has very little rain-fed crop production and obtains more than 60% of its within region VW from irrigated agriculture. Much of this irrigation water is with drawn from highly exploited river corridors, such as the Nile, as well as groundwater. To satisfy overall food demand, North Africa nearly doubles its available VW through food trade. |
7.3.3 Land Use and Land Cover Change
Among the major processes influencing water quantity and quality at the river basin scale are changes in land use intensity and land cover change. (See Table 7.9.) Land use changes affect evapotranspiration, infiltration rates, and runoff quantity and timing. Particularly important for human well-being are contrasting reductions in the overall quantity of available runoff with some types of land cover change versus concentrated peaks of runoff associated with flooding under other land cover changes that can often be translocated far downstream through river networks (Douglas et al. 2005).

For example, expanding impervious areas due to urban expansion greatly increases the volume and rate of stormflow into receiving streams. Such changes also affect the water quality and biodiversity of freshwater (Freshwater biomes) ecosystems (Jones et al. 1997). Land use changes that compact soils and reduce infiltration are associated with deficiencies in groundwater recharge and dry period baseflow, the long-term global consequences of which are yet to be documented. Reduced infiltration can also lead to longer lifespans of pools with stagnant water, thus providing increased breeding opportunities for mosquitoes and other vectors of human disease.
The impact on local water budgets of changes from forest cover to pasture, agricultural, or urban land cover are well documented in the hydrological and ecological literature. While historically a large portion of the available information was generated for temperate and boreal areas of North America and Europe (Swank and Crossley 1988; Buttle et al. 2000), information is becoming available for selected sites in Amazonia, South Africa, and Australia, among others (Bruijnzeel 1990; Le Maitre et al. 1999). The global impact of 110,000 square kilometers per year net deforestation (FAO 1999) on runoff, however, has yet to be fully quantified.
Impacts of land use change patterns of weather and climate at different scales are only starting to be understood. (See Chapters 12 and 15.) These inputs are translated into greatly elevated fluxes to and transport through inland water systems (Chapter 13 (Ecosystems and Human Well-Being: Volume 1: Current State and Trends: Freshwater Ecosystem Services).) Fragmenting a landscape alone can generate changes in local weather patterns (Avissar and Liu 1996; Pielke et al. 1997). At the continental level, land use changes can reduce recycling rates of water leading to reduced precipitation and distortions in the atmospheric circulation patterns that link otherwise widely separated regions of the globe (Chase et al. 1996; Costa and Foley 2000; Pitman and Zhao 2000). There has also been continental-to- global-scale acceleration in the loading of pollutants, including nutrients, onto the land mass associated with industrial agriculture, urbanization, and grazing. (See Chapter 20), the effects of which pass in many cases fully to the coastal zone (Chapter 19).
Intensive agricultural and urbanized areas have expanded rapidly in the last 50 years. The current extent of cultivated systems provides an indication of the location of freshwater (Freshwater biomes) ecosystems that are likely to experience water quality degradation from pesticide and nutrient runoff as well as increased sediment loading (Revenga et al. 2000). (See Figure 7.10 in Appendix A.) Figure 7.11 (in Appendix A) shows, from a drainage basin perspective, the distribution and pattern of urban areas, as judged by satellite images of nighttime lights for 1994–95 (NOAA-NGDC 1998). Because more urbanized river basins tend to have greater impervious area as well as higher quantities of sewage and industrial pollution, this figure suggests the contemporary geography of pressures on freshwater systems arising from these classes of contaminants (Revenga et al. 2000).
The two Figures show contrasting patterns of modified land Use across the world. Intensively cropped lands are concentrated in five areas: Europe, India, eastern China, Southeast Asia, and the midwestern United States, with smaller concentrations in Argentina, Australia, and Central America. Africa is striking for its lack of intensively cropped land, with the exception of small patches along the Nile, on the Mediterranean coast, and in South Africa. This reflects the minimal use of chemical inputs and the low level of agricultural productivity in most African countries. Figure 7.11 shows that highly urbanized watersheds are concentrated along the east coast of the United States, Western Europe, and Japan, with smaller concentrations in coastal China, India, Central America, most of the United States, Western Europe, and the Persian Gulf (Revenga et al. 2000). While Figures 7.10 and 7.11 show the average composition of each large river basin in terms of intensively cultivated land or urban and industrial areas, they nonetheless hide within-basin differences that arise from highly localized patterns of crop production and urban point sources of pollution (Revenga et al. 2000).
The implications of these changes and the incomplete understanding of their consequences affect the manner in which humans interact with the water cycle. Integrated watershed management is the current paradigm for sustainable water use and conservation (Poff et al. 1997). It can yield important environmental and social benefits, as shown by a survey of 27 U.S. water suppliers that found the cost of water treatment in watersheds forested 60% or more was only half that of systems with 30% forest cover (Ernst 2004).
In practice, the integrated management approach is complex and difficult to implement because of limits to the understanding of interactions linking the physical and biotic processes that control water quantity and quality (Schulze 2004). Integrated management research typically has focused on local and short time scales and been limited to a very small portion of the world’s watersheds. Most of the understanding of watershed dynamics and management principles comes from hydrological research on small watersheds and from studies at the local scale (Vörösmarty 2002). At present, the longest hydrological studies encompass only the last 20–40 years, but the recent application of GIS techniques facilitates reconstruction of past events to place the impact of contemporary land management into a longer-term perspective (Bhaduri et al. 2000).
One significant challenge to both scientific understanding and sound management is that multiple processes control water quantity, quality, and flow regime. The pattern and extent of cities, roads, agricultural land, and natural areas within a watershed influences infiltration properties, evapotranspiration rates, and runoff patterns, which in turn affect water quantity and quality. Additional challenges surround the fact that river basins extend across contrasting political, cultural, and economic domains (the Mekong River, for instance, flows through China, Laos, Thailand, Cambodia, and Viet Nam). Thus, there remains substantial uncertainty about the effects of management on different components of the hydrological cycle arising from the unique combinations of climatic, social, and ecological characteristics of the world’s watersheds (Bruijnzeel 1990; Tollan 2002).
It is widely recognized that while much more information is needed to evaluate the impact of land use and cover change on freshwater provisioning services, integrated watershed management— despite its present degree of uncertainty—is both possible and would contribute significantly to improved management of water resources (Swanson 1998; Tollan 2002).
7.3.4 Climate Change and Variability
A major and natural characteristic of the land-based water cycle, and hence of water supply, is its variability over space and time. The large-scale patterns of atmospheric circulation dictate the world’s climate zones and regional water availability. One particular concern arises from climate change, which in the past has shaped major shifts in the water cycle, such as changes in the Sahara from a much wetter region with abundant vegetation (Land-cover) about 10,000 years ago to the desert of today (Sircoulon et al. 1999). A changing climate can modify all elements of the water cycle, including precipitation, evapotranspiration, soil moisture, groundwater recharge, and runoff. It can also change both the timing and intensity of precipitation, snowmelt, and runoff.
Two issues are critical for water supply: changes in the average runoff supply and changes in the frequency and severity of extreme events, including both flooding and drought. Both of these changes have been difficult to articulate due to complexities in the processes at work as well as a non-uniform and, in many parts of the world, deteriorating [[monitor (Environmental monitoring and assessment)]ing (Environmental monitoring and assessment)] network, as discussed in section 7.1.2.
Shiklomanov and Rodda (2003) present a study of continental-scale variations in water supply as represented in the observational record spanning 1921–88. They used data from a total of approximately 2,500 stations, maximizing, to the degree possible, length of record, suitably large river basins, and hydrographs reflecting near-natural conditions. The stations represented <10% of all available records and reflect great disparities in maximum length of record (from 5 to 178 years). (Statistically, the optimal record length for trend analysis is on the order of 30 years (Lanfear and Hirsh 1999; Shiklomanov et al. 2002), but detectability of a trend also depends on the relative lengths of the ‘‘base’’ (pre-change) and changed periods of record (Radziejewski and Kundzewicz 2004).)
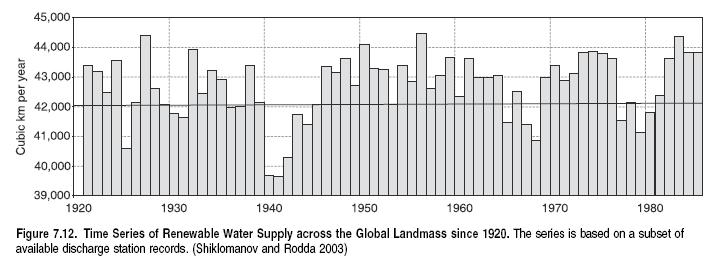
Year-to-year variations over five continents were 10% or less (see Figure 7.12) but rose to as high as 35% when examining 27 climate-based subdivisions. Relatively dry periods occurred in the 1940s, 1960s, and late 1970s, with global runoff declining by up to 3,000 cubic kilometers a year. This is in contrast to relatively wet conditions in the 1920s, late-1940s to early 1950s, and mid- 1970s. Though there are limitations to making such global statements, the overall conclusion with respect to renewable supplies of runoff is that despite some recent continental-scale trends (an increase in South America and decrease in Africa), there was no substantial global trend in renewable supplies of runoff over the 67 years tested. Labat et al. (2004) did, however, compute an increasing global trend in runoff. This was correlated to increasing global surface air temperature, amounting to 4% per degree Celsius over the last century, though with regional increases (Asia, North and South America) and decreases (Africa) or stability (Europe) over the last few decades.
Care must be exercised in interpreting such long-term trends, which are anticipated to be associated with climate change. Maps of trends presented by the IPCC (Houghton et al. 2001) show large-scale and spatially coherent increases as well as decreases in precipitation over multi-decadal periods that start in 1910, although these patterns shift depending on the time frame observed. A similar time dependency is evident in interpreting changes in rain-to-snow ratios across Canada, with a time frame of 1948–96 indicating completely opposite results than with a time series starting at 1960 and ending in 1990 (Mekis and Hogg 1999; Lammers et al. 2001).
The clearest signatures require long time periods and sufficient spatial integration units (that is, large drainage basins). Peterson et al. (2002), for example, found it impossible to detect a coherent trend in runoff without first aggregating the flow records from six large Eurasian rivers and over 65 years. Insofar as northern Eurasia is among the regions historically to show the clearest trends in climate warming and the general absence of other confounding effects such as land cover change and water engineering, these results point to the difficulty in assessing recent runoff trends.
Nonetheless, there is evidence that climate change may already be causing long-term shifts in seasonal weather patterns and the runoff production that defines renewable freshwater supply. Shifts toward less severe winters and earlier thaw periods in cold temperate climates that depend on snowfall and snowmelt result in important changes in water availability (Dettinger and Cayan 1995; Hamlet and Lettenmaier 1999; WSAT 2000; Hodgkins et al. 2003). Multi-decade hydrological anomalies are apparent for Africa, with decreases on the order of 20% between 1951 and 1990 for both humid and arid zone basins that discharge into the Atlantic (Mahé 1993).
In the Sahel, persistent rainfall deficits could entrench desertification through a critical loss of water recycling between land and atmosphere, exacerbated by reduced soil infiltration when so-called hydrophobic soils are created in arid environments, and by soil compaction over poorly managed lands (Sircoulon et al. 1999). Such rainfall deficits also reduce replenishment of the groundwater resource, exacerbated by the decreased permeability of soils that favor storm runoff and flooding, even in the context of lower overall precipitation. In the transition zones between wet and dry regions across Africa, there is a highly uneven and erratic distribution of rainfall and river corridor flow (Vörösmarty et al. 2005). While this climate already produces chronic water stress, episodic droughts greatly increase the number of people at risk. Once each generation, the major sub-regions of the western Sahel, Horn of Africa, and SADCC region see a tripling in the number of people at risk from severe water stress (Vörösmarty et al. 2005).
An intensification of the water cycle, through more extreme precipitation in the United States (Karl et al. 1996; Karl and Knight 1998) and other parts of the world (Easterling et al. 2000; Houghton et al. 2001; Frich et al. 2002) has also been recorded. However, the effect of these increases on the rest of the hydrological Cycle is only now being articulated.
In the United States, where sufficient records are available, Lins and Slack (1999) and Douglas et al. (2000) used stream gauging Stations with 50 years of continuous records (from unregulated systems) to conclude that annual minimum and mean flows have increased. This was later confirmed by McCabe and Wollock (2002), who found statistically significant increases in annual moisture surplus (moisture that eventually becomes runoff ) over the contiguous United States as a whole, but especially in the East. And while Yue et al. (2003) found similar increases in minimum and mean daily flows in northern Canada, they found the opposite to be true (significant decreases in minimum, mean, and maximum daily flows) in the southern part of the country.
Groisman et al. (2004) reported that warming in the northern half of the coterminous United States was related to a reduction in the extent of springtime snow cover and to the earlier onset of spring-like weather conditions and snow retreat. This has resulted in the increased frequency of cumulonimbus clouds and in a nationwide increase in very heavy precipitation. Warming in the southwest and northeast part of the country has led to greater summer dryness and increased fire danger. An interseasonal shift of precipitation from summer to fall in the Southeast was also noted.
The effect of increased precipitation extremes on floods is still debated (Douglas et al. 2000; Groisman et al. 2001; McCabe and Wolock 2002; Robson 2002; Milly et al. 2002) because flood response is influenced by many interacting factors, such as basin geology, terrain, and land cover as well as basin size and rainfall patterns. Also, the natural variability of flood flows can mask small changes in precipitation inputs.
Trends are also apparent in soil moisture distributed around the globe. Historical time series from more than 600 sites indicate a modest increase in growing period wetness for the majority of stations examined (Robock et al. 2000), contrary to the expectation (by general circulation models) of drier conditions in mid-continental areas due to climate change (e.g., Cubasch and Meehl 2000).
Taken together, these results indicate a high natural degree of variability and difficult-to-interpret shifts in runoff generation associated with historical climate change. The detection of such changes is complicated by the interactions among existing physical climate variations (that is, decadal and ENSO-type oscillations), land cover change, and water engineering, which for many parts of the world dominate the character of renewable water supplies.
7.3.5 Urbanization
During the twentieth century, the world’s urban population increased almost fifteenfold, rising from less than 15% to close to half the total population (see Chapter 27), and by 2015 nearly 55% of the world will live in urban areas (UNPD 2003). In developing countries alone, the proportion of the population living in urban centers will rise from less than 20% in 1950 to 48% in 2015 (UNPD 1999, 2003). In fact, 60% of the fastest-growing cities with more than 750,000 people are located in the developing world, mostly in Asia (World Bank 2001). While 70% of the world’s water use is for agriculture, the remaining withdrawals are for domestic household and other urban uses, including industry, and in many places these water resources are heavily polluted and limited by local shortages and distribution problems (UN-HABITAT 2003).
Urban residents bring with them a set of new challenges for water supply delivery, management, and waste treatment (WHO/ UNICEF 2004; UN-HABITAT 2003). Because of the rapid rate of increase in cities around the world, water infrastructure is practically unable to keep apace, especially in the megacities with more than 10 million people. Large parts of these megacities lack the basic infrastructure for drinking water and sanitation, and most large cities in the developing world, and many in the industrial world, lack basic waste and storm water treatment plants (UN-HABITAT 2003).
The geographic location of many of these large and growing cities, such as close to coastal areas, and their rapid pace of growth has encouraged the overtapping of water resources that are not necessarily renewable, such as coastal [[aquifer]s]. In Europe, for instance, nearly 60% of the cities with more than 100,000 people are located in areas where there is groundwater overabstraction (EEA 1995). Groundwater overexploitation is also evident in many Asian cities. Bangkok, Manila, Tianjin, Beijing, Chennai (formerly Madras), Shanghai, and Xian all have registered a decline in water table levels of 10–50 meters (Foster et al. 1998). These high levels of abstraction in many cases are accompanied by water quality degradation and land subsidence. For instance, the aquifer that supplies much of Mexico City had fallen by 10 meters as of 1992, with a consequent land subsidence of up to 9 meters (Foster et al. 1998).
Overabstraction is also an increasing problem with tourism-associated development, particularly in coastal areas. Groundwater overabstraction in such areas can reverse the natural flow of groundwater into the ocean, causing saltwater to intrude into inland aquifers. Because of the high marine salt content, even low concentrations of seawater in an aquifer are enough to make groundwater supplies unfit for human consumption (Scheidleder et al. 1999). Of 126 groundwater areas in Europe for which status was reported, 53 showed saltwater intrusion, mostly of aquifers used for public and industrial water supply (Scheidleder et al. 1999).
Unfortunately, the poor, mostly migrant workers from rural areas suffer most from reduced quality or quantity of water supply when they resettle to large cities. Poor residents of cities tend to concentrate in the outskirts, where safe drinking water and sanitation are less available, and they often depend on contaminated sources of water or intermediate water vendors who charge exorbitant prices.
In the context of these many problems, an emerging trend toward protecting water supplies for urban areas is noteworthy. A study of more than 100 of the world’s largest cities, for example, found that more than 40% rely on runoff-producing areas that are fully or partially protected (Dudley and Stolton 2003). This reflects a growing recognition of the value of ecosystem services linked to sound watershed management approaches, as well as of the limits placed on urban water supply from polluted upstream source areas (UN-HABITAT 2003). The geography of downstream populations supported by upstream runoff-producing areas suggests the potential global importance of this management strategy. This is further demonstrated by Table 7.2, with data showing billions of people living downstream of particular MA ecosystems and their renewable freshwater flows.
7.3.6 Industrial Development
Industrial processes, which include withdrawals for manufacturing and thermoelectric cooling, today use about 20% of the total freshwater withdrawals, which has more than doubled between 1960 and 2000 (Shiklomanov and Rodda 2003). Even though this global use remains small in comparison to water used for agriculture, the current trend in shifting the manufacturing base from industrial to developing countries, due to globalization and international trade, is of concern for future water security. Much of the technology developed for industry is adapted to industrial nations, which are generally considerably more water-rich. When industrial plants are relocated to developing countries, many of which are water-poor or have limited water delivery services, these operations add pressure to the water resource base and increase conflict among water users. In addition, the environmental safeguards for effluent treatment are less well established or enforced in developing nations, adding to the scarcity problems by increasing pollution.
The most polluting industries, in terms of organic water pollutants, are those whose products are based on organic raw materials, such as food and beverage, paper and pulp, and textile plants (UN/WWAP 2003). Power station electric generation is the largest source of thermal water pollution. Estimates correlating water withdrawals for industrial use with population density by river basin show that many already water-stressed river basins are also centers for industrial production, such as in eastern China, India, and parts of Europe (UN/WWAP 2003).
Industrial emissions are released not only as thermal and chemical effluents into rivers and streams but also as gases and aerosols into the atmosphere. These can be transported for large distances and may end up deposited in other water bodies far from the emission source. Large areas of the continents show atmospheric deposition as the single most important source of nitrogen loading, with concomitant increases in pollutant transport through inland waterways (Green et al. 2004).
7.4 Consequences for Human Well-being of Changes in the Provision of Fresh Water
Water is essential for human well-being, but not all parts of the world receive the same amount or timing of available water supplies. Some areas contain abundant water throughout the year, others have seasonal floods and droughts, and still others have hardly any water at all. In river basins with high water demand relative to the available supply, water scarcity is a growing problem, as is water pollution. Water availability is already one of the major challenges facing human society, and the lack of water will be one of the key factors limiting development (WMO 1997; UN/WWAP 2003). The socioeconomic implications of delivering, using, managing, or buying water also have impacts on human well-being. This section begins with a brief overview of the benefits and required investments for water resource systems; examines the implications of freshwater scarcity, including treatment of pricing and equity issues; and concludes with descriptions of the consequences of too much water (flooding) and the connections between freshwater services and human health.
7.4.1 Freshwater Provision: Benefits and Investment Requirements
Over the long term, water use has generally increased geometrically, in line with population (Population growth rate) growth, increased food production, and economic development (L’vovich and White 1990), and during the last 40 years, there has been a doubling in the water used by society—from 1,800 to 3,600 cubic kilometers a year. In an aggregate sense, water is a required input generating value-added in all sectors of the economy, and trends in its use can be assessed from its ability to yield economic productivity. In the United States, for example, water productivity measured as GDP per cubic meter of freshwater use rose dramatically between 1960 and 2000 by about 25% per decade, to $18 per cubic meter (Postel and Vickers 2004), in response to shifts in regulation, technology, and restructuring of the economy.
Water provided for irrigation has a particularly important role, being responsible for 40% of global crop production (UN/ WWAP 2003). And despite major challenges in conveying adequate drinking water and sanitation, more than 5 billion people are routinely provided with clean water and more than 3.5 billion have access to sanitation (WHO/UNICEF 2004). Further, with continued investments in water infrastructure, much of the world’s population has benefited from allied improvements in public health, flood control, electrification, food security through irrigation, and associated economic development. From this standpoint, well-managed water resources have helped promote economic development, which is tied closely to improvements in many aspects of human well-being.
A good example is provided by a recent analysis (Hutton and Haller 2004) of the cost-effectiveness of different options to achieve MDG 7 (on access to safe water and basic sanitation). Of five scenarios tested, two considered Target 10—halving the proportion of people without sustainable access to safe water by 2015 and halving the proportion of people without sustainable access to improved sanitation. It was shown that for each dollar invested in both improved water supply and sanitation, a return of $3–34 can be expected. Among the health benefits of achieving the MDG drinking water target was a global reduction in diarrheal episodes of 10%. The economic benefits of simultaneously meeting the drinking water and sanitation MDG targets on households and the health sector amount to $84 billion per year, representing reduced health care costs, value of days gained from reduced illness, averted deaths, and time savings from proximity to drinking water and sanitation facilities for productive endeavor.
Because of the variability of the water cycle, economic benefits often accrue only after substantial investments in infrastructure and operations that stabilize and improve the reliability of water resources. Capital investments in water infrastructure totaled $400 billion in the United States over the last century (Rogers 1993). When the annual investment in water storage for irrigation globally during the 1990s of about $15 billion (WCD 2000) is tabulated, an important source of required capital can be seen, which can constitute a major fraction of agricultural investment for many developing countries (UN/WWAP 2003).
Worldwide, investments in dams have totaled $2 trillion (WCD 2000). World Bank lending for irrigation and drainage averaged about $1.5 billion per year from 1960 to 2000, although this continues to decrease from a peak of $2.5 billion in 1975 to its current rate of $500 million (Thompson 2001). Global costs for expanding irrigation facilities are estimated at $5 billion annually, but rehabilitation and modernization costs on existing irrigation works are estimated at an additional $10 billion or more per year (UN/WWAP 2003). Although projected funding for economic development and meeting the MDGs for the entire water sector is estimated to reach $111–180 billion a year, current investments in sanitation and water supply total from $10 billion to $30 billion annually (UN/WWAP 2003). Securing water resources is thus deeply embedded within development investment and planning but incompletely resolved. The private sector, with global revenues today standing at $300 billion annually (Gleick et al. 2002a), is a major player in providing potential investments, as described later.
7.4.2 Consequences of Water Scarcity
With population (Population growth rate) growth and the overexploitation and contamination of water resources, the gap between available water supply and water demand is increasing in many parts of the world. In areas where water supply is already limited, water scarcity is likely to be the most serious constraint on development, particularly in drought-prone areas. Earlier in this chapter we provided a quantification of water scarcity in physical terms. Here scarcity is mapped to issues relating directly to human well-being.
While decreased or variable water supply has sometimes presented itself as an opportunity to develop efficiency-enhancing responses (Wolff and Gleick 2002) and cooperation (Wolf et al. 1999; UN/WWAP 2003), more often it has spawned numerous development challenges, including increased levels of competition for water among people and between people and ecosystems; the use of non-sustainable supplies or development of costly alternatives; limits to economic growth, including curtailment of activities and required importation of food and other water-intensive commodities; pollution and public health problems; potential political and civil instability (Furlong and Gleditsch 2003; Miguel et al. 2004); and international disputes in transboundary river basins (Gleick 1998). These situations arise in part because society has typically managed ecosystems for one dominant service such as timber or hydropower without fully realizing the trade-offs being made in such management. This approach has led to the documented decline in freshwater (Freshwater biomes) ecosystem condition, with accompanying consequences for human well-being. The poor, whose livelihoods often depend most directly on ecosystem services, suffer most when ecosystems are degraded. (See Chapter 6.)
One of the problems thus far has been the difficulty of relating ecosystem condition to human well-being, particularly from the socioeconomic perspective. An emphasis on water supply, by developing more dams and reservoirs, coupled with weak enforcement of regulations, thus has limited the effectiveness of water resource management, particularly in developing regions of the world (Revenga and Cassar 2002).
As a consequence, policy-makers are now shifting from entirely supply-based solutions to demand management, highlighting the importance of using a combination of measures to ensure adequate supplies of water for different sectors, and slowly moving toward an integrated approach to water resources management (Schulze 2004) that is now linked directly to development initiatives (GWP 2000; UN-HABITAT 2003; Kakabadse- Navarro et al. 2004). Measures include improving water use efficiency, pricing policies, preservation of environmental flows, market incentives, privatization of water delivery, and public-private partnerships among others. (See MA Policy Responses, Chapter 7, for more on response measures in integrated water resource management.)
Human society has relied for decades on economic and social indicators for planning, but in virtually complete isolation of measures depicting the state and trends of ecosystem services. This section presents some of the latest findings relating water as an ecosystem service through social and economic indicators.
The need for integrated indicators or indices at the national or regional scale to help donors and decision-makers establish priorities in water resource management is widely acknowledged. Such metrics can also assist in [[monitor (Environmental monitoring and assessment)]ing (Environmental monitoring and assessment)] progress toward sustainable Development goals in a systematic manner. Many such tools have been proposed over the last several decades. For example, the Water Stress Index was developed in the 1970s to link population to water resources (Falkenmark 1997), and various other indices have been proposed, such as the Stockholm Environment Institute’s Water Resources Vulnerability Index (Gleick et al. 2002b). New water scarcity indices capitalizing on geospatial data sets and high-resolution digital representations of river networks can define the climatic and hydrological sources of water-related stress (Vörösmarty et al. 2005).
One important indicator that combines physical, environmental, economic, and social information related to water availability and use is the Water Poverty Index. The WPI is similar to the Human Development Index but applicable to a more local scale, where the impacts of water scarcity are fundamentally expressed. It measures water stress at the household and community level and was designed to ‘‘aid national decision makers, at community and central government level, as well as donor agencies, to determine priority needs for intervention in the water sector’’ (Sullivan et al. 2003).
The WPI reflects an attempt to quantify inequities in water allocation and the inability of the poor to govern access to water. It has five key components, each based on a series of input variables that are weighed and aggregated into the overall index. When an element cannot be measured, proxy indicators are used in its place. The WPI relies in part on standardized data collected for other purposes, and thus can be used in comparative analysis of water stress across countries. For instance, to provide inputs on water management capacity the index uses Log GDP per capita, under-5 mortality rates, and a UNDP education index, all used previously in constructing the HDI. The five components of the WPI and some of its key variables are:
- ?Water resources: The physical characteristics of water availability and water quality. This component includes total water availability, its variability across time (seasonality), and its quality.
- ?Access to water: This includes not only the distance to water from dwellings but, more important, the time spent in collecting water, conflicts over water use, and access to sanitation.
- ?Water use: This represents withdrawals for domestic, agricultural, and industrial purposes. In many parts of the world, small-scale irrigation and livestock are key components of livelihood strategies and thus are tabulated as inputs.
- ?Capacity to manage water: This component is measured in terms of income, education level, membership in water users associations, and the burden of illness due to contaminated water.
- ?Environmental integrity: If the ecosystems that support water delivery are degraded, then provision of water per se plus the many services derived from freshwater systems will be jeopardized. This component evaluates the integrity of freshwater (Freshwater biomes) ecosystems based on the use of natural resources, crop losses reported in the previous five years, and household reports of land erosion. Overall, no variables of the actual condition of aquatic ecosystems are included, suggesting a component of the index that could benefit from revision.
The WPI has been tested internationally in 140 countries as well as at the local scale in South Africa, Tanzania, and Sri Lanka. Finland and Iceland were found to score the best, while Haiti and Ethiopia fared worst (Lawrence et al. 2003). The results of the local pilot analysis look promising, but the WPI would benefit from a better incorporation of ecosystem condition and capacity measures. Nevertheless, the WPI is a vehicle for understanding the complex relationship between water services and human well-being. Moreover, as the authors state, it constitutes ‘‘a systematic approach that is open and transparent to all’’ (Sullivan et al. 2003), allowing incremental improvements to the index to be made through community consensus.
There are also important gender-related issues associated with water poverty. Women and men usually have different roles in water and sanitation activities, and these differences are pronounced in rural areas across the developing world (Brismar 1997; UN/WWAP 2003). Women are most often the users, providers, and managers of water in rural households and the guardians of household hygiene. In many parts of the world, women and girls can spend several hours a day carrying heavy water containers, suffering acute physical problems as a result (WEDO 2004). The inordinate burden of acquiring water also inhibits women’s and girls’ opportunities to secure an education and contribute to family income (WEDO 2004).
7.4.3 The Cost and Pricing of Water Delivery
Water users in most countries are generally charged but a small fraction of the actual cost of water abstraction, delivery, disposal, and treatment (Briscoe 1999; WHO/UNICEF 2000; Walker et al. 2000), and in some countries implicit and explicit water subsidies can reach up to 93% (Pagiola et al. 2002). Moreover, externalities associated with freshwater use, such as salinization of soils, degradation of ecosystems, and pollution of waterways, have been almost universally ignored, promoting current inefficiencies in use and threats to freshwater ecosystems. In general, those with access to abundant or underpriced water use it in a wasteful manner, while many, usually the poor, still lack sufficient access to water resources.
When water is in short supply or when it is polluted or unsafe to drink, the expense of delivering water services can rise dramatically or force curtailment in use. As scarcity increases, the cost of developing new freshwater resources also reflects the need to secure water from sources sometimes at great distances from the eventual user, often involving complex hydrological engineering (Hirji 1998; Rosegrant et al. 2002). Until recently there were few incentives in most countries to use water efficiently. However, increasing costs of water supply, dwindling supplies, and losses of aquatic habitat and biodiversity are increasingly providing incentives to value water as an economic good. In most countries, governments bear the burden of water delivery to users, but maintaining necessary infrastructure and expanding it to reach unserved users or improve the efficiency of water delivery is the exception rather than the norm (Pagiola et al. 2002). Inadequate funding results in a lack of new connections and unreliable service, with serious consequences for the poor, who usually incur higher costs when forced to obtain water from alternative sources (Pagiola et al. 2002).
Water can be priced in a number of different ways, and the past decade has shown the increasing application of several common methods, including flat fees, fixed fees plus volumetric charges, decreasing block rates, and increasing block rates. Some of these measures discourage waste, while others lead to overuse. (See MA Policy Responses, Chapter 7). This section surveys recent trends in the price and cost of water, reviews cost-recovery strategies, and assesses the impact on human well-being of privatization and public-private partnerships that deliver freshwater services.
7.4.3.1 The Price of Water and Recent Trends
There are enormous disparities in the price of fresh water supplied to end-users, reflecting a complex interplay among several factors, including proximity to natural sources of sufficient quantity and quality, level of economic development, investments—both public and private—in water infrastructure, and governance. A survey of urban households across the developing world showed water costs from both public and private sources varying by a factor of 10,000, from $0.00001 per liter (for piped supply in Calcutta) to as high as $0.1 per liter (through private water vendors) (UNHABITAT 2003). Even municipal supplies can constitute a substantial fraction of monthly family expenditure—for example, up to 20% in informal settlements in Namibia (UN-HABITAT 2003). An analysis of urban areas in Asia showed that prices charged by informal water vendors are more than 100 times that from domestic connections (ADB 2001). In Benin, Burkina Faso, Kenya, Mauritania, and Uganda, household connection fees to piped water supplies exceeded per capita GDP by factors of up to 5:1, rendering these unaffordable (Collignon and Vezina 2000).
Cities also have seen a marked increase in the cost of financing new water supplies. In Amman, Jordan, during the 1980s groundwater sources were used to meet water needs at an incremental cost of $0.41 per cubic meter. As groundwater supplies declined, the city began to rely on surface water pumped from a site 40 kilometers away at an average incremental cost of $1.33 per cubic meter (Rosegrant et al. 2002). In another example, the real cost of water supply for irrigation in Pakistan more than doubled between 1980 and 1990 (Dinar and Subramanian 1997).
In Algeria, drought during 2000–02 forced cuts in the provision of water supply from municipal networks (access restricted to several hours every two to four days), despite large investments in water supply networks by the Algerian government since 1962 (UN-HABITAT 2003). The situation was further exacerbated by lack of maintenance of the network, with water losses through leaking pipes and underpricing of the resource use. Today, price increases and a major facilities upgrade are under way. Many African cities have exhausted and polluted local groundwater supplies, necessitating expensive transport of fresh water from distant suppliers (200 kilometers in the case of Dakar, Senegal) (UNHABITAT 2003) or the need to invest in desalination, which is among the costliest methods of supplying fresh water (Gleick 2000; UN/WWAP 2003).
In addition to direct prices paid, additional costs are incurred by the poor provision of water services. Time spent in traveling to supplies, queuing, and transporting water can be a significant burden on household incomes for the poor. Compared with the late 1960s, households without piped water supply in Kenya, Uganda, and Tanzania today spend triple the time each day securing water, an average of over 90 minutes (UN-HABITAT 2003). Public taps are often in short supply, as in many Asian cities, where several hundred people are served by a single source (Mc- Intosh and Yñinguez 1997). Further, the true costs associated with water delivery services are amplified by significant health burdens incurred when supplies are insufficient to meet basic needs. In the case of Lima, Peru, a major portion of household income (27%) is represented by medical costs and lost wages from water-related disease (Alcazar et al. 2000), while in Khulna, Bangladesh, an average of 10 labor days per month are lost due illness from poor water provision (Pryer 1993).
7.4.3.2 Cost Recovery
The fourth guiding principle of the Dublin Statement on Development Issues for the 21st Century (ICWE 1992) articulated that ‘‘water has an economic value’’ and ‘‘should be recognized as an economic good.’’ At the same time, the statement argued that water should be available to all people at affordable prices. After much discussion and controversy, which continues to this day, the Ministerial Declaration from the 2nd World Water Forum (2002) established that ‘‘the economic value of water should be recognized and fully reflected in national policies and strategies by 2005’’ and that ‘‘mechanisms should be established by 2015 to facilitate the full cost pricing for water services, while the needs of the poor are guaranteed.’’
Supporters of full-cost water pricing argue that to improve efficiency, the set price of water needs to reflect the cost of supplying, distributing, and treating it. There is some evidence that this principle works. For instance, price increases for water in Bogor, Indonesia, reduced domestic consumption by 30% (Rosegrant et al. 1995). Proponents of full-cost water pricing also point out that most of the poor are not meeting their basic water needs today under current public management, usually because of lack of government capacity and resources. Consequently, poor communities are already paying higher prices through intermediate water vendors than if they were connected to a water delivery system.
But while pricing water to reflect its true cost is relatively simple in theory, the political and social obstacles are formidable. Opponents to the idea of full-cost water pricing claim that access to water is a fundamental human right. Water, like air, should therefore not be treated as an exchangeable, marketable commodity, because if market conditions rule, access to water becomes dependent on the ability to pay and not an inherent entitlement. In the eyes of many, establishing a price for water or privatizing its delivery puts many of the poorest, most marginalized people at risk of not getting enough water to meet basic needs.
The majority of OECD countries have adopted or are adopting, as an operating principle, the full-cost recovery concept in water management, although what should be covered under this ‘‘full cost’’ is still a matter of debate. Infrastructure costs, however, are not usually included (UN/WWAP 2003). As pricing was restructured and subsidies reduced during the 1990s and in the current decade in industrial countries to capture the full-cost recovery of water, the real price of water was increasing in 18 out of 19 countries surveyed (Australia being the only exception). In two thirds of OECD countries, over 90% of single-family homes are currently metered (OECD 1999).
The concept of full-cost water pricing in the developing World has been introduced with the support of local communities in situations where a more reliable service is assured. In Haiti, for example, shantytown residents with no connection to the water utility pay 10 times more for water from water vendors (water trucks) than those who are connected to the private water utility grid in nearby villages (Constance 1999). Residents connected to the grid have their water use metered and pay the corresponding fees.
7.4.3.3 Water Privatization
One of the most controversial trends in today’s globalized economy is the increasing privatization of some water management and delivery services. In many countries, due to increasing costs of maintaining and expanding water networks and overstretched government budgets, private companies have been invited to take over some of the management and operations of public water systems. Private-sector investment in theory results in more financing for infrastructure as well as more-efficient operations and cost recovery, and the hope is that the public will benefit from a more stable and reliable water delivery system at a reasonable price.
Opponents to privatizing water services argue that putting private companies in charge of water will drive prices to the point that marginalized groups have no capacity to secure sufficient water even for their most basic of needs. In addition, because the profit motive fails to recognize environmental externalities, they argue that privatization will increase risk to the very ecosystems that help supply fresh water. The debate on public-private partnerships for water management was prominent on the agenda of the World Water Forum gatherings (in particular, at the 2nd Forum in The Hague and the 3rd Forum in Kyoto), as well as at the World Summit on Sustainable Development.
Despite trends toward privatization, at present over 80% of the world’s investments in water, sanitation, and hydropower systems are by publicly owned bodies or international donors (Winpenny 2003). Therefore, the responsibility for providing water, over the short to medium term, will remain largely a public enterprise. Among industrial countries, there is much variation in the degree of privatization. In the United States in 2000, private companies provided only 15% of municipal water supply, although in the nineteenth century they provided nearly 95% (Gleick et al. 2002a). France, in contrast, shows more than half of all residents currently served by private companies (Gleick et al. 2002a).
In Latin America, Chile has been successful at delivering water through privatization, and nearly all houses in Santiago have access to clean water and sanitation. Despite exchange-rate fluctuations, a foreign company, Suez, has remained the water provider for Santiago and its region, investing over $1 billion in water infrastructure. Water in Chile has been priced at rates affordable by the middle classes, and stamps are given to poor people to guarantee near-universal access. Conversely, in Argentina, what looked like a positive trend did not withstand economic troubles. In 1993 privatization in Buenos Aires increased the share of residents served with water from 70% to 85%—an increase of 1.6 million people, with a concurrent drop in prices (Peet 2003). Exchange-rate fluctuations in many developing countries, such as the currency devaluation in Argentina in 2002, add challenges to successful implementation of privatization schemes. If the currency of a country devalues, the price paid for water will be worth much less, and the foreign firm could pull out of the market, leaving users without reliable service (Peet 2003).
South Africa is using a different pricing scheme to improve poor people’s access to water and has made good progress in providing water to nearly two thirds of those who lacked access in 1994, when apartheid officially ended. Despite the relatively low cost of water, however, some rural residents opted to consume free—but contaminated—water from other sources. In February 2000, to improve public health for the poor, the government introduced a scheme to provide households with 6,000 free liters of water per month, enough to provide 25 liters per person per day, with charges for additional use.
Privatization can be executed in many ways, depending on the level of transfer from public to private hands. Full transfer of ownership and operations of water resource systems so far has been rare. The majority of cases embody the transfer of certain operational aspects, such as water delivery, but the ownership of the water resources usually remains with the state, thereby forming a public-private partnership.
These partnerships have been demonstrated over the last few years to capture the benefits of privatization without all of the risk (Blokland et al. 1999). They do not privatize all of the water assets, but they do give private actors control over some elements of the water rights, infrastructure, and distribution systems. Yet public entities typically maintain ownership over some or all of these systems. Public-private partnerships work best when strong regulatory controls exist. A typical arrangement in France, for example, delegates the operation, maintenance, and development of public potable water and sanitation to private companies, though public bodies retain ownership of the system (Barraque et al. 1994; Gleick et al. 2002c).
Experience has shown that a clear legal framework, where risks are decreased and the cost of capital decreases, would be necessary to enlist private-sector involvement (Winpenny 2003). More detailed analysis of privatization as a response option for the sustainable management of water resources and freshwater (Freshwater biomes) ecosystems is presented in Chapter 7 of the MA Policy Responses volume.
7.4.4 Consequences of Too Much Water: Floods
In addition to water scarcity, the accumulation of too much water in too little time in a specific area can be devastating to populations and national economies. (See Chapter 16.) According to the latest World Disasters Report (IFRC/RCS 2003), on average 140 million people are affected by floods each year, more than all other natural or technological disasters put together. Between 1990 and 1999, there were over 100,000 people reportedly killed by floods. The majority of these deaths were in Asia (56,000), followed by the Americas (35,000), Africa (9,000), and Europe (3,000) (IFRC/RCS 2000).
In addition to human lives, floods are a costly natural hazard in monetary terms, with more than $244 billion damage from 1990 to 1999, the most of any single class of natural hazard (IFRC/RCS 2000). Although this arises from potential changes in climate variability and extreme weather, humans also play an important role, settling and expanding into vulnerable areas (Kunkel et al. 1999; van der Wink et al. 1998).
While catastrophic flooding has negatively affected society for thousands of years, naturally occurring floods also provide benefits to humans through maintenance of ecosystem functioning such as sediment and nutrient inputs to renew soil fertility in floodplains, providing floodwaters to fish spawning and breeding sites and helping to define the dynamics to which coastal ecosystems are adapted. Although floods are primarily natural events, human activity influences their frequency and severity. By converting natural landscapes to urban centers, deforesting hillsides, and draining wetlands, humans reduce the capacity of ecosystems and soils to absorb excess water and to evaporate or transpire water back into the atmosphere, creating conditions that promote increased runoff and flooding.
There are, then, potentially costly consequences of upstream anthropogenic activities on hydrological function that place downstream populations at risk, sometimes affecting other nations, as in the case of more than 250 international river basins (Wolf et al. 1999). Douglas et al. (2005) reported on a simulation study suggesting that, in aggregate, a 32% conversion of forests to agriculture across the pan-tropics has led to a mean increase in annual basin yields of approximately 10%, with a concomitant rise in seasonal high flows. More than 800 million people live along floodplains in river basins containing some amount of tropical forest, and if the most threatened of the existing forests are converted to agriculture in the future, approximately 80 million of them could be at risk from the hydrologic impacts associated with these land conversions. Costa et al. (2003) present empirical evidence that large-scale savanna clearance in the Tocantins basin in Brazil (175,000 square kilometers) has been associated with increases of 24% in mean annual and 28% in wet season flows, independent of climate variations.
Nevertheless, there is some agreement that the most catastrophic floods in large basins result from storms so large and persistent that peak flows are unaffected by land cover (Calder 1999; Bruijnzeel 2004). Further, the proclivities of particular regions to landslides, soil erosion, and debris flows, as in the Himalayas, constitute the dominant source of risk (Gilmour et al. 1987; Hamilton 1987; Gardner 2002). Thus the costs and benefits of designing interventions to mitigate floods have their limits, and there may be little opportunity to escape potential vulnerabilities to flooding, given current patterns of human settlement in high-risk areas.
These findings should not suggest abandonment of good land stewardship, which yields fundamental benefits in sustaining ecosystem services. But they do argue for clearly identifying the source areas of hazard and designing response strategies to protect life and property. Even when specific and well-established policy goals for watershed protection are formulated, stakeholder interests and sustainable funding issues add to the challenge of designing effective upstream-downstream management strategies (Pagiola 2002).
Further information on the impact of natural hazards, including floods, on human well-being can be found in Chapter 16.
7.4.5 Consequences of Poor Water Quality on Human Health
Water is an essential resource for sustaining human health, and there is a basic per capita daily water requirement of 20 to 40 liters of water free from harmful contaminants and pathogens for the purposes of drinking and sanitation, which rises to 50 liters when bathing and kitchen needs are considered (Gleick 1996, 1998, 1999). Yet billions of people lack the services to meet this need, as documented earlier. Water-related diseases include four major classes: waterborne, water-washed, water-based, and water-related vector-borne infections (Bradley 1977). Threats to health also arise from chemical pollution.
7.4.5.1 Water-Related Diseases
As a whole, water-related diseases are a leading cause of morbidity and mortality in many parts of the developing world, with estimates ranging from 2 million to 12 million deaths per year (Gleick 2002), although [[monitor (Environmental monitoring and assessment)]ing (Environmental monitoring and assessment)] and reporting remain poor in many countries. (See Table 7.10.) UN/WWAP (2003) reports 3.2 million deaths each year from water-related infectious disease, or about 6% of all deaths. The lack of access to safe water and to basic sanitary conditions also translates into the annual loss of 1.7 million lives and at least 50 million disability-adjusted life years. (The DALY is a summary measure of population health, calculated as the sum of years lost due to premature mortality and the healthy years lost due to disability for incident cases of the ill health condition. The DALY is not only an effectiveness indicator in the economic evaluation of different intervention options but also a reflection of the impact of ill health on the income-generating capacity of the poor.)
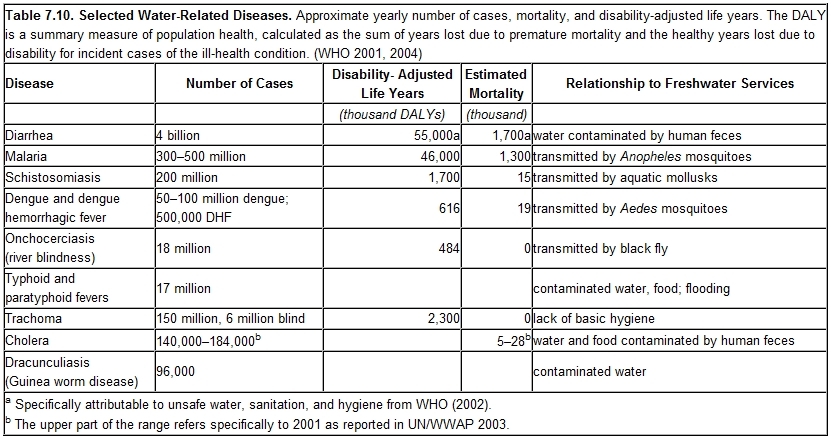
The first three categories of water-related diseases are most clearly associated with lack of access to improved sources of drinking water, and in turn to ecosystem condition. Improved sanitation through the safe disposal of human waste is a major development objective that improves the health of those served directly by separating drinking water from wastewater. In developing countries, however, 90–95% of all sewage and 70% of industrial wastes are dumped untreated into surface waters (UNFPA 2001), placing both downstream populations as well as ecosystem functions at risk. (See Chapter 15.) The fourth category of water-related disease is associated with ecological conditions that favor disease vector breeding. These may be natural (such as those supporting malaria transmission by Anopheles gambiae mosquito across large parts of Africa south of the Sahara) or anthropogenic, through improperly planned irrigation systems, dams, and urban water systems. (See Chapter 14.)
Waterborne diseases are caused by consumption of water contaminated by human or animal waste and containing pathogenic parasites, bacteria, or viruses. They include the diverse group of diarrheal diseases as well as cholera, typhoid, and amoebic dysentery. These diseases occur where there is a lack of access to safe drinking water for basic hygiene, and most could be prevented by treating water before use. The World Health Organization estimates that there are 4 billion cases of diarrhea each year in addition to millions of other cases of illness associated with lack of access to safe water (WHO/UNICEF 2000). This translates into 1.7 million deaths per year, mostly among children under the age of five (WHO 2004). Morbidity and mortality from microbial contamination are orders of magnitude greater in developing countries than in the industrial world.
Water-washed diseases are caused by poor personal hygiene and skin or eye contact with contaminated water; their incidence is associated with the lack of access to basic sanitation and sufficient water for effective hygiene (Bradley 1977; Gleick 2002; Jensen et al. 2004). These include scabies, trachoma, and flea, lice, and tick-borne diseases. Trachoma alone is estimated to cause blindness in 6 million people (WHO/UNICEF 2000). In addition, the transmission of intestinal helminths (Ascaris, Trichuris, and hookworm) is linked to a lack of sanitation facilities and is estimated to account for a global annual loss of over 2 million DALYs.
Water-based diseases are those caused by aquatic organisms that spend part of their life cycle in the water and another part as parasites of animals. As parasites, they usually take the form of worms, using intermediate animal vectors such as snails to thrive, and then directly infecting humans either by boring through the skin or by being swallowed. They include Guinea worm infection, schistosomiasis (bilharzia), and a few other helminths (certain liver flukes of local importance in Southeast Asia, for instance, such as Opisthorchis viverrini) that infect humans through either direct contact with contaminated water or the consumption of uncooked aquatic organisms.
Although these diseases are not usually fatal, they prevent people from living normal lives and impair their ability to work. For instance, 200 million people worldwide are infected with schistosomiasis, of which 20 million suffer severe consequences, with an estimated global annual burden of 1.7 million DALYs (WHO 2004). The prevalence of water-based diseases often increases where dams are constructed, because stagnant water is the preferred habitat for aquatic snails, their most important intermediary hosts. For instance, the Akosombo Dam in Ghana, the Aswan High Dam on the Nile in Egypt, and the Diamma Dam at the mouth of the Senegal river have resulted in huge increases of local schistosomiasis prevalence. (See also Chapter 14.)
Water-related vector-borne diseases are caused by parasites that require a vector (such as insects) to develop and transmit the disease to humans. For example, Anopheles mosquitoes are the vectors for a protozoan parasite (Plasmodium) that causes malaria. These diseases are strongly ecosystem-linked, in contrast to the other three categories of water-related diseases, where water quality (and to some extent quantity) is the key determinant. Their distribution reflects the distribution of ecosystems suited to the propagation of the vectors.
Vector species, moreover, are highly diverse, so that detailed ecological requirements differ over wide ranges. Anopheline mosquitoes—vectors of malaria (1.3 million deaths a year and an annual burden of over 46 million DALYs), for example—breed in different types of freshwater (Freshwater biomes) ecosystems and brackish water coastal lagoons. Aedes, vectors of dengue and yellow fever, originally breeding in leaf axils of bromeliads, are cosmopolitan in human settlement areas, where they breed in small water pools. Urban filariasis vectors (Culex ssp.) breed in organically polluted water. And the blackfly vectors of onchocerciasis breed in oxygenated waters of rapids.
These vector-borne diseases are not typically associated with lack of access to safe drinking water but rather with water management practices in tropical and sub-tropical regions of the world. Several parasitic diseases endemic of tropical regions, such as Rift Valley Fever and Japanese encephalitis, spread easily with the presence of reservoirs, irrigation ditches and canals, and rice fields (WCD 2000). (See Chapter 14.) In all, more than 30 diseases have been linked to irrigation and paddy agriculture (WRI et al. 1998). Consequently, improved water management, drainage, and storage practices can help reduce the transmission risk, particularly in areas where anthropogenic conditions have led to the introduction of these diseases.
7.4.5.2 Chemical Pollution
Another set of diseases affecting industrial and developing nations alike arises in response to chemical pollution of water by heavy metals, toxic substances, and long-lived synthetic compounds. While evidence of the long-term impacts of chemical pollution can be detected even in the remote Arctic (AMAP 2002), the impacts on poor populations in developing countries are difficult to identify, given the lack of reliable and comprehensive records. However, exposure to chemical agents in water has been related to a range of chronic diseases, including cancer, lung damage, and birth defects. Many such diseases develop over several years, making the links between cause and effect difficult to establish. On a global scale, the burden of disease from chemical pollution is much lower than from microbial contamination and parasitic diseases, but in some highly polluted regions these risks can be substantial (WRI et al. 1998). Exposure to chemical pollutants can also compromise the immune system, rendering people more susceptible to microbial and viral infections. The cumulative and synergetic effects of long-term exposure to a variety of chemicals, especially at low concentrations, cannot be well quantified at present.
Naturally occurring inorganic pollutants constitute a class of chemical pollution with serious long-term health effects. Arsenic, which occurs naturally in some soils, for example, can become toxic when exposed to the atmosphere, as seen in areas with high water abstraction from underground [[aquifer]s] (WRI et al. 1998). Arsenicosis is the result of arsenic poisoning from drinking arsenic-rich water over long periods of time and is a great concern in many countries, including Argentina, Bangladesh, China, India, Mexico, Thailand, and the United States (Bonvallot 2003). WHO estimated in 2001 that in Bangladesh alone, 35–77 million people— close to half the population—were exposed to drinking water from deep wells contaminated with high levels of arsenic (5–50 times the limit of 0.01 milligrams per liter recommended by WHO) (Bonvallot 2003). Arsenic is a carcinogen linked to skin, lung, and kidney cancer, although these diseases can go undetected for decades (WRI et al. 1998). In other parts of the world, high fluoride concentrations in drinking water have resulted in long-term effects that weaken the skeleton.
Chronic effects also arise from anthropogenic pollutants such as discharge from mining operations, pesticide runoff, and industrial sources. Long-term lead poisoning from old water pipes, for example, can cause significant neurological impairment (WRI et al. 1998). Mercury contamination can also originate from industrial discharge and runoff from mining activities, accumulating in animal tissue, particularly fish (WCD 2000).
Nutrient runoff is another concern from the standpoint of human health, especially in light of pandemic increase in loadings to inland water ecosystems, for example, of nitrogen (described earlier; see also Chapters 12 and 20). Although there is no global assessment of how many water bodies exceed the WHO guidelines on nitrate levels, most countries report that nitrates are one of the most common contaminants found in drinking water (WRI et al. 1998). Coastal and inland waters in regions with high levels of eutrophication have been observed to often propagate toxic algal blooms (toxic cyanobacteria) that can cause chronic disease. (See Chapter 19.) In China, for instance, the presence of cyanobacterial toxins in drinking water has been associated with elevated levels of liver cancer (WCD 2000). Excess nitrate in drinking water has also been linked to methaemoglobin anemia in infants, the ‘‘blue baby’’ syndrome (WRI et al. 1998).
Discharge from aquaculture facilities can also be loaded with pollutants, including high levels of nutrients from uneaten fish feed and fish waste, antibiotic drugs, and other chemicals, including disinfectants such as chlorine and formaline, antifoulants such as tributyltin, and inorganic fertilizers such as ammonium phosphate and urea (GESAMP 1997). These chemicals can significantly degrade the surrounding environment, particularly local waterways (GLFC 1999). The use of antibiotics and other synthetic drugs in aquaculture can also have serious health effects on people and ecosystems more broadly. The antibiotic chloramphenicol, for example, can cause human aplastic anaemia, a serious blood disorder that is usually fatal. While many countries have banned the use of chloramphenicol in food production, the level of enforcement varies considerably (GESAMP 1997; Health Canada 2004). A further risk from antibiotic use is the spread of antibiotic resistance in both human and fish pathogens. The U.S. Center for Disease Control and Prevention reported that certain antibiotic resistance genes in Salmonella might have emerged following antibiotic use in Asian aquaculture (Angulo 1999 as cited in Goldburg et al. 2001).
There is also evidence from studies on wildlife that humans may be at risk from persistent organic pollutants and residual material that has the ability to mimic or block the natural functioning of hormones, interfering with natural physiological processes, including normal sexual development (WRI et al. 1998). Certain chemicals such as PCBs, DDT, dioxins, and at least 80 pesticides are regarded as ‘‘endocrine disrupters,’’ chemicals that may interfere with normal human physiology, undermining disease resistance and affecting reproductive health (WRI et al. 1998).
Finally, pharmaceutical products excreted by livestock or humans comprise a set of ‘‘emerging contaminants,’’ whose impacts on human well-being, ecosystems, and species are not yet understood. These contaminants are hard to detect with current technologies, but their impact on wildlife are already observed in some parts of the world. In the United States, the first nationwide survey conducted in 1999 and 2000 found hormones in 37% of the streams surveyed and caffeine in more than half (Kolpin et al. 2002). Just recently, 42% of the sampled male bass in a relatively pristine stretch of the Potomac River in the United States were found to be producing eggs. The exact cause is still unknown, but it is hypothesized that it could be caused by chicken estrogen left over in poultry manure or perhaps human hormones discharged into the river with processed sewage.
7.4.5.3 Sanitation and Provision of CleanWater: Challenges for the Twenty-first Century
Providing ‘‘improved’’ clean water supply and sanitation to large parts of the human population remains a challenge (WHO/UNICEF 2004; United Nations Statistics Division 2004). (See Box 7.5 for definitions of improvement.) The most recently completed and comprehensive assessment of improved water and sanitation (WHO/UNICEF 2004) concluded that 1.1 billion people around the world still lack access to improved water supply and more than 2.6 billion lack access to improved sanitation, with strong geographic variations. (See Table 7.11 and Figures 7.13 and 7.14 in Appendix A.) Asia contains two thirds of all people who lack access to improved drinking water and three quarters of those who lack access to improved sanitation. Africa is next most prominent in terms of numbers still awaiting improvements in supply and sanitation. Other continents show much smaller numbers but may have relatively low rates of service, as in Oceania, with less than 50% served for both supply and sanitation.
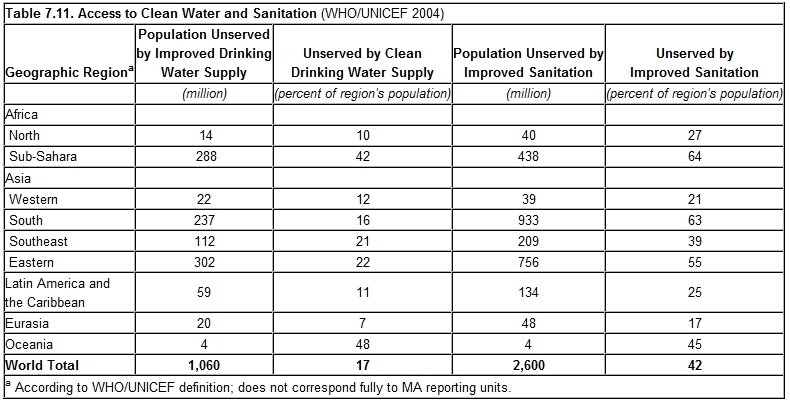
|
BOX 7.5 Defining Improved Water Supply and Sanitation |
|
‘‘Improved’’ water supply includes household connections, public standpipes, boreholes, protected dug wells, protected springs, and rainwater harvesting systems, but it does not include protected rivers or ponds, unprotected wells or springs, and unmonitored vendor-provided water (bottled water is not considered improved due to quantity limits arising from its high expense). ‘‘Improved’’ sanitation technologies include connections to a public sewer, connections to a septic system, pour-flush latrines, simple pit latrines, and ventilated improved pit latrines. Excreta disposal systems are considered adequate if they are private or shared (but not public) and if they hygienically separate human excreta from human contact. ‘‘Not improved’’ sanitation systems are service or bucket latrines (where excreta are manually removed), public latrines, or open pit latrines. |
There has been progressive improvement in the provision of sanitation since 1990 (see Table 7.12), recently prompted by the ambitious target for sanitation of the MDG environmental sustainability goal—namely, to halve by 2015 the proportion of people lacking such service in 1990. Worldwide, the goal was set to move coverage from 49% to 75%, and progress is nearly on track with the interim target for 2002 of 62% nearly attained. Of the nine regions analyzed, however, only four are on track or nearly, while five are behind schedule. The greatest challenge remains sub-Saharan Africa, which met only 4% of a targeted 17% improvement by 2002. Western Asia and Eurasia are less off their targets but have not moved forward. Overall, improvements in sanitation in rural areas have been significantly less than in urban areas, and there has even been a decline in the provision of sanitation in rural areas of Oceania and the former Soviet Union (WHO/UNICEF 2004).
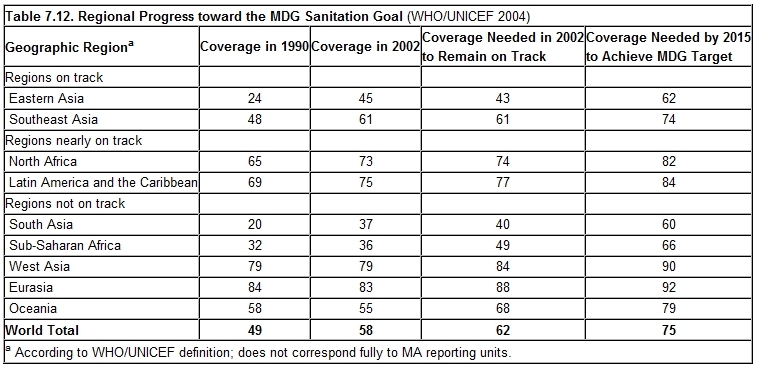
The rapid and disorganized growth in cities and peri-urban areas in developing countries is likely to hinder progress toward improved water delivery and sanitation systems. In 2000 alone, 16 cities around the world became megacities, with more than 10 million inhabitants each, housing 4% of the world’s population (United Nations 2002). Most of these megacities fall within regions already suffering from water stress (UN/WWAP 2003). In Africa, Asia, and Latin America, 25–50% of the population live in informal or illegal settlements around urban centers where no public services and no effective regulation of pollution and ecosystem degradation are available (UN-HABITAT 2003). Half of the urban population in Africa, Asia, and Latin America and the Caribbean suffers from one or more diseases associated with inadequate water and sanitation (UN/WWAP 2003).
Even if government or municipal authorities were inclined to expand water and sanitation services to informal urban settlements, the lack of formal land ownership, plot designation, and infrastructure make this very difficult and unlikely. In many countries, water and sanitation authorities are only allowed to provide services and connect households to the water grid if proof of land ownership is provided (UN-HABITAT 2003). These problems are in addition to the basic inability of slum dwellers to pay for connection charges and monthly fees without subsidies. With urban populations expected to encompass 80% of the world’s population by 2030 (UNPD 1999), the supply of water and sanitation to city dwellers is set to become one of the greatest challenges to development.
7.5 Trade-offs in the Contemporary Use of Freshwater Resources
This chapter has provided an assessment of the recent history and contemporary state of global freshwater provisioning services. It has documented a growing dependence of human well-being on fresh water, which in turn has promoted a variety of engineering strategies aimed at delivering reliable freshwater supplies. So effective has been the ability of water management to influence the state of this resource that anthropogenic impacts are now evident across the global water cycle. Much of the human influence is negative due to overuse and poor management, which has resulted in human-induced water scarcity, widespread pollution (Water pollution), and habitat and biodiversity loss. The capacity of ecosystems to sustain freshwater provisioning services thus has been greatly compromised throughout much of the world and may continue to remain so if historic patterns of managed use persist.
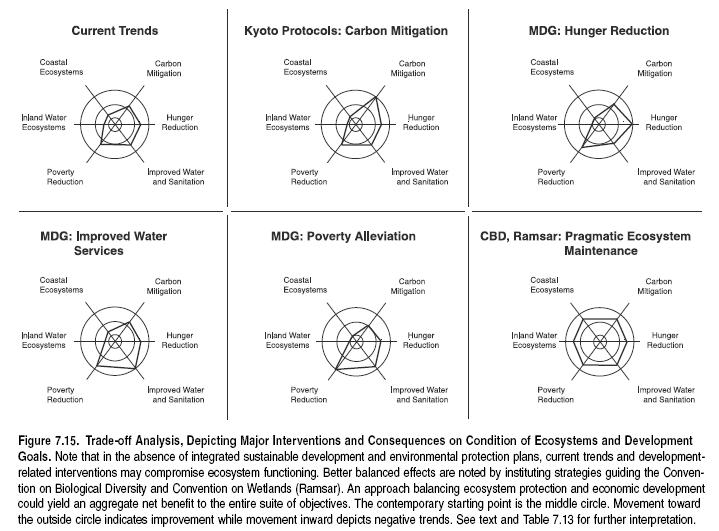
Sector-specific decisions often drive the nature of human interactions with water, with often unintended or purposefully ignored externalities on ecosystems. There is no shortage of examples. Flow Stabilization optimizing hydroelectricity can severely fragment and degrade aquatic habitats and lead to losses of economically important fisheries (Fisheries and aquaculture). Industrial development with poor effluent management can result in severe pollution, leading to the loss of aquatic ecosystem function and biodiversity. Connecting urban dwellers to water supply and sewerage systems without due attention to water treatment, as has been commonplace, results in the release of toxic compounds and waterborne diseases that affect downstream water users. In arid and semiarid regions, decisions to promote national food self-sufficiency can translate into great risk to downstream populations and costly infrastructure, as rivers that normally carry water and sediments nourishing coastal lands and floodplains are diverted onto croplands or stabilized behind dams.
Trade-offs are thus an unavoidable component of human-freshwater interactions. Trade-offs are also inevitable in meeting Millennium Development Goals and other international commitments. To demonstrate this, a heuristic analysis is presented here to explore how emphasis on a particular objective could influence the capacity to attain others. The analysis uses the contemporary setting as its starting point, which is then tracked with respect to the impact of five specific interventions. These correspond directly to major objectives embodied in the Kyoto Protocol (carbon mitigation), the MDGs (poverty alleviation, hunger reduction, improved water services), and the Conventions on Biological Diversity and Wetlands (pragmatic ecosystem maintenance applied to inland and coastal ecosystems).
A non-intervention case (current trends) is also considered, analyzing the implications of allowing contemporary trends to continue. A time frame of approximately 10–15 years is considered, allowing sufficient time for general patterns to emerge. This time frame also is associated with the first targets of the MDGs.
The interventions and their impacts are specifically viewed through the lens of freshwater services and ecosystem maintenance. Thus, for carbon mitigation the positive impacts of expanding hydropower to reduce carbon emissions are considered, together with the negative impacts of flow fragmentation that compromises the normal functions of inland freshwater (Freshwater biomes) and coastal ecosystems. To maximize relevancy to the international development agenda, the findings refer to poor countries alone. The interventions and key results are summarized in Table 7.13 and Figure 7.15. In each case the contemporary baseline is the starting point, given by the intermediate of three circles. Improvement is depicted by movement outward to the larger circle. Declining condition is represented by a move inward, and no appreciable change settles on the middle curve.
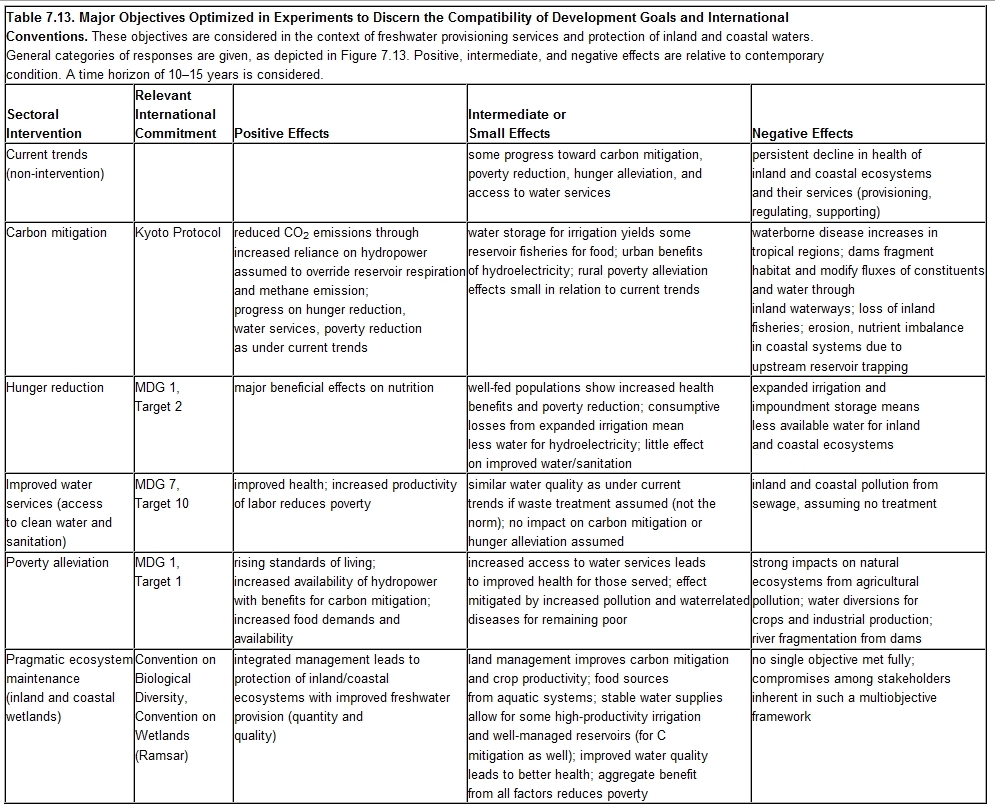
It is important to note that these experiments are not predictions but instead are thematic devices to demonstrate broad-scale effects that can be supported by findings in this chapter. Although the details could be argued legitimately one way or another, it is the basic character of the response that is sought. Furthermore, as will become apparent, it is the behavior of the full set of experiments rather than individual cases that becomes most instructive.
Current Trends in Figure 7.15 is the first case, representing no meaningful change in the pace at which human development is attained or interventions are made to reverse ongoing threats to ecosystem services. This scenario shows direct beneficiary effects on human well-being but also sustained and substantial declines in the condition of aquatic ecosystems. On the positive side, there is some alleviation of hunger through increased food production that relies on expanded irrigation and use of agrochemicals; continued improvement to health by way of drinking water and sanitation access; some progress toward reducing poverty; and an expansion of hydropower, which in some parts of the developing world (such as South America) is already an important source of energy, with some beneficiary effects on carbon mitigation.
At the same time, aquatic ecosystems and their biodiversity will be increasingly degraded in this scenario due to the combined forces of industrial, agricultural, and domestic sources of pollution, hydropower with associated flow fragmentation, and habitat destruction. Lack of environmental regulation and enforcement exacerbates the trend. Reduced and highly regulated water flows in rivers continue to decrease the transport of water and sediment to estuaries and coastal wetlands. Food provisioning services, in terms of natural inland and coastal fisheries, are in decline, and freshwater provisioning will continue to be placed in jeopardy by the dual threats of overuse and pollution.
Major supporting and regulating services also continue their decline due to loss of ecosystem function across both inland aquatic systems and their linked [[terrestrial] ecosystems]. Particularly relevant to fresh water are losses in flood control (from poor land management, erosion, loss of wetlands), in self-purification potential of waterways (from chronic and acute land-based sources of pollution), and in protection of human health (from inappropriate waste disposal). The links between ecosystem services and human well-being mean that these losses of natural services could ultimately compromise the attainment of important development goals.
While the value of controlling greenhouse gases or instituting the MDGs is almost universally accepted, results in Table 7.13 and Figure 7.15 suggest that pursuing each objective in isolation of other development goals or environmentally sound management principles will be counterproductive. Interventions in accordance with strategies being promoted through the Conventions on Biological Diversity and Wetlands, which stress protection and wise use of ecosystems and their services for sustainable development, yield several positive effects on human well-being. These improvements arise from a purposeful strategy of integrated environmental management, which links environmental stewardship directly to poverty alleviation, food security, and clean water targets (CBD 2004; Ramsar Convention 2004).
There is a growing recognition that maintaining biodiversity and ecosystem integrity will require compromise and trade-offs. A good example is the critical choice between providing water for crop production or for healthy rivers and wetlands. In areas where irrigation and storage reservoirs are upstream of sensitive ecosystems, both livelihoods and environmental integrity can be at stake. One possible strategy to accommodate potential losses in food production and income is by managing basin-wide improvements in water productivity for agriculture through new crop breeding, innovative technologies, and water reuse strategies (Molden 2003), all saving water and reducing the need for irrigation and flow stabilization.
While only qualitative in nature, these findings clearly demonstrate the consequences of optimizing one development goal or conservation objective over others. This assessment indicates that there would be substantial inconsistencies in the major development and sustainability strategies should they not become better integrated. The impacts of these conflicts on freshwater provisioning services and ecosystem functioning are likely to compromise the sought-after progress inherent in these same international commitments. The conjunction of several incongruous objectives will further exacerbate the deterioration of inland and coastal systems documented in Chapters 19 and 20.
It is very certain that the condition of inland waters and coastal ecosystems has been compromised by the conventional sectoral approach to water management, which, if continued, will constrain progress to enhance human well-being. In contrast, the ecosystem approach, as adopted by CBD, Ramsar, FAO, and others, shows promise for improving the future condition of water provisioning services, specifically by balancing the objectives of economic development, ecosystem needs, and human well-being.
References
- ADB (Asian Development Bank), 2001: Water for All: The Water Policy of the Asian Development Bank, Manila, Philippines.
- Alcamo, J., T. Heinrichs, and T. Rösch, 2000: World Water in 2025, World Water Series Report 2, Center for Environmental Systems Research, University of Kassel, KasselGermany.
- Alcamo, J., P. Döll, T. Henrichs, F. Kaspar, B. Lehner, et al., 2003: Global estimates of water withdrawals and availability under current and future ‘‘business-as-usual’’ conditions, Hydrological Sciences Journal, 48(3), pp. 339–48.
- Alcazar, L., L.C. Xu, and A.M. Zuluaga, 2000: Institutions, Politics, and Contracts: The Attempt to Privatize the Water and Sanitation Utility of Lima, Peru, Policy research working paper, WPS 2478, World Bank, Washington, DC.
- Allan, J.A., 1993: Fortunately there are substitutes for water: Otherwise our hydro-political futures would be impossible. In: Priorities for Water Resources Allocation and Management, ODA, London, UK, pp. 13–26.
- Allan, J.A., 1996. The political economy of water: Reasons for optimism but long-term caution. In: Water and Peace in the Middle East: Negotiating Resources in the Jordan Basin, Tauris Academic Publications, London, UK, pp. 75–120.
- Alexander, R.B., R.A. Smith, and G.E. Schwarz, 2000: Effect of stream channel size on the delivery of nitrogen to the Gulf of Mexico, Nature, 403, pp. 758–61.
- Alverson, K.D., R.S. Bradley, and T.F. Pedersen (eds.), 2003: Paleoclimate: Global Change and the Future, Springer, Berlin, Germany.
- AMAP (Arctic Monitoring and Assessment Program), 2002: Arctic pollution 2002: Persistent organic pollutants, heavy metals, radioactivity, human health, changing pathways, AMAP, Oslo, Norway.
- Angulo, F., 1999: Antibiotic use in aquaculture: Centers for Disease Control and Prevention memo to the record, 18 October 1999. Accessed 5 April 2001. Available at www.natlaquaculture.org/animal.htm.
- Avakyan, A.B. and V.B. Iakovleva, 1998: Status of global reservoirs: The position in the late twentieth century, Lakes and Reservoirs: Research and Management, 3, pp. 45–52.
- Avissar, R. and Y. Liu, 1996: A three-dimensional numerical study of shallow convective clouds and precipitation induced by land-surface forcing, Journal of Geophysical Research, 101, pp. 7499–18.
- Baron, J.S., N.L. Poff, P.L. Angermeier, C.N. Dahm, P.H. Gleick, et al., 2002: Meeting ecological and societal needs for freshwater, Ecological Applications, 12(5), pp. 1247–60.
- Barraque, B., J.-M. Berland, and S. Cambon, 1994: EUROWATER: Vertical report on France, LATTS-ENPC, Paris, France.
- Bhaduri, B., J. Harbor, B. Engel, and M. Grove, 2000: Assessing watershedscale, long-term hydrological impacts of land-use change using a GIS-NPS model, Environmental Management, 26, pp. 643–58.
- Blackmore, D.J., 1999: The Murray-Darling Basin cap on diversions: Policy and practice for the new millennium, National Water, (June), pp. 1–12.
- Blokland, M, O. Braadbaart, and K. Schwartz (eds), 1999: Private Business, Public Owners: Government Shareholdings in Water Enterprises, The Ministry of Housing, Spatial Planning, and the Environment, Nieuwegein, The Netherlands.
- Bonvallot, V., 2003: L’arsenic quotidien, Biofutur, 232, pp. 70–3.
- Bosch, J.M. and J.D. Hewlett, 1982: A review of catchment experiments to determine the effect of vegetation changes on water yield and evapotranspiration, Journal of Hydrology, 55, pp. 3–23.
- Bouwman, A.F., G. Van Drecht, J.M. Knoop, A.H.W. Beusen, and C.R. Meinardi, 2005: Exploring changes in river nitrogen export to the world’s oceans, Global Biogeochemical Cycles. In press.
- Boyer, D., 2001: Trade: The connection between environment and sustainable livelihoods, Working paper no. 5, Oxfam America, Boston, MA.
- Bradley, D., 1977: Health aspects of water supplies in tropical countries. In: Water, Wastes and Health in Hot Climates, R. Feachem, M. McGarry, and D. Mara (eds.), John Wiley & Sons, London, UK, pp. 3–17.
- Briscoe, J., 1999: The financing of hydropower, irrigation and water supply infrastructure in developing countries, Water Resources Development, 15, pp. 459–91.
- Brismar, A., 1997: Freshwater and Gender: A Policy Assessment, Stockholm Environment Institute, Stockholm, Sweden.
- Bruijnzeel, L.A., 1990: Hydrology of Moist Tropical Forests and Effects of Conversion: A State of Knowledge Review, UNESCO International Hydrological Programme, International Institute for Aerospace Survey and Earth Sciences Programme on Geo-information for Environmentally Sound Management of Tropical Resources, and The International Association of Hydrological Sciences.
- Bruijnzeel, L.A., 2004: Hydrological functions of tropical forests: Not seeing the soil for the trees? Agriculture Ecosystems and Environment. In press.
- Bruinsma, J.E., 2003: World Agriculture: Towards 2015/2030: An FAO Perspective, Earthscan Publications Ltd, London, UK.
- Bunnell, J.F., R.A. Zampella, R.G. Lathrop, and J.A. Bognar, 2003: Landscape changes in the Mullica river basin of the Pinelands National Reserve, New Jersey, USA, Environmental Management, 31(6), pp. 696–708.
- Buttle, J.M., I.F. Creed, and J.W. Pomeroy, 2000: Advances in Canadian forest hydrology, 1995–1998, Hydrological Processes, 14, pp. 1551–78.
- Calder, I.R., 1999: The Blue Revolution: Land Use & Integrated Water Resources Management, Earthscan, London, UK.
- Calder, I., 2000: Land use impacts on water resources, FAO Land-Water Linkages in Rural Watersheds Electronic Workshop, Background paper no. 1, FAO, Rome, Italy.
- Calder, I., 2004: Forests and water: Closing the gap between public and science perceptions, Water Science and Technology, 49(7), pp. 39–53.
- Carpenter, S.R., 2003: Regime Shifts in Lake Ecosystems: Pattern and Variation, Excellence in Ecology 15, International Ecology Institute, Oldendorf/Luhe Germany.
- CBD (Convention on Biological Diversity), 2004: Convention on Biological Diversity Convention Text [online]. Cited 1 November 2004. Available at www.bio div.org/convention/articles.asp.
- Chase, T.N., R.A. Pielke, T.G.F. Kittel, R. Nemani, and S.W. Running, 1996: Sensitivity of a general circulation model to global changes in leaf area index, Journal of Geophysical Research, 101(D3), pp. 7393–408.
- Chevreuil, M., D. Thevenot, P. Scribe, M. Blanchard, Y. Duclos et al., 1998: Micropollutants organiques: Une boîte de Pandore. In: La Seine en Son Bassin, M. Meybeck, G. de Marsily, and E. Fustec (eds.), Elsevier, Paris, France, pp. 439–81.
- Cohen, M., 2002: Managing across boundaries: The case of the Colorado River Delta. In: The World’s Water: 2002–03, P. Gleick et al. (eds.), Island Press, Washington, DC, pp. 133–47.
- Collignon, B. and M. Vezina, 2000: Independent Water and Sanitation Providers in African Cities, UNDP–World Bank Water and Sanitation Program.
- Constance, P., 1999: What price water? IDB America 26(7/8). Available at http://www.iadb.org/idbamerica/Archive/stories/1999/eng/cone899.htm.
- Costa, M.H. and J.A. Foley, 2000: Combined effects of deforestation and doubled atmospheric CO2 concentrations on the climate of Amazonia, Journal of Climate, 13, pp. 35–58.
- Costa, M.H., A. Botta, and J.A. Cardille, 2003: Effects of large-scale changes in land cover on the discharge of the Tocantins River, Southeastern Amazonia, Journal of Hydrology, 283, pp. 206–17.
- Daughton, C.G. and T.A. Ternes, 1999: Pharmaceuticals and personal care products in the environment: Agents of subtle change? Environmental Health Perspectives, 107 (Supplement 6), pp. 907–38.
- Day, J.C. and F. Quinn, 1987: Dams and diversions: Learning from Canadian experience. In: Proceedings of the Symposium on Interbasin Transfer of Water: Impacts and Research Needs for Canada, National Hydrology Research Institute, Saskatoon, Canada, pp. 43–56.
- Dennehy, K.F., Litke, D.W., and McMahon, P.B., 2002: The High Plains aquifer, USA: Groundwater development and sustainability. In: Sustainable Groundwater Development, K.M. Hiscock, M.O. Rivett, and R.M. Davison (eds.), Special Publications 193, Geological Society, London, pp. 99–119.
- Dettinger, M.D. and D.R. Cayan, 1995: Large-scale atmospheric forcing of recent trends toward early snowmelt runoff in California, Journal of Climate, 8, pp. 606–23.
- Dinar, A. and A. Subramanian, 1997: Water Pricing Experiences: An International Economy and Political Risks of Institutional Reform in the Water Sector, World Bank working paper no. 386, Washington, DC.
- Dirmeyer, P., X. Gao, and T. Oki, 2002: GSWP-2: The Second Global Soil Wetness Project Science and Implementation Plan, IGPO publication series no. 37, International GEWEX (Global Energy and Water Cycle Experiment) Project Office, 65 pp.
- Döll, P. and S. Siebert, 2000: A digital global map of irrigated areas, ICID Journal 49(2), pp. 55–66.
- Döll, P., F. Kaspar, and B. Lehner, 2003: A global hydrological model for deriving water availability indicators: Model tuning and validation, Journal of Hydrology, 270, pp. 105–34.
- Douglas, E.M., R.M. Vogel, and C.N. Kroll, 2000: Trends in floods and low flows in the U.S.: Impact of spatial correlation, Journal of Hydrology, 240, pp. 90–105.
- Douglas, E.M., K. Sebastian, C.J. Vörösmarty, and S. Wood, 2005: The role of tropical forests in supporting biodiversity and hydrological integrity: A synoptic overview, World Bank working paper, Washington, DC.
- Dudley, N. and S. Stolton, 2003: Running pure: The importance of forest protected areas to drinking water, World Bank/WWF, Gland, Switzerland/ Washington, DC.
- Dynesius, M. and C. Nilsson, 1994: Fragmentation and flow regulation of river systems in the northern third of the world, Science, 266, pp. 753–62.
- Easterling, D.R., J.L. Evans, P.Ya. Groisman, T.R. Karl, et al., 2000: Observed variability and trends in extreme climate events: A brief overview, Bulletin of the American Meteorological Society, 81(3), pp. 417–25.
- EEA (European Environment Agency), 1995: Europe’s Environment: The Dobris Assessment, D. Stanners, and P. Bourdeau (eds.), EEA, Copenhagen, Denmark.
- EEA, 2003: Europe’s water: An indicator-based assessment, Topic report no. 1/ 2003, EEA, Copenhagen, Denmark, p. 93 and p. 97. Available at http:// www.eea.eu.int.
- Ernst, C., 2004: Protecting the Source: Land Conservation and the Future of America’s Drinking Water, Trust for Public Land, Washington, DC.
- Falkenmark, M., 1997: Society’s interaction with the water cycle: A conceptual framework for a more holistic approach, Hydrological Sciences Journal, 42, pp. 451–66.
- Falkenmark, M. and C.Folke, 2003: Theme issue: Freshwater and welfare fragility: Syndromes, vulnerabilities and challenges, Royal Society’s Philosophical Transactions B Biology, 358, p. 1440.
- FAO (Food and Agriculture Organization of the United Nations), 1999: State of the World’s Forests, FAO, Rome, Italy.
- FCGWSP (Framing Committee of the Global Water System Project), 2004: Humans transforming the global water system, Eos: Transactions of the American Geophysical Union. In press.
- Federer, C.A., C.J. Vörösmarty, and B. Fekete, 2003: Sensitivity of annual evaporation to soil and root properties in two models of contrasting complexity, Journal of Hydrometeorology, 4, pp. 1276–90.
- Fekete, B.M., C.J. Vörösmarty, and W. Grabs, 2002: High resolution fields of global runoff combining observed river discharge and simulated water balances, Global Biogeochemical Cycles, 16(3), Art. no. 1042.
- Fekete, B.M., C.J. Vörösmarty, J. Roads, and C. Willmott, 2004: Uncertainties in precipitation and their impacts on runoff estimates, Journal of Climate, 17, pp. 294–304.
- Foster, S.S. and P.J. Chilton, 2003: Groundwater: The processes and global significance of aquifer degradation, Philosophical Transactions Of the Royal Society of London Series B Biological Sciences, 358(1440), pp. 1957–72.
- Foster, S., A. Lawrence, and B. Morris, 1998: Groundwater in urban development: Assessing management needs and formulating policy strategies, World Bank technical paper no. 390, The World Bank, Washington, DC.
- Foster, S., 2000: Groundwater at the World Water Forum, IAH (International Association of Hydrogeologists) News and Information. Cited 30 October 2004. Available at www.iah.org/articles/mar2000/art001.htm.
- Foster, S., J. Chilton, M. Moench, F. Cardy, and M. Schiffler, 2000: Groundwater in rural development: Facing the challenges of supply and resource sustainability,World Bank technical paper no. 463,World Bank,Washington, DC.
- Fraser, A., M. Meybeck, and E. Ongley, 1995: Water Quality of World Rivers, UNEP Environment Library report no. 14, UNEP, Nairobi, Kenya.
- Frich, P., L.V. Alexander, P. Della-Marta, B. Gleason, M. Haylock, et al., 2002: Observed coherent changes in climatic extremes during the second half of the twentieth century, Climate Research, 19, pp. 193–212.
- Furlong, K. and N.P. Gleditsch, 2003: The boundary dataset, Conflict Management and Peace Science, 20, pp. 93–117.
- GACGC (German Advisory Council on Global Change), 2000: World in Transition. Strategies for Managing Global Environmental Risks, Annual Report 1998, Springer, Berlin, Germany.
- Galloway, J.N., F.J. Dentener, D.G. Capone, E.W. Boyer, R.W. Howarth, et al., 2004: Global and regional nitrogen cycles: Past, present and future, Biogeochemistry, 70, pp. 153–226.
- Gardner, J.S., 2002: Natural hazards risk in the Kullu District, Himachal Pradesh, India, Geographical Review, 92, pp. 282–306.
- GESAMP (Group of Experts on the Scientific Aspects of Marine Environmental Protection), 1997: Towards safe and effective use of chemicals in coastal aquaculture, Reports and studies no. 65, GESAMP/ FAO, Rome, Italy, 40 p.
- Gilmour, D.A., M. Bonell, and D.S. Cassells, 1987: The effects of forestation on soil hydraulic properties in the middle hills of Nepal: A preliminary assessment, Mountain Research and Development, 7, pp. 239–49.
- Gleick, P.H. (ed.), 1993: Water in Crisis: A Guide to the World’s Freshwater Resources, Oxford University Press, London, UK.
- Gleick, P.H., 1996: Basic water requirements for human activities: Meeting basic needs, Water International, 21, pp. 83–92.
- Gleick, P.H., 1998: The World’s Water 1998–1999, Island Press, Washington, DC.
- Gleick, P.H., 1999: The human right to water, Water Policy, 1(5), pp. 487–503.
- Gleick, P.H., 2000: The World’s Water 2000–2001, Island Press, Washington, DC.
- Gleick, P.H., 2002: Dirty Water: Estimated Deaths from Water-Related Diseases 2000–2020, Pacific Institute Research Report, Pacific Institute for Studies in Development, Environment, and Security, Oakland, CA.
- Gleick, P.H., E.L. Chalecki, and A. Wong, 2002: Measuring water well-being: Water indicators and indices. In: The World’s Water: 2002–03, P. Gleick et al. (eds.), Island Press, Washington, DC, pp. 87–112.
- Gleick, P.H., G. Wolff, E.L. Chalecki, and R. Reyes, 2002a: The privatization of water and water systems. In: The World’s Water: 2002–03, P. Gleick et al. (eds.), Island Press, Washington, DC, pp. 57–85.
- Gleick, P. H., E.L. Chalecki, and A. Wong, 2002b. Measuring water wellbeing: Water indicators and indices. pp. 87–112. In: P. Gleick et al. (eds.) The World’s Water: 2002–03. Washington, DC: Island Press.
- Gleick, P.H., G. Wolff, E.L. Chalecki, R. Reyes, 2002c: The New Economy of Water: The Risks and Benefits of Globalization and Privatization of Fresh Water, Pacific Institute for Studies in Development, Environment, and Security, Oakland, CA.
- GLFC (Great Lakes Fishery Commission), 1999: Addressing Concerns for Water Quality Impacts from Large-Scale Great Lakes Aquaculture, GLFC, Great Lakes Water Quality Board, International Joint Commission.
- Goldburg, R.J., M.S. Elliott, and R.L. Naylor, 2001: Marine Aquaculture in the United States: Environmental Impacts and Policy Options, Pew Oceans Commission, Arlington, VA.
- Good, R.E. and N.F. Good, 1984: The Pinelands National Reserve: An ecosystem approach to management, BioScience, 34(3), pp. 169–73.
- Green, C.H., D.J. Parker, and S.M Tunstall, 2000: Assessment of Flood Control Options and Management, WCD Thematic Review, Options Assessment: IV. Available at http://www.dams.org/docs/kbase/thematic/tr44main.pdf.
- Green, P., C.J. Vörösmarty, M. Meybeck, J. Galloway, and B.J. Peterson, 2004: Pre-industrial and contemporary fluxes of nitrogen through rivers: A global assessment based on typology, Biogeochemistry, 68, pp. 71–105.
- Groisman, P.Ya., R.W. Knight, and T.R. Karl, 2001: Heavy precipitation and high streamflow in the contiguous United States: Trends in the twentieth century, Bulletin of the American Meteorological Society, 82(2), pp. 219–46.
- Groisman, P.Ya., R.W. Knight, T.R. Karl, D.R. Easterling, B. Sun, et al., 2004: Contemporary changes of the hydrological cycle over the contiguous United States: Trends derived from in situ observations, Journal of Hydrometeorology, 5, pp. 64–85.
- GWP (Global Water Partnership), 2000: Integrated river basin management, Technical Advisory Committee background paper, Stockholm, Sweden.
- Hamerlynck, O. and S. Duvail, 2003: The Rehabilitation of the Delta of the Senegal River in Mauritania, IUCN, Gland, Switzerland and Cambridge, UK, viii + 88 pp.
- Hamilton, L.S., 1987: What are the impacts of deforestation in the Himalayas on the Ganges–Brahmaputra lowlands and delta? Relations between assumptions and facts, Mountain Research and Development, 7, pp. 256–63.
- Hamilton, P.A., T.L. Miller, and D.N. Myers, 2004: Water quality in the nation’s streams and aquifers: Overview of selected findings, 1991–2001, U.S. Geological circular 1265, USGS (US Geological Survey), Denver, CO.
- Hamlet, A.F. and D.P. Lettenmaier, 1999:Effects of climate change on hydrology and water resources objectives in the Columbia River basin, Journal of the American Water Resources Association, 35, pp. 1597–624.
- Hart, D.D., T.E. Johnson, K.L. Bushaw-Newton, R.J. Horwitz, A.T. Bednarek, et al., 2002: Dam removal: Challenges and opportunities for ecological research and river restoration, BioScience, 52(8), pp. 669–81.
- Haub, C., 1994: Population explosion. In: The Encyclopedia of the Environment, R. Eblen and W. Eblen (eds.), Hougton Mifflin, Boston, MA, p. 577.
- Health Canada, 2004: Chloramphenicol in food products, Health Canada, Ottawa, Canada. Available at http://www.hc-sc.gc.ca/vetdrugs-medsvet/chlor amphenicol_e.html5.
- Hirji, R., 1998: Inter-basin water transfers: Emerging trends, World Bank Report no. 22675 Environment Matters, (Fall), 4 pp.
- Hoeg, K., 2000: Dams: Essential infrastructure for future water management, Paper presented at the Second World Water Forum for the International Commission on Large Dams, 17–22 March, The Hague, The Netherlands.
- Hodgkins, G.A., R.W. Dudley, and T.G. Huntington, 2003: Changes in the timing of high river flows in New England over the 20th Century, Journal of Hydrology, 278, pp. 244–52.
- Hoekstra, A.Y. and P.Q. Hung., 2002: Virtual Water Trade: A Quantification of Virtual Water Flows between Nations in Relation to International Crop Trade, Value of Water Research report series no. 11, IHE (Institute for Water Education)- Delft, Delft, The Netherlands.
- Hoekstra, A.Y., 2003: Virtual water: An introduction. In: Virtual Water Trade: Proceedings of the International Expert Meeting on Virtual Water Trade, A.Y. Hoekstra (ed.), Value of Water research report series no. 12, IHE (Institute for water Education)-Delft, Delft, The Netherlands. pp. 1–23.
- Hornbeck, J.W., and R.B. Smith, 1997: A water resources decision model for forest managers, Agricultural and Forest Meteorology, 84, pp. 83–8.
- Houghton, J.T., Y. Ding, D.J. Griggs, M. Noguer, P.J. van der Linden, et al., (eds.), 2001: Climate change 2001: The scientific basis, Third Assessment Report, Intergovernmental Panel on Climate Change working group I, Cambridge University Press, Cambridge, UK.
- Howarth, R.W., G. Billen, D. Swaney, A. Townsend, N. Jaworski, et al., 1996: Regional nitrogen budgets and riverine N and P fluxes for the drainages to the North Atlantic Ocean: Natural and human influences, Biogeochem, 35, pp. 75–139.
- Hutton, G. and L. Haller, 2004: Evaluation of the Costs and Benefits of Water and Sanitation Improvements at the Global Level, WHO/SDE/WSH/04.04, WHO, Geneva, Switzerland. Available at www.who.int/water_sanitation_health/ wsh0404/en.
- IAHS (International Association of Hydrologic Sciences), 2001: Global water data: A newly endangered species, Eos: Transactions of the American Geophysical Union, 82(5), pp. 54, 56, 58.
- ICWE (International Conference on Water and the Environment), 1992: Development Issues for the 21st Century: The Dublin Statement and Report of the Conference, 26–31 January, Dublin, World Meteorological Organization, Geneva, Switzerland.
- IFRC/RCS (International Federation of the Red Cross and Red Crescent Societies), 2000: World Disasters Report 2000: Focus on Public Health, IFRC/RCS, Geneva, Switzerland.
- IFRCRCS, 2003: World Disasters Report 2003, IFRC/RCS, Geneva, Switzerland.
- IUCN (World Conservation Union), 2003: Flow: The Essentials of Environmental Flows, M. Dyson, G. Bergkamp, and J. Scanlon (eds.), Gland, Switzerland/ Cambridge, UK.
- Jaeger, C., 2001: The challenge of global water management. In: Understanding the Earth System: Compartments, Processes, Interactions, E. Ehlers and T. Krafft (eds.), Springer, Berlin, Germany, pp. 125–35.
- Jensen, P.K., G. Jayasinghe, W. van der Hoek, S. Cairncross, and A. Dalsgaard, 2004: Is there an association between bacteriological drinking water quality and childhood diarrhoea in developing countries? Tropical Medicine and International Health, 9(11), pp. 1210–15.
- Jones, K.B., K.H. Riitters, J.D. Wickham, R.D. Tankersley, Jr., R.V. O’Neill, et al., 1997: An Ecological Assessment of the United States Mid-Atlantic Region: A Landscape Atlas, US Environmental Protection Agency, Washington, DC.
- Jones, O.A.H., N. Voulvoulis, and J.N. Lester, 2003: Potential impact of pharmaceuticals on environmental health, Bulletin of theWorld Health Organization, 81(10) (October), Geneva.
- Kakabadse-Navarro, Y., J. McNeely, and D. J. Melnick, 2004: Interim report of task force 6 on environmental sustainability, Millennium project, New York, NY. Available at www.unmillenniumproject.org.
- Kanciruk, P., 1997: Pricing policy for federal research data, Bulletin of the American Meteorological Society, 78, pp. 691–2.
- Karl, T., R.W. Knight, D.R. Easterling, and R.G. Quayle, 1996: Indices of climate change for the United States, Bulletin of the American Meteorological Society, 77, pp. 279–92.
- Karl, T.R. and R.W. Knight, 1998: Secular trends of precipitation amount, frequency, and intensity in the USA, Bulletin of the American Meteorological Society, 79(2), pp. 231–41.
- King, J.M, R.E. Tharme, and M.S. DeVilliers (eds.), 2000: Environmental Flow assessments for Rivers: Manual for the Building Block Methodology, Water Research Commission, Pretoria, South Africa.
- Kolpin, D.W., Furlong, E.T., Meyer, M.T., Thurman, E.M., Zuagg, S.D. et al., 2002: Pharmaceuticals, hormones, and other organic wastewater contaminants in US streams, 1999–2000: A national reconnaissance, Environmental Science and Technology, 36, pp. 1202–2111.
- Korzoun, V.I., A.A. Sokolov, M.I. Budyko et al. (eds), 1978: Atlas of World Water Balance andWater Resources of the Earth, USSR Committee for the International Hydrological Decade, Leningrad, UNESCO, Paris, France.
- Kowalewski, M., G.E. Avila Serrano, K.W. Flessa, and G.A. Goodfriend, 2000: Dead delta’s former productivity: Two trillion shells at the mouth of the Colorado River, Geology, 28, pp. 1059–62.
- Kunkel, K., K. Andsager, and D.R. Easterling, 1999: Trends in heavy precipitation events over the continental Unites States, Journal of Climate, 12, pp. 2515–27.
- Labat, D., Y. Goddéris, J.L. Probst, and J.L. Guyot, 2004: Evidence for global runoff increase related to climate warming, Advances in Water Resources, 27, pp. 631–42.
- Lammers, R.B., A.I. Shiklomanov, C.J. Vörösmarty, B.M. Fekete, and B.J. Peterson, 2001: Assessment of contemporary Arctic river runoff based on observational discharge records, Journal of Geophysical Research – Atmospheres, 106(D4), pp. 3321–34.
- Lawrence, P., J.R. Meigh, and C.A. Sullivan, 2003: The Water Poverty Index: An International Comparison, Keele Economic Research Papers 2003/18 and Centre for Ecology and Hydrology (CEH), Wallingford, UK.
- Lanfear, K.J. and R.M. Hirsch, 1999: USGS study reveals a decline in long-record streamgauges, Eos: Transactions of the American Geophysical Union, 80, pp. 605–7.
- Le Maitre, D.C., D.F. Scott, and C. Colvin, 1999: A review of information on interactions between vegetation and groundwater, Water SA, 25, pp. 137–52.
- Le Maitre, D.C., D.B. Versfeld, and R.A. Chapman, 2000: The impact of invading alien plants on surface water resources in South Africa: A preliminary assessment, Water SA, 26, pp. 397–408.
- Lins, H.F. and J.R. Slack, 1999: Streamflow trends in the United States, Geophysical Research Letters, 26, pp. 227–30.
- Loth, P. (ed.), 2004: The Return of the Water: Restoring the Waza Logone Floodplain in Cameroon, IUCN, Gland, Switzerland/ Cambridge, UK, xvi + 156 pp.
- L’vovich, M.I. and G.F. White, 1990: Use and transformation of terrestrial water systems. In: The Earth as Transformed by Human Action, B.L. Turner, W.C. Clark, R.W. Kates, J.F. Richards, J.T. Mathews, et al. (eds.), Cambridge University Press, Cambridge, UK, pp. 235–52.
- Mahé, G., 1993: Les écoulements fluviaux sur la façade atlantique de l’Afrique: Etude des éléments du bilan hydrique et variations interannuelles: Analyse de situations hydrclimatiques moyennes et extremes, Col. Etudes et Theses, ORSTOM (Office de la Recherche Scientifique et Technique de Outre-Mer/Institute of Research for Development and Cooperation), Paris, France.
- Margat, J. 1990a: Les Eaux Souterraines dans le Monde, Orléans, Bureau de recherches géologiques et miniéres (BRGM), Départment eau.
- Margat, J. 1990b: Les Gisement d’Eau Souterraine, La Recherche, 221.
- McCabe, G. J. and D.M. Wolock, 2002: Trends and temperature sensitivity of moisture conditions in the conterminous United States, Climate Research, 20(1), pp. 19–29.
- McCully, P., 1996: Silenced Rivers: The Ecology and Politics of Large Dams, Zed Books, London, UK.
- McIntosh, A.C. and C.E. Yñiguez, 1997: Second Water Utilities Data Book, Asian Development Bank, Manila, Philippines, 210 pp.
- MDBC (Murray-Darling Basin Commission), 2003: Murray-Darling Basin Water Resources fact sheet, November, 7 pp. Available at www.mdbc.gov .au/publications/factsheets/water_resourcesver2.html.
- MDBC, 2004: The cap. Available at www.mdbc.gov.au/naturalresources/ the_cap/cap_brochure.pdf.
- MEE (Ministry of the Environment and Water), 2001: Loi d’orientation relative à la gestion de l’eau: Loi n002–2001/AN du 8 février 2001 portant loi d’orientation relative à la gestion de l’eau, Ouagadougou, Burkina Faso.
- Mekis, E. and W.D. Hogg, 1999: Rehabilitation and analysis of Canadian daily precipitation time series, Atmosphere-Ocean, 37, pp. 53–85.
- Meybeck, M. and R. Helmer, 1989: The quality of rivers: From pristine stage to global pollution, Palaeogeography, Palaeoclimatology, Palaeoecology (Global and Planetary Change), 1, pp. 283–309.
- Meybeck, M. and A. Ragu, 1997: Presenting GEMS-GLORI, a compendium of world river discharges to the oceans, International Association of Hydrological Science Publications, 243, pp. 3–14.
- Meybeck, M., 2002: Riverine quality at the Anthropocene: propositions for global space and time analysis, illustrated by the Seine River, Aquatic Sciences, 64, pp. 1–18.
- Meybeck, M., R. Helmer, M. Dray, H. El Ghobary, A. Demayo, et al., 1991: Water quality: Progress in the implementation of the Mar del Plata Action Plan, UN Conference on Water, Dublin, WHO/UNEP.
- Meybeck, M., P. Green, and C.J. Vörösmarty, 2001: A new typology for mountains and other relief classes: An application to global continental water resources and population distribution, Mountain Research and Development, 21, pp. 34–45.
- Meybeck, M., 2003: Global analysis of river systems: From Earth system controls to Anthropocene syndromes, Philosophical Transactions of the Royal Society Of London Series B,?DOI 10.1098/rstb.2003, pp. 1379.
- Meybeck, M., P. Green, and C.J. Vörösmarty, 2001: A new typology for mountains and other relief classes: An application to global continental water resources and population distribution, Mountain Research and Development, 21, pp. 34–45.
- Meybeck, M., C.J. Vörösmarty, R.E. Schulze, and A. Becker, 2004: Conclusions: Scaling relative responses of terrestrial aquatic systems to global changes. In Vegetation, Water, Humans and the Climate, P. Kabat, M. Claussen, P.A. Dirmeyer et al. (eds.), Springer, Berlin, Germany, pp. 455–64.
- Miguel, E., S. Satyanath, and E. Sergenti, 2004: Economic shocks and civil conflict: An instrumental variables approach, Journal of Political Economy, 112(4), pp. 725–53.
- Milly, P.C.D., R.T. Wetherald, K.A. Dunne, and T.L. Delworth, 2002: Increasing risk of great floods in a changing climate, Nature, 415, pp. 514–17.
- Molden, D., 2003: Pathways to improving the productivity of water, In: Issues of Water Management in Agriculture: Compilation of Essays, Comprehensive assessment of water management in agriculture, Colombo, Sri Lanka, pp. 1–6.
- Morris, B.L, A.R. Lawrence et al., 2003: Groundwater and Its Susceptibility to Degradation: A Global Assessment of the Problem and Options for Management, Early Warning and Assessment Reports Series, RS.03–3, UNEP, Nairobi, Kenya.
- Muller, M., 2000: Inter-basin water sharing to achieve water security: A South African perspective, Presented in the World Water Forum in the Haag, 2000, Department of Water Affairs and Forestry, Pretoria, South Africa.
- MWR (Ministry of Water Resources), 2004: Official Ministry of Water Resources of China. Cited 25 October 2004. Available at www.mwr.gov.cn/ english1/20040823/39104.asp.
- National Water Act (Act No. 36), 1998: South African National Water Act. Available at http://www-dwaf.pwv.gov.za/Documents/Legislature/nw_act/ NWA.doc.
- Nijssen, B., G.M. O’Donnell, D.P. Lettenmaier, D. Lohmann, and E.F.Wood, 2001: Predicting the discharge of global rivers, Journal of Climate, 14, pp. 3307–23.
- Nilsson, C., C. Reidy, M. Dynesius, and C. Revenga, 2005: Fragmentation and Flow Regulation of the World’s 292 Largest Rivers. In review.
- NLWRA (National Land andWater Resources Audit), 2004: Australian Natural Resources Atlas. Cited 30 October 2004. Available at audit.ea.gov.au/ ANRA/water/water_frame.cfm?region_type_AUS®ion_code _AUS& info_resourcesr.
- NOAA-NGDC (National Oceanic and Atmospheric Administration–National Geophysical Data Center), 1998: Stable lights and eadiance calibrated lights of the world CD-ROM, View Nighttime Lights of the World data base, NOAA–NGDC, Boulder, CO. Available at http://julius.ngdc.noaa.gov:8080/production/html/BIOMASS/night.html.
- NRC (National Research Council), 1999: A Question of Balance: Private Rights and the Public Interest in Scientific and Technical Databases, National Academy Press, Washington, DC.
- OECD (Organisation for Economic Co-operation and Development), 1999: The Price of Water: Trends in OECD Countries, OECD, Paris, France.
- Oki, T., Y. Agata, S. Kanae, T. Saruhashi, D. Yang et al., 2001: Global assessment of current water resources using total runoff integrating pathways, Hydrological Sciences Journal, 46, pp. 983–96.
- Oki, T., M. Sato, A. Kawamura, M. Miyake, S. Kanae, et al., 2003a: Virtual water trade to Japan and in the world. In: Virtual Water Trade: Proceedings of the International Expert Meeting on Virtual Water Trade, AY. Hoekstra (ed.), Value of Water research report series no. 12, IHE (Institute for Water Education)- Delft, Delft, The Netherlands, pp. 221–33.
- Oki, T., Y. Agata, S. Kanae, T. Saruhashi, and T. Musiake, 2003b: Global water resources assessment under climatic change in 2050 using TRIP, IAHS Publication, 280, pp. 124–33.
- Pagiola, S., 2002: Paying for water services in Central America: Learning from Costa Rica. In: Selling Forest Environmental Services, S. Pagiola, J. Bishop, and N. Landell-Mills (eds.), Earthscan, London, UK.
- Pagiola, S., R. Martin-Hurtado, P. Shyamsundar, M. Mani, and P. Silva, 2002: Generating Public Sector Resources to Finance Sustainable Development: Revenue and Incentive Effects,World Bank technical paper no. 538,World Bank, Washington, DC.
- Paul, M.J. and J.L. Meyer, 2001: Streams in the urban landscape, Annual Review of Ecology and Systematics, 32, pp. 333–65.
- Peet, J., 2003: Priceless: A survey of water, The Economist, (July 17),.
- Peterson, B.J., R.M. Holmes, J.W. McClelland, C.J. Vörösmarty, R.B. Lammers, et al., 2002: Increasing river discharge to the Arctic Ocean, Science, 298, pp. 2171–3.
- Pielke, R.A., T.J. Lee, J.H. Copeland, J.L. Eastman, C.L. Ziegler, and C.A. Finley, 1997: Use of USGS-provided data to improve weather and climate simulations, Ecological Applications, 7, pp. 3–21.
- Pitman, A. and M. Zhao, 2000: The relative impact of observed change in land cover and carbon dioxide as simulated by a climate model, Geophysical Research Letters, 27, pp. 1267–70.
- Poff, N.L., 2003: River flows and water wars: Emerging science for environmental decision making, Frontiers in Ecololgy and the Environment, 1(6), pp. 298–306.
- Poff, N.L., J.D. Allan, M.B. Bain, J.R. Karr, K.L. Prestegaard, et al., 1997: The natural flow regime: A paradigm for river conservation and restoration, BioScience, 47(11), pp. 769–84.
- Postel, S.L, G.C. Daily, and P.R. Ehrlich, 1996: Human appropriation of renewable fresh water, Science, 271, pp. 785–88.
- Postel, S.L. and S. Carpenter, 1997: Freshwater ecosystem services. In: Nature’s Services: Societal Dependence on Natural Ecosystems, G.C. Daily (ed.), Island Press, Washington, DC, pp. 195–214.
- Postel, S.L., 1998: Water for food production: Will there be enough in 2025? BioScience, 48, pp. 629–35.
- Postel, S.L., 1999: Pillar of Sand: Can the Irrigation Miracle Last? W.W. Norton, New York, NY, 313 pp.
- Postel, S. and B. Richter, 2003: Rivers for Life: Managing Water for People and Nature, Island Press, Washington, DC.
- Postel, S. and A. Vickers, 2004: Boosting water productivity. In: State of the World 2004, Worldwatch Institute, W.W. Norton, New York, NY.
- Pryer, J., 1993: The impact of adult ill-health on household income and nutrition in Khulna, Bangladesh, Environment and Urbanization, 5, pp. 35–49.
- Rabalais, N.N., R.E. Turner, and D. Scavia, 2002: Beyond science into policy: Gulf of Mexico hypoxia and the Mississippi River, BioScience, 52, pp. 129–42.
- Radziejewski, M. and Z.W. Kundzewicz, 2004: Detectability of changes in hydrological records, Hydrological Sciences Journal, 49(1), pp. 39–51.
- Ramankutty, N. and J.A. Foley, 1999: Estimating historical changes in global land cover: Croplands from 1700 to 1992, Global Biochemical Cycles, 13(4), pp. 997–1027.
- Ramsar Convention on Wetlands, 2004: Convention text. Consulted 25 October 2004. Available at www.ramsar.org.
- Raskin, P., E. Hansen, and R. Margolis, 1995:Water and Sustainability: A Global Outlook, Pole Star Series report no. 4, Stockholm Environmental Institute, Stockholm, Sweden.
- Raskin, P. 1997. Water Futures: Assessment of Long-range Patterns and Problems, Background document to the Comprehensive Assessment of the Freshwater Resources of the World report, Stockholm Environmental Institute, Stockholm, Sweden.
- Revenga, C., Brunner, J., Henniger, N., Kassem, K., and R. Payner, 2000: Pilot Analysis of Global Ecosystems, Freshwater Systems, World Resources Institute, Washington, DC.
- Revenga, C. and A. Cassar, 2002: Ecosystem management of water resources in Africa, World Wide Fund for Nature (WWF) Global Network, World Wildlife Fund.
- Richter, B.D., A.T. Warner, J. Meyer, and K. Lutz: A collaborative process for developing flow recommendations to restore river and estuary ecosystems, River Research and Applications. In prep.
- Robock, A., K.Y. Vinnikov, G. Srinivasan, J.K. Entin, S.E. Hollinger et al., 2000: The global soil moisture data bank, Bulletin of the American Meteorological Society, 81(6), pp. 1281–99.
- Robson, A.J., 2002: Evidence for trends in UK flooding, Philosophical Transactions of the Royal Society of London Series A- Mathematical, Physical, Engineering Sciences, 1796, pp. 1327–43.
- Rockström, J. and L. Gordon, 2001: Assessment of green water flows to sustain major biomes of the world: Implications for future ecohydrological landscape management, Physical Chemistry of the Earth, 26, pp. 843–51.
- Rogers, P., 1993: America’s Water: Federal Roles and Responsibilities, Twentieth Century Fund, MIT Press, Cambridge, MA.
- Rosegrant, M.W., R.G. Scheleyer, S.N. Yadav, and N. Satya, 1995: Water policy for efficient agricultural diversification: Market-based approaches, Food Policy, 20, pp. 203–23.
- Rosegrant, M.W., X. Cai, and S.A. Cline, 2002: Worldwater and Food to 2025: Dealing with scarcity, International Food Policy and Research Institute and International Water Management Institute, Washington, DC.
- Scheidleder, J. Grath, G. Winkler, U. Stark, C. Koreimann, et al., 1999: Groundwater Quality and Quantity in Europe, S. Nixon (ed.), European Topic Centre on Inland Waters, European Environment Agency, Copenhagen, Denmark.
- Schiermeier, Q., 2003: Studies assess risks of drugs in water cycle 2003, Nature, 424, p. 5.
- Seitzinger, S.P. and C. Kroeze, 1998: Global distribution of nitrous oxide production and N inputs in freshwater and coastal marine ecosystems, Global Biogeochemical Cycles, 12, pp. 93–113.
- Seitzinger, S.P., C. Kroeze, A.F. Bouwman, N. Caraco, F. Dentener, et al., 2002: Global patterns of dissolved inorganic and particulate nitrogen inputs in coastal ecosystems: Recent conditions and future projections, Estuaries, 25, pp. 640–55.
- Schulze, R.E., 2004: River basin responses to global change and anthropogenic impacts. In: Vegetation, Water, Humans and the Climate, P. Kabat, M. Claussen, P.A. Dirmeyer, et al. (eds), Springer, Heidelberg, Germany.
- Shah, T., D. Molden, R. Sakthivadivel, and D. Seckler, 2000: The Global Groundwater Situation: Overview of Opportunities and Challenges, International Water Management Institute, Colombo, Sri Lanka.
- Shiklomanov, A.I., R.B. Lammers, and C.J. Vorosmarty, 2002: Widespread decline in hydrological monitoring threatens Pan-Arctic research, Eos: Transactions of the American Geophysical Union, 83, pp. 13, 16–17.
- Shiklomanov, I.A. and J. Rodda, 2003: World Water Resources at the Beginning of the 21st Century, UNESCO, Paris, France.
- Sircoulon, J., T. Lebel, and N.W. Arnell, 1999: Assessment of the impacts of climate variability and change on the hydrology of Africa. In: Impacts of Climate Change and Climate Variability on Hydrological Regimes, J.C. van Dam (ed.), UNESCO International Hydrology Series, Cambridge University Press, Cambridge, UK, pp. 67–84.
- Smakhtin, V., C. Revenga, and P. Döll, 2004: Taking into account environmental water requirements in global-scale water resources assessments, Comprehensive assessment research report no. 2, International Water Management Institute, Colombo, Sri Lanka.
- Snaddon, C.D. and B.R. Davies, 1998: A preliminary assessment of the effects of a small South African inter-basin water transfer on discharge and invertebrate community structure, Regulated Rivers: Research and Management, 14, pp. 421–41.
- Snaddon, C.D., M. Wishart, and B.R. Davies, 1998: Some implications of inter-basin water transfers for river functioning and water resources management in Southern Africa, Aquatic Ecosystem Health and Management, 1, pp. 159–82.
- Stallard, R.F., 1998: Terrestrial sedimentation and the carbon cycle: Coupling weathering and erosion to carbon burial, Global Biogeochemical Cycles, 12, 231–57.
- Sullivan, C.A, J.R. Meigh, A.M. Giacomello, T. Fediw, P. Lawrence, et al., 2003: The Water Poverty Index: Development and application at the community scale, Natural Resources Forum, 27, pp. 189–99.
- Sun, G., S.G. McNulty, J.P. Shepard, D.M. Amatya, H. Riekerk, et al., 2001: Effects of timber management on the hydrology of wetland forests in southern United States, Forest Ecology and Management, 143, pp. 227–36.
- Swank, W.T. and D.A.J. Crossley (eds.), 1988: Forest Hydrology at Coweeta, Springer Verlag, New York, NY.
- Swank, W.T., L.W.J. Swift, and J.E. Douglass, 1988: Streamflow changes associated with forest cutting, species conversions, and natural disturbances. In: Forest Hydrology and Ecology at Coweeta, W.T. Swank and D.A.J. Crossley (eds.), Springer Verlag, New York, NY, pp. 297–312.
- Swanson, R.H., 1998: Forest hydrology issues for the 21st century: A consultant’s viewpoint, Journal of the American Water Resources Association, 34, pp. 755–63.
- Syvitski, J.P.M., C.J. Vörösmarty, A.J. Kettner, and P. Green, 2005: Impact of humans on the flux of terrestrial sediment to the global coastal ocean, Science, 308, pp. 376–80.
- Tharme, R.E, J.M. King, 1998: Development of the Building Block Methodology for Instream Flow Assessments and Supporting Research on the Effects of Different Magnitude Flows on Riverine Ecosystems, Water Research Commission in Rivers for Life, Postel and Richer, Cape Town, South Africa.
- Thobani, M., 1997: Formal water markets: Why, when, and how to introduce tradable water rights, The World Bank Research Observer, 12, pp. 161–79.
- Thompson, R.L., 2001: The World Bank strategy to rural development with special reference to the role of irrigation and drainage, Keynote address on the occasion of the 52nd IEC meeting of the International Commission on Irrigation and Drainage, 16–21 September 2001, Seoul, South Korea.
- Tollan, A., 2002: Land-use change and floods: What do we need most, research or management, Water Science and Technology, 45, pp. 183–90.
- UN (United Nations), 2002: World urbanization prospects: The 2001 revision, Department of Economic and Social Affairs, Population Division, UN, New York, NY. Available at http://www.unpopulation.org.
- UNECE (United Nations Economic Commission for Europe), 1995: State of the Art on Monitoring and Assessment: Rivers, UNECE Task Force on Monitoring and Assessment, Draft Report V, RIZA, Lelystad, The Netherlands.
- UNEP (United Nations Environment Programme), 1996: Groundwater: A threatened resource, UNEP Environment Library no. 15, UNEP, Nairobi, Kenya.
- UNEP, 2002: Global Environmental Outlook 3 (GEO-3), Earthscan Publications, Ltd., London and Stirling, UK.
- UNESCO-IHP (UN Educational, Scientific and Cultural Organization— International Hydrological Programme), 2004: The World-wide Hydrogeological Mapping and Assessment Programme (WHYMAP), A consortium mapping project of International Hydrological Program, International Geological Correlation Programme, International Association of Hydrogeologists, Commission for the Geological Map of the World, International Agricultural Exchange Association, Bundesanstalt fur Geowissenschaften und Rohstoffe—Germany). Available at www.bgr.de/b1hydro/index.html?/ b1hydro/fachbeitraege/a200401/e_whymap.htm.
- UN-HABITAT, 2003: Water and sanitation in the world’s cities: Local action for global goals, Earthscan, London, UK.
- UNPD (UN Population Division), 1999: World population prospects: The 1998 revision, Vol. 1, UN, New York, NY.
- UNPD, 2003: World population prospects: The 2002 revision, Highlights, ESA/P/WP.180, UN, New York, NY. Available at http://esa.un.org/unpp.
- UN Statistics Division, 2004: Millennium Indicators, UN, New York, NY. Available at http://millenniumindicators.un.org/unsd/mi/mi_series_xrxx .asp?row_id_669.
- UNWWAP (United Nations World Water Assessment Program), 2003: Water for people: Water for life, UN World Water Development Report, UNESCO, Paris, France, 576 pp.
- US Embassy in China, 2003: Update on China’s south-north water transfer project, A June 2003 report, US Embassy, Beijing, China. Available at www .usembassy-china.org.cn/sandt/ptr/SNWT-East-Route-prt.htm.
- van der Wink, G.R.M. Allen, J. Chapin, M. Crooks, W. Fraley, et al., 1998: Why the United States is becoming more vulnerable to natural disasters, Eos: Transactions of the American Geophysical Union, 79, pp. 533–7.
- Valette-Silver, N.N.J., 1993: The use of sediment cores to reconstruct historical trends in contamination of estuarine and coastal sediments, Estuaries, 16, pp. 577–88.
- Vörösmarty, C.J.K. Sharma, B. Fekete, A.H. Copeland, J. Holden, et al., 1997a: The storage and aging of continental runoff in large reservoir systems of the world, Ambio, 26, pp. 210–19.
- Vörösmarty, C.J., R. Wasson, and J.E. Richey (eds.), 1997b: Modeling the Transport and Transformation of Terrestrial Materials to Freshwater and Coastal Ecosystems: Workshop Report and Recommendations for IGBP Inter-Core Project Collaboration, IGBP Report no. 39, International Geosphere-Biosphere Programme Secretariat, Stockholm, Sweden.
- Vörösmarty, C.J., C.A. Federer, and A. Schloss, 1998a: Potential evaporation functions compared on U.S. watersheds: Implications for global-scale water balance and terrestrial ecosystem modeling, Journal of Hydrology, 207, pp. 147–69.
- Vörösmarty, C.J., C. Li, J. Sun, and Z. Dai, 1998b: Emerging impacts of anthropogenic change on global river systems: The Chinese example. In: Asian Change in the Context of Global Change: Impacts of Natural and Anthropogenic Changes in Asia on Global Biogeochemical Cycles, J. Galloway and J. Melillo (eds.), Cambridge University Press, Cambridge, UK, pp. 210–44.
- Vörösmarty, C.J. and M.M. Meybeck, 1999: Riverine transport and its alteration by human activities, International Geosphere-Biosphere Programme Global Change Newsletter, 39, pp. 24–9.
- Vörösmarty, C.J., P. Green, J. Salisbury, and R. Lammers, 2000: Global water resources: Vulnerability from climate change and population growth, Science, 289, pp. 284–8.
- Vörösmarty, C.J. and D. Sahagian, 2000: Anthropogenic disturbance of the terrestrial water cycle, BioScience, 50, pp. 753–65.
- Vörösmarty, C.J., 2002: Global change, the water cycle, and our search for Mauna Loa, Hydrological Processes, 16, pp. 1335–9.
- Vörösmarty, C.J., M. Meybeck, B. Fekete, K. Sharma, P. Green, et al., 2003: Anthropogenic sediment retention: Major global-scale impact from the population of registered impoundments, Global and Planetary Change, 39, pp. 169–90.
- Vörösmarty, C.J. and M. Meybeck, 2004: Responses of continental aquatic systems at the global scale: New paradigms, new methods. In: Vegetation, Water, Humans and the Climate, P. Kabat, M. Claussen, P.A. Dirmeyer, et al. (eds.), Springer, Berlin, Germany, pp. 375–413.
- Vörösmarty, C.J., E. Douglas, P. Green, and C. Revenga, 2005: Geospatial indicators of emerging water stress: An application to Africa, Ambio, 34(3), pp. 230–6.
- Walker, I., F. Ordonez, P. Serrano, and J. Halpern, 2000: Pricing, Subsidies and the Poor: Demand for Improved Water Services in Central America, Policy research working paper no. 2468, World Bank, Washington, DC.
- Walker, R.T. and W.D. Solecki, 1999: Managing land use and land cover change: The New Jersey Pinelands biosphere reserve, Annals of the Association of American Geographers, 89(2), pp. 220–37.
- Walling, D.E. and D. Fang, 2003: Recent trends in the suspended sediment loads of the world’s rivers, Global and Planetary Change, 39, pp. 111– 26.
- Wasson, R.J., 1996: Land Use and Climate Impacts on Fluvial Systems during the Period of Agriculture: Recommendations for a Research Project and Its Implementation, PAGES workshop report, Series 96 – 2, International Geosphere-Biosphere Programme-PAGES (Past Global Changes), Bern, Switzerland, 51 pp.
- WCD (World Commission on Dams), 2000: Dams and Development: A New Framework for Decision-Making,World Commission on Dams, Earthscan, London, UK.
- WEDO (Women’s Environment and Development Organization), 2004: Gender differences in water use and management. Available at www.wedo.org/ sus_dev/untapped3.htm.
- WHO (World Health Organization), 2001: WHO, Geneva, Switzerland. Available at http://www.worldwaterday.org/2001/disease/index.html.
- WHO, 2002: World Health Report 2002: Reducing Risks, Promoting Healthy Life, WHO, Geneva, Switzerland.
- WHO, 2004:World Health Report 2004: Changing History, WHO, Geneva, Switzerland.
- WHO/UNICEF (UN Children’s Program), 2000: Global Water Supply and Sanitation Assessment 2000 Report, WHO, Geneva, Switzerland/ UNICEF, New York, NY. Available at http://www.who.int/docstore/water_sanita tion_health/Globassessment/GlobalTOC.htm.
- WHO/UNICEF, 2004: Meeting the MDG Drinking Water and Sanitation Target: A Mid-term Assessment of Progress, WHO, Geneva, Switzerland/ UNICEF, New York, NY, 33 pp.
- Winpenny, J., 2003: Financing water for all: Report of the World Panel on Financing Water Infrastructure, World Water Council, Marseille, France, 54 pp.
- WMO (World Meteorological Organization), 1997: Comprehensive Assessment of the Freshwater Resources of the World, UN, UNDP, UNEP, FAO, UNESCO, WMO, United Nations Industrial Development Organization, World Bank, SEI, WMO, Geneva, Switzerland.
- Wolf, A., J. Natharius, J. Danielson, B.Ward, and J. Pender, 1999: International river basins of the world, International Journal of Water Resources Development, 15, pp. 387–427.
- Wolff, G. and P.H. Gleick, 2002: The soft path for water. In: The World’s Water 2002–2003: The Biennial Report on Freshwater Resources, P. Gleick (ed.), Island Press, Washington, DC, pp. 1–32.
- Wollheim, W.M., B.J. Peterson, L.A. Deegan, J.E. Hobbie, B. Hooker, et al., 2001: Influence of stream size on ammonium and suspended particulate nitrogen processing, Limnology and Oceanography, 46, pp. 1–13.
- World Bank, 1996a: World Bank Lending for Large Dams: A Preliminary Review of Impacts, Operations Evaluation Department, Precise number 125, 09/01/ 1996. Available at http://wbln0018.worldbank.org/oed/oeddoclib.nsf/0/ bb68e3aeed5d12a4852567f5005d 8d95?OpenDocument.
- World Bank, 1996b: Irrigation Investment in Pakistan, Operations Evaluation Department, Precise Number 124, 09/01/1996. Available at http://wbln0018 .worldbank.org/oed/oeddoclib.nsf /View+to+Link+WebPages/601AF76 831E9A1C0852567F5005D8D81?OpenDocument.
- World Bank, 2002. Shrimp Farming and the Environment: Can Shrimp Farming Be Undertaken Sustainably? Bangkok, Thailand: Network of Aquaculture Centres in Asia-Pacific. Online at: http://www.enaca.org/Shrimp/Publications.htm.
- World Bank, 2001: World Development Indicators 2001, The World Bank, Washington, DC.
- WRI (World Resources Institute), UNEP, UNDP, and World Bank, 1998: World Resources 1998–99: Environmental Change and Human Health, Oxford University Press, New York, NY.
- WSAT (Water Sector Assessment Team), 2000: Water: The Potential Consequences of Climate Variability and Change for the Water Resources of the United States, Lead author, P. Gleick, The Report of the Water Sector Assessment Team of the National Assessment of the Potential Consequences of Climate Variability and Change for the U.S. Global Change Research Program, USGS, Washington, DC.
- WWC (World Water Council), 2000: World Water Vision, Earthscan, London, UK.
- WWF and WRI (World Wide Fund for Nature and World Resources Institute), 2004: Rivers at Risk: Dams and the Future of Freshwater Ecosystems, WWF, Surrey, UK.
- Yue, S, P. Pilon, and B. Phinney, 2003: Canadian streamflow trend detection: Impacts of serial and cross-correlation, Hydrological Sciences Journal, 48(1), pp. 51–63.
- Zhang, L., W.R. Dawes, and G.R. Walker, 2001: Reponse of mean annual evapotranspiration to vegetation changes at catchment scale, Water Resources Research, 37, pp. 701–8.
Terms of Use
The copyright for material on this page is the property of the World Resources Institute. Click here for the Terms of Use (Ecosystems and Human Well-Being: Volume 1: Current State and Trends: Freshwater Ecosystem Services).
Disclaimer: This chapter is taken wholly from, or contains information that was originally written for the Millennium Ecosystem Assessment as published by the World Resources Institute. The content has not been modified by the Encyclopedia of Earth.
|
|