Fisheries and aquaculture in the Central North Atlantic (Iceland and Greenland)
This is Section 13.3 of the Arctic Climate Impact Assessment
Lead Authors: Hjálmar Vilhjálmsson, Alf Håkon Hoel; Contributing Authors: Sveinn Agnarsson, Ragnar Arnason, James E. Carscadden, Arne Eide, David Fluharty, Geir Hønneland, Carsten Hvingel, Jakob Jakobsson, George Lilly, Odd Nakken,Vladimir Radchenko, Susanne Ramstad,William Schrank, Niels Vestergaard,Thomas Wilderbuer
This section deals with the marine ecosystems of Iceland and Greenland. Although there are large differences, both physical and biological, between these two ecosystems there are also many similarities.Seafood exports represent a major source of revenue for both Iceland and Greenland. Figure 13.5 shows the locations of the sites referred to most frequently in the text.

Figure 13.5. Location map for the Iceland/Greenland area. The arrows show the main surface ocean currents[1](Source: ACIA)
The waters around Iceland are warmer than those around Greenland due to a greater Atlantic influence and are generally ice-free under normal circumstances. Exceptions are infrequent and usually last for relatively short periods in late winter and spring when drift ice may come close inshore and or even become landlocked off the north and east coasts. However, drift ice has been known to surround Iceland during cold periods, such as during the winter of 1918. Greenlandic waters are colder, sea-ice conditions more severe, and ports on the coastline commonly close for long periods due to the presence of winter sea ice and icebergs.
The reason for treating these apparently dissimilar ecosystems together is the link between the stocks of Atlantic cod at Iceland and Greenland. There is a documented drift of larval and 0-group cod (in its first year of life) from Iceland to Greenland with the western branch of the warm Irminger Current[2]. Spawning migrations in the reverse direction have been confirmed by tagging experiments[3]. There are, however, large variations in the numbers of cod and other fish species that drift from Iceland to Greenland and not all these fish return to Iceland as adults.
The history of fishing the waters around Iceland and Greenland dates back hundreds of years but is mainly centered on Atlantic cod, the preferred species in northern waters in olden times. Icelandic waters are usually of a cold/temperate nature and are therefore relatively more species-rich than those of colder Greenland. Consequently, with the diversification of fishing gear and vessel types in the late 19th century and the beginning of the 20th century, numerous other fish species, both demersal and pelagic, began to appear in catches from Icelandic waters. The Greenlandic marine environment is much colder and commercially exploitable species are therefore fewer. Present-day catches from Greenland only comprise nine demersal fish species, two pelagic fish species, and three species of invertebrates. There is currently almost no catch of cod at Greenland.
Whale products feature in Icelandic export records from 1948 until the whaling ban (zero quotas) was implemented in 1986, but their value was never a significant component of exported seafood. Iceland has a long history of hunting porpoises, seals, and seabirds, and gathering seabird eggs for domestic use. Although this hunting and gathering gradually decreased with time, it is still a traditional activity in some coastal communities. For Greenland, several species of marine mammals (at least five different whale species, five species of seals, plus walrus) and six species of seabird are listed in catch statistics. Catches of marine mammals and seabirds are still important in Greenland, culturally and socially, as well as in terms of the local economy.
Contents
- 1 Ecosystem essentials (13.3.1)
- 2 Fish stocks and fisheries (13.3.2)
- 3 Past climatic variations and their impact on commercial stocks (13.3.3)
- 4 Possible impacts of climate change on fish stocks (13.3.4)
- 5 The economic and social importance of fisheries (13.3.5)
- 6 Economic and social impacts of climate change: possible scenarios (13.3.6)
- 7 Ability to cope with change (13.3.7)
- 8 Concluding comments (13.3.8)
- 9 References
- 10 Citation
Ecosystem essentials (13.3.1)
The marine ecosystem around Iceland is located south of the Polar Front in the northern North Atlantic (Fig. 13.5). The area to the south and west of Iceland is dominated by the warm and saline Atlantic water of the North Atlantic Current, the most important component being its westernmost branch, the Irminger Current (Fig. 13.5). The Irminger Current bifurcates off the northern west coast of Iceland. The larger branch flows west across the northern Irminger Sea towards Greenland. The smaller branch is advected eastward onto the North Icelandic shelf where the Atlantic water (Seawater) mixes with the colder waters of the East Icelandic Current, an offshoot from the cold East Greenland Current. On the shelf north and east of Iceland the degree of mixing increases in the direction of flow and the influence of Atlantic water is therefore lowest on the East Icelandic shelf as shown in Fig. 13.6. Hydrobiological conditions are relatively stable within the domain of the Atlantic water to the south and west of Iceland, while there may be large seasonal as well as interannual variations in the hydrography and levels of biological production in the mixed waters on the north and east Icelandic shelf[4], depending on the intensity of the flow of Atlantic water and the proximity of the Polar Front. Large variations in the flow of Atlantic water onto the shelf area north of Iceland on longer timescales have also been demonstrated[5].

Figure 13.6. The main water masses in the Iceland–East Greenland–Jan Mayen areas. The larval drift is driven by the two branches of the Irminger Current, which splits to the west of northwest Iceland[6]. (Source: ACIA)
The East Greenland Current carries polar water (Seawater) south over the continental shelf off the east coast of Greenland and after rounding Cape Farewell (about 60º N; 43º W) continues north along the west coast. Off the east coast, the temperature of these cold polar waters may be ameliorated by the warmer Atlantic waters of the Irminger Current, especially near the shelf break and on the outer parts of the shelf (see Fig. 13.5). Off West Greenland, the surface layer is dominated by cold polar water, while relatively warm mixed water of Atlantic origin is found at depths between 150 and 800 meters (m), north to about 64º N. Mixing and diffusion of heat between these two layers, as well as changes in the relative strength of their flow, are fundamental in determining the marine climatic conditions and the levels of primary and secondary production off West Greenland[7].
The Irminger Current is also important as a transport mechanism for juvenile stages of various species of fish (Fig. 13.6). Thus, its eastern branch plays a dominant role in transporting fish fry and larvae from the southern spawning grounds to nursing areas on the shelf off northwest, north, and east Iceland, while the western branch may carry large numbers of larval and 0-group fish across the northern Irminger Sea to East Greenland and from there to nursery areas in southern West Greenland waters. The main ocean currents in the Iceland/Greenland area are shown in Fig. 13.5.
The Icelandic marine ecosystem contains large stocks of zooplankton such as calanoid copepods and krill, which are eaten by adult herring and capelin, adolescents of numerous other fish species, and by baleen whales. The larvae and juveniles of both pelagic and demersal fish also feed on eggs and juvenile stages of the zooplankton. Benthic animals are also important in the diet of many fish species, especially haddock, wolffish (Anarhichas lupus), various species of flatfish, and cod.
Owing to the influence of warm Atlantic water (Seawater), the fauna of Icelandic waters is relatively species-rich and contains over 25 commercially exploited stocks of fish and marine invertebrates. In contrast, there are only a few commercial fish and invertebrate species in Greenlandic waters[8] and these are characterized by cold water species such as Greenland halibut, northern shrimp, capelin, and snow crab. Redfish are also found, but mainly in Atlantic waters outside the cold waters of the East Greenland continental shelf and cod can be plentiful at West Greenland in warm periods.
Around Iceland, most fish species spawn in the warm Atlantic water off the south and southwest coasts. Larvae and 0-group fish drift westward and then northward from the spawning grounds to nursery areas on the shelf off northwest, north, and east Iceland, where they grow in a mixture of Atlantic and Arctic water[9]. Larval and 0-group cod and capelin, as well as species such as haddock, wolffish, tusk (Brosme brosme), and ling (Molva molva) may also be carried by the western branch of the Irminger Current across to East Greenland and onward to West Greenland[10] (see Fig. 13.6). The drift of larval and 0-group cod to Greenland was especially extensive during the 1920s and 1940s.

Fig. 13.7. Distribution and migration of capelin in the Iceland–Greenland–Jan Mayen area.[3]
Capelin is the largest fish stock in the Icelandic marine ecosystem. Unlike other commercial stocks, adult capelin undertake extensive feeding migrations northward into the cold waters of the Denmark Strait and the Iceland Sea during summer. The capelin return to the outer reaches of the north Iceland shelf in October/November from where they migrate to the spawning grounds south and west of Iceland in late December/early January. Spawning is usually over by the end of March. Capelin are especially important in the diet of small and medium-sized cod[11]. Most juvenile capelin aged 0, 1, and 2 years reside on or near the shelf off northern Iceland and on the East Greenland plateau west of the Denmark Strait (Fig. 13.7). These components of the stock are therefore accessible to fish, marine mammals, and seabirds throughout the year. On the other hand, the summer feeding migrations of maturing capelin into the colder waters of the Denmark Strait and the Iceland Sea place the larger part of the adult stock out of reach of most fish, except Greenland halibut, for about five to six months. However, these capelin are then available to whales, seals, and seabirds. During the feeding migrations, adult capelin increase 3- to 4-fold in weight and their fat content increases from a few percentage points up to 15 to 20%. When the adult capelin return to the north Icelandic shelf in autumn they are preyed on intensively by a number of predators, apart from cod, until the end of spawning in the near-shore waters to the south and west of Iceland. Thus, adult capelin represent an enormous energy transfer from arctic regions to important commercial fish stocks in Icelandic waters proper[12].
Off West Greenland, northern shrimp and Greenland halibut spawn at the shelf edge off the west coast. This is also the case for the northern shrimp stock, which is found in the general area of the Dohrn Bank, about mid-way between East Greenland and northwest Iceland. Greenlandic waters also contain capelin populations that spawn at the heads of numerous fjords on the west and east coasts. These capelin populations appear to be self-sustaining and local, feeding at the mouths of their respective fjord systems and over the shallower parts of the shelf area outside these fjords[13]. During the warm period from the early 1930s until the late 1960s there was also an extensive spawning of cod to the southeast, southwest, and west of Greenland[14].
In the pelagic ecosystem off Greenland the population dynamics of calanoid copepods and to some extent krill play a key role in the food web, being a direct link to fish stocks, baleen whales, and some important seabirds, such as little auk (Alle alle) and Brünnich’s guillemot (Uria lomvia). But polar cod, capelin, sand eel (Ammodytes spp.), and squid (Illex illecebrosus) are probably the most important pelagic/semi-pelagic macrofauna acting as forage for fish such as Greenland halibut and cod, marine mammals, and seabirds. Benthic animals are also important. Northern shrimp is a major food item for Atlantic cod and many other species of fish and marine mammals[15].
Fish stocks and fisheries (13.3.2)
Atlantic Cod
Historically, demersal fisheries at Iceland and Greenland fall into two categories: land-based fisheries conducted by local inhabitants, and those of distant water foreign fleets. For centuries the main target species was cod. Until the late 19th century, the local fisheries were primarily conducted with open rowboats, while the distant water fishing fleets consisted of much larger, decked ocean-going sailing vessels. Until the end of the 19th century, almost all fishing for demersal species, whether from small open rowboats or larger ocean-going sailing vessels, was by hand lines.

Figure 13.8. Total catch from Icelandic fishing grounds, 1905–2002 (data from the Icelandic Directorate of Fisheries and the Marine Research Institute). (Source: ACIA)
Jónsson[16] estimated that the combined landings by Icelandic, Dutch, and French fishing vessels were around 35,000t per year for the period 1766 to 1777. One hundred years later, the combined French and Icelandic catches averaged about 55,000t per year. From the subsequent development of fishing effort and knowledge of stock sizes and exploitation rates, it is obvious that even large fleets of several hundred sailing vessels and open rowboats, fishing with primitive hand lines, can not have had a serious effect on the abundant cod stock and other demersal species at Iceland.
This situation changed dramatically with the introduction of steam and combustion engines to the fishing fleet, and the adoption of active fishing gear at the turn of the 19th century. By the beginning of the 20th century the otter trawl had been adopted by the foreign fleet[17], while the smaller motor powered Icelandic boats began to use gill nets, long lines, and Danish seines. Landings from the Icelandic area were no longer almost exclusively cod, but species such as haddock, halibut, plaice (Pleuronectes platessa), and redfish (Sebastes marinus) also became common items of the catch. The demersal catch at Iceland is estimated to have increased from about 50,000t in the 1880s to about 160,000t in 1905, reaching 250,000t just before the First World War. Although cod was still the most important species, the proportion of other demersal species landed had increased to about 30% (Fig. 13.8).
With the increasing effort and efficiency of the international distant water and local fishing fleets, cod catches in Icelandic waters increased to peak at 520,000t in 1933, while the catch of other demersal species increased to about 200,000t (Fig. 13.8).
Catches declined during the late 1930s, while the exploitation rate increased until the fishing effort fell drastically due to the Second World War. Nevertheless, the exploitation rate of cod remained at a moderate level due to recruitment from the superabundant 1922 and 1924 year classes[18]. After the Second World War, catches of demersal fish from Icelandic grounds increased again. Landings peaked at about 860,000t in 1954, with cod accounting for about 550,000t (Fig. 13.8). Because of the very strong 1945 cod year class and good recruitment to other demersal stocks, the exploitation rate of cod and other demersal species remained at a low level, although almost 50% higher than during the late 1920s and early 1930s. From 1955, the exploitation rate of all demersal stocks at Iceland, but especially that of cod, increased rapidly and with few exceptions has since been far too high. Until 1976, this was due to the combined effort of Icelandic and foreign distant water fleets. However, since the extension of the Icelandic EEZ (Exclusive Economic Zone) to 200 nautical miles in 1977, the high rate of fishing has continued due to the enhanced efficiency of Iceland’s fishing fleet.
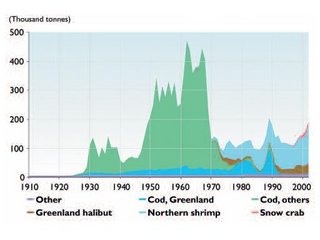 Figure 13.9. Total catch off West Greenland, 1900–2002 (data from the Greenland Statistical Office and Directorate of Hunting and Fishing). (Source: ACIA)
 Although cod has been fished intermittently off West Greenland for centuries, the success of the cod fishery at Greenland has been variable. Despite patchy data from the 17th and 18th centuries, there is little doubt that cod abundance at West Greenland fluctuated widely[19]. Information from the 19th century suggests that cod were plentiful in Greenlandic waters until about 1850. After that there seems to have been very few cod on the banks and in inshore waters off Greenland until the late 1910s to early 1920s, when a small increase in the occurrence of cod in inshore areas was noted[20]. Cod were also registered in offshore regions off West Greenland in the late 1920s, where fisheries by foreign vessels expanded quickly and catches increased from about 5,000t in 1926 to 100,000t in 1930. From then until the end of the Second World War in 1945, this fishery yielded annual catches between about 60,000 and 115,000t (Fig. 13.9). The total cod catch reached about 200,000t by 1950 and then fluctuated around 300,000t between 1952 and 1961. After that the cod catch increased dramatically and landings varied from about 380,000 to 480,000t between 1962 and 1968. By 1970, the catch had fallen to 140,000t and was, with large variations, within the range 10,000 to 150,000t until the early 1990s (Fig. 13.9). Since 1993, almost no Atlantic cod has been caught in Greenlandic waters. Before the introduction of the 200 nm EEZ around Greenland in 1978 the cod fishery was mostly conducted by foreign fleets, but since then the Greenlandic fleet has dominated the fishery.
Greenland halibut
An Icelandic Greenland halibut (Reinhardtius hippoglossoides)fishery began in the early 1960s (Fig. 13.8). Initially, long line was the main fishing gear but this method was abandoned because killer whales (Orcinus orca) removed more than half the catch from the hooks. Since the early 1970s this fishery has been conducted using otter trawls.
At Greenland, a fishery for Greenland halibut began in a very modest way around 1915 and had by 1970 only reached an annual catch of about 2,700t, most of which was taken by Greenland. From 1970 to 1980 other countries participated in the Greenland halibut fishery, which peaked in 1976 at about 26,000t. By 1980 the catch had fallen to about 7,000t. During the 1990s, the catch increased rapidly to about 25,000t in 1992 and was in the range of 30,000 to 35,000 during 1998 to 2002. Since 1980, foreign vessels have not played a significant role in the Greenland halibut fishery off West Greenland. The total catch of Greenland halibut in West Greenland waters is shown in Fig. 13.9.
Northern shrimp
A small inshore fishery for northern shrimp began in Icelandic waters in the mid-1950s. Initially, this was a fjordic fishery of high value to local communities. An offshore shrimp fishery, which began in the mid-1970s on the outer shelf off the western north coast, soon expanded to more eastern areas. Annual landings from this fishery increased to between 25,000 and 35,000t in the late 1980s and to between 45,000 and 75,000t in the 1990s. Recently, catches have declined drastically, both in offshore and coastal areas (Fig. 13.8).
The catch of northern shrimp off West Greenland has increased steadily since its beginning in 1960. At the outset, this species was fished only by the Greenlandic fleet, but from 1972 large vessels from other countries joined this fishery. This led to a large increase in the total catch of northern shrimp, which peaked at about 61,000t in 1976. Between 1976 and the early 1980s, the catch by other countries decreased and has been insignificant since. On the other hand, the Greenlandic catch increased steadily, from a total catch in 1960 of about 1,800t to 132,000 t in 2002 as shown in Fig. 13.9.
Herring
Commercial fishing for herring started at Iceland in the 1860s when Norwegian fishermen initiated a land-based fishery on the north and east coasts using traditional Scandinavian beach seines. This fishery proved very unstable and was abandoned in the late 1880s. Drift netting was introduced at the turn of the 19th century and purse seining in the early 20th century (1904). The latter proved very successful off the north coast, where the herring schools used to surface regularly, while drift nets had to be used off the south and west coasts where the herring rarely surfaced. The north coast herring fishery increased gradually during the 1920s and 1930s and had reached 150,000 to 200,000t by the beginning of the 1940s (Fig. 13.8). During this period, the fishery was limited mainly by lack of processing facilities. Around 1945 the herring behavior pattern changed and as a result purse seining for surfacing schools north of Iceland became ineffective and catches declined. The reasons for this change in behavior have never been identified.
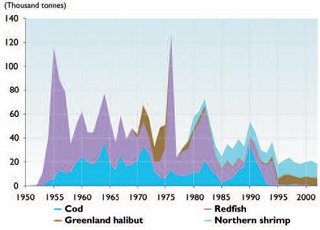 Figure 13.10. Total catch off East Greenland, 1950–2002 (data from the Greenland Statistical Office and Directorate of Hunting and Fishing). (Source: ACIA)
 Horizontally ranging sonar, synthetic net fibers, and hydraulic power blocks for hauling the large seine nets were introduced to the herring fishery during the late 1950s and early 1960s[21].These technical innovations, as well as better knowledge of the migration routes of the great Atlanto-Scandian herring complex (i.e., Norwegian spring-spawning herring and much smaller stocks of Icelandic and Faroese spring-spawning herring), lead to an international herring boom in which Icelandic, Norwegian, Russian (USSR), and Faroese fishermen were the main participants (for Icelandic catches see Fig. 13.8). This extraordinary herring fishery ended with a collapse of the Atlanto-Scandian herring complex during the late 1960s due to overexploitation (Overfishing) of both adults and juveniles. Catches of Atlanto-Scandian herring (now called Norwegian spring-spawning herring since the Icelandic and Faroese components have not recovered) in the Icelandic area have been negligible since the late 1960s and Iceland’s share of the TAC (Total Allowable Catch) of this herring stock since the mid-1990s has mainly been taken outside Icelandic waters. There is no fishery for herring at Greenland.
It took the Norwegian spring-spawning stock about two and a half decades to recover despite severe catch restrictions. Both the Icelandic spring- and summer-spawning herring suffered the same fate. Retrospective analysis of historical data shows that there were no more than 10,000 to 20,000t left of the Icelandic summer-spawning herring stock in the late 1960s/early 1970s[22]. A fishing ban was introduced and since 1975 the fishery has been regulated, both by area closures and minimum landing size, as well as by having a catch rule corresponding to a TAC of roughly 20% of the estimated adult stock abundance in any given year. The stock recovered gradually, is at a historical high at present, and the annual yield over the 1980s and 1990s was on average about 100,000t.
Capelin
An Icelandic capelin fishery began in the mid-1960s and within a few years replaced the rapidly dwindling herring fishery, as was also witnessed in the Barents Sea[23].The capelin fishery is conducted by the same high-technology fleet as used for catching herring. During the first eight to ten years, the fishery only pursued capelin spawning runs in near-shore waters off the southwest and south coasts of Iceland in February and March and annual yields increased to 275,000t. In 1972, the fishery was extended to deep waters east of Iceland in January, resulting in an increase in the annual catch by about 200,000t. In 1976, an oceanic summer fishery began north of Iceland and in the Denmark Strait. In 1978, the summer fishery became international as it extended north and northeast into the [[EEZ]s] of Greenland and Jan Mayen (Norway). Within two years the total seasonal (July to March) capelin catch increased to more than one million t. Total annual international landings of capelin from this stock during 1964 to 2002 are shown in Fig. 13.8.
Historically, capelin have been caught at Greenland for domestic use and animal fodder. A small commercial fishery for roe-bearing females began at West Greenland in 1964 with a catch of 4,000t, which is also the largest catch on record. There were relatively large fluctuations in the capelin catch from 1964 to 1975, but since then the catch has been insignificant. This fishery is conducted by Greenlanders.
Blue Whiting
The most recent addition to Icelandic fisheries is that of the semi-pelagic blue whiting. This is a straddling species commonly encountered in that part of the Icelandic ecosystem dominated by Atlantic water, i.e., off the west, south, and southern east coast. A small blue whiting fishery began in the early 1970s, increased to about 35,000t in 1978 and then dwindled to 105t in 1984. There was renewed interest in this fishery in the mid-1990s and from 1997 to 2002 the blue whiting catch increased from 10,000 to 285,000 t (Fig. 13.8).
Fisheries off East Greenland
East Greenland waters have been fished commercially only since the Second World War (Fig. 13.10). The main reason for this is the rough bottom topography as well as the speed and irregularity of the ocean currents, especially near the edge of the continental shelf. These conditions render it difficult to fish East Greenland waters except with large powerful vessels and robust fishing gear. The main species that have been fished commercially off East Greenland are Greenland halibut, northern shrimp, cod, and redfish. With the exception of northern shrimp since the 1980s, the fisheries off East Greenland have almost exclusively been conducted by foreign fleets.
Marine mammals and sea birds
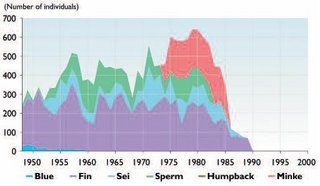 Figure 13.11. Catch of large whales at Iceland, 1948–2000 (data from the Icelandic Directorate of Fisheries and the Marine Research Institute). (Source: ACIA)
 The Icelandic marine ecosystem contains a number of species of large and small whales, most of which are migratory. Commercial whaling has been conducted intermittently in Iceland for almost a century. Initially, large Norwegian whaling stations were operated from the mid-1880s until the First World War, first on the Vestfirdir peninsula (northwest Iceland) and later on the east coast. By about 1912, stocks had become depleted to the extent that whaling was no longer profitable and in 1916 the Icelandic Parliament passed an act prohibiting all whaling. In the following decades whale stocks gradually recovered and from 1948 until zero quotas on whaling were set in 1986, a small Icelandic company operated with four boats from a station on the west coast, just north of Reykjavík. The main target species were fin (Balaenoptera physalus), sei (B. borealis), and sperm (Physeter catodon) whales and the average yearly catches were 234, 68, and 76 animals respectively. In addition, 100 to 200 (average 183) minke whales were taken annually by small operators between 1974 and 1985. Although never commercially important at a national level, whaling was very profitable for those engaged in the industry. Icelandic whale catches by species are shown in Fig. 13.11.
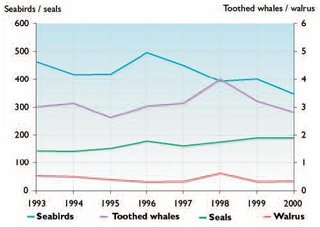 Figure 13.12. Greenland catch of marine mammals and seabirds, 1993–2000 (data from the Greenland Statistical Office and Directorate of Hunting and Fishing). (Source: ACIA)
 The numbers of seals in Icelandic waters are comparatively small. The populations of the two main species, harbour seals and grey seals, are estimated at 15,000 and 6,000 animals, respectively[24]. Harbour seal abundance is stable while the numbers of grey seals have decreased. Sealing has never reached industrial proportions in Iceland, the total number of skins varying between 1,000 and 7,000 annually since the 1960s.
Although foreign fleets have pursued large-scale whaling in Greenlandic waters, native Greenlanders have hunted whales for domestic use only. Harvest of the main species has been modest and is unlikely to have had any effect on stocks. Five seal species are exploited in Greenland, with harp and ring (Phoca hispida) seals by far the most important. Ringed seal catches increased from the mid-1940s until the late 1970s and then dropped until the mid-1980s after which they increased. The harp seal catches increased until the 1960s at which point they began to decrease and were very low during the 1970s. Since then, harp seal catches have increased continuously and at the time of writing were higher than ever.
Greenlandic catches of whales, seals, walrus, and seabirds between 1993 and 2000 are shown in Fig. 13.12. Sealskin prices were subsidized in Greenland when prices started to decline on the world market and sealskin campaigns are thought unlikely to have influenced hunting effort for seals in Greenland. There have, however, been indirect positive effects, in that Canadian catches (Labrador plus Newfoundland) of both species fell dramatically and the harp seal population increased to double its size within a relatively few years. The decrease in ringed seal catches during the early 1980s coincided with the sealskin campaign, but the underlying cause was probably population dynamics, triggered by climatic fluctuations[25].
Aquaculture
In the late 1970s and 1980s there was much interest in aquaculture in Iceland. A number of facilities were developed for the cultivation of salmon, rainbow trout (Salmo gairdneri), and Arctic char (Salvelinus alpinus) at various sites on the coast. Practically all failed, either for financial reasons or lack of expertise, or both. The few that survived, or were rebuilt on the ruins of others, have until recently not produced much more than necessary for the domestic market.
In comparative terms, aquaculture has therefore been of little economic importance for Iceland in the past. However, renewed interest began in the 1990s. Iceland is once again investing heavily in fish farming – but this time it is private capital rather than short-term loans or state funding which governs the progress. The largest quantitative increase will almost certainly be in salmon. Total production in 2001 was around 4,000t of salmon and related species. It is expected that by 2010 the production of these species will have increased to around 25,000 to 30,000t. In addition, there is increased interest and success in the farming of Atlantic halibut, sea bass (Dicentrachus labrax), turbot (Psetta maxima), cod, and some other marine fish, and recently there has been a considerable increase in the production of abalone (Haliotis rufuscens) and blue mussel (Mytilus edulis).
Despite fish farmers working closely with the industry and with researchers to accelerate growth in production of both salmonids and whitefish species, it is expected to be a few more years before the industry is operating smoothly. Area conflicts with wild salmon have not been resolved, cod farming is still at the fry stage, and char – a high price product – has a limited market. Nevertheless, aquaculture is being developed to become more than an extra source of income and as a consequence, major fisheries companies are investing in development projects in this sector.
Aquaculture was attempted in Greenland in the 1980s. The experiment failed and aquaculture is not conducted in Greenland at the present time.
Past climatic variations and their impact on commercial stocks (13.3.3)
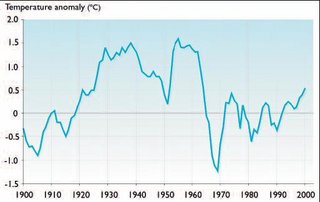
The main climate change over the Nordic Seas and in the northwest North Atlantic over the 20th century was a rise in air temperature during the 1920's and 1930's with a concurrent increase in sea temperature and a decrease in drift ice. There was distinct cooling in the 1940's and early 1950's followed by reversal to conditions similar to those of the 1920's and 1930's. These changes and their apparent effect on marine biota and commercial stocks in Icelandic and Greenlandic waters were studied and reported on by a number of contemporary researchers[27]. Summaries have been given by, for example, Buch et al.[28] and Vilhjálmsson[29].
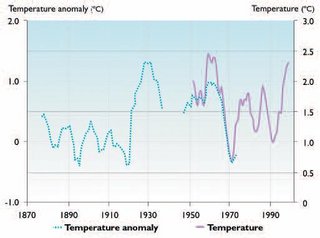
Figure 8 shows five-year running averages of sea surface temperature anomalies off the central north coast of Iceland and illustrates trends in the physical marine environment of Icelandic waters over the 20th century. The main features are an increased flow of Atlantic water onto the shelf north of Iceland between 1920 and 1964 followed by a sudden cooling in 1965 to 1971 and more variable conditions since then. A strong presence of Atlantic water on the north and east Icelandic shelf promotes vertical mixing and thus favors both primary and secondary production, i.e., prolongs algal blooms and increases zooplankton biomass. Greenland also experienced a climatic warming in the 1920's probably with similar effects on the lowest levels of the food chain (Fig. 9).
At Iceland, one of the most striking examples of the effects of the climatic warming during the 1920's was a mass spawning of cod off the north and east coasts in addition to the usual spawning off south and west Iceland[31]. Furthermore, there was large-scale drift of larval and 0-group cod across the northern Irminger Sea to Greenland in 1922 and 1924[32].
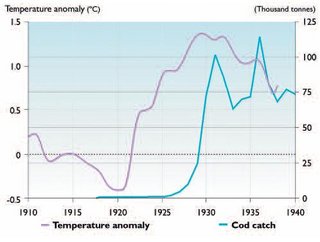
Changes in the marine fish fauna off West Greenland were even more spectacular than those off Iceland. There was a large increase in cod abundance and catches in the 1920s (Fig. 13.15), and other gadids, such as saithe, haddock, tusk, and ling, previously rare or absent at Greenland, also appeared there in the 1920s and 1930s. Furthermore, herring appeared in large numbers off West Greenland in the 1930s and began to spawn there in the period July through September, mainly south of 65º N[33]. These herring spawned near beaches, similar to capelin in these waters. Like capelin, herring are bottom spawners with their eggs adhering to the substrate or even, as in this case, the fronds of seaweed. In 1937, the northernmost distribution of adult herring reached 72º N[34]. However, a herring fishery of commercial scale has never been pursued at Greenland.
In the early 1900s capelin were very common at West Greenland between Cape Farewell and Disko Bay (Fig. 13.15), but unknown further north[35]. In the 1920's and 1930's, the center of the West Greenland capelin populations gradually shifted north and capelin became rare in their former southern area of distribution. By the 1930s, the main spawning had shifted north by 400nm (nautical miles) to the Disko Bay region (Fig. 13.15). Off East Greenland capelin have gradually extended their distribution northward along the coast to Ammassalik[36]. However, capelin are an arctic species and have probably been common in that area for centuries since Ammassalik means “the place of capelin”.
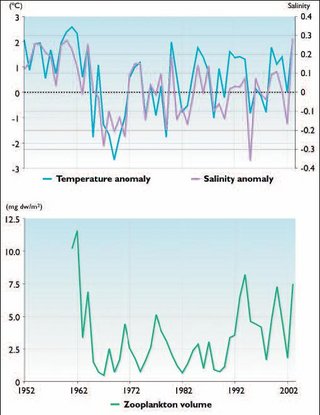
During the latter half of the 1960s there was a sudden and severe climatic cooling with an associated drop in sea temperature, salinity, and plankton production (Fig. 13.16), and an increase in sea ice to the north and east of Iceland[38]. Temperatures increased again in the 1970's, but were then more variable during the previous warm period. The low sea temperatures were also recorded in West Greenland waters (Fig. 9). This low-temperature, low-salinity water (Seawater) (the “Great Salinity Anomaly”) drifted around the North Atlantic and had noticeable, and in some cases serious, effects on marine ecosystems[39].
In the Icelandic area, herring was the fish species most affected by the cold conditions of the 1960s[41]. This is not surprising as herring are plankton feeders and in north Icelandic waters are near their limit of distribution. This was manifested in large-scale changes in migrations and distribution (see Fig. 9.19) and a sudden and steep drop in abundance (which however was mostly brought about by overfishing). The abundance of the Norwegian spring-spawning herring stock increased dramatically in the 1990s (see Section 13.2.2.5 (Fisheries and aquaculture in the Central North Atlantic (Iceland and Greenland))) and regained some semblance of its previous feeding pattern (for an overview of these changes see Chapter 9 (Fisheries and aquaculture in the Central North Atlantic (Iceland and Greenland))). Presently, Norwegian spring-spawning herring still overwinter in the Lofoten area on the northwest coast of Norway. Whether and when they revert completely to the “traditional” distribution and migration pattern cannot be predicted.
The two Icelandic herring stocks, i.e., the spring- and summer-spawning herring stocks, suffered the same fate. The spring-spawning stock still shows no sign of recovery, while the summer-spawning stock recovered a few years after a fishing ban was imposed in the early 1970s[42]. It seems that, like the West Greenland cod, the Icelandic spring-spawning herring had difficulties in self propagation in cold periods and would probably have collapsed in the late 1960s and early 1970s, even without a fishery[43]. The summer-spawning herring, on the other hand, have adapted much better to variability in Icelandic waters. For all three stocks it can be concluded that environmental adversities placed them under reproductive stress and disrupted feeding and migration patterns. Environmental stress, coupled with far too high fishing pressure on both adults and juveniles, resulted in the actual collapses of these herring populations.
While the growth rate of Icelandic capelin has shown a significant positive correlation with temperature and salinity variations in the north Icelandic area since the mid-1970s, this relationship probably describes feeding conditions in the Iceland Sea rather than a direct effect of temperature[44]. Results of attempts to relate recruitment of the Icelandic capelin stock to physical and biological variables, such as temperature, salinity, and zooplankton abundance, have been ambiguous. Nevertheless, judging by their stock size, the Icelandic capelin, which spawn in shallow waters off the south and west coasts of Iceland, seem to have been successful in recent decades and probably also in most years during the latter half of the 20th century.
However, at the peak of warming in the late 1920s and the first half of the 1930s, it was noted that capelin had ceased to spawn on the traditional grounds off the south and west coasts of Iceland and spawned instead off the easternmost part of the south coast as well as in fjords and inlets on the southeast and north coasts[45]. Sæmundsson noted that the cod had become unusually lean and attributed this to lower capelin abundance (see note 44). Although there can be other causes of reduced growth of cod, e.g., competition due to a large stock size, Sæmundsson’s conclusion may have been correct. The change in capelin spawning areas he described is probably disadvantageous for this capelin stock, the reason being that suitable spawning areas would be much reduced compared to those previously and presently occupied by the stock. Furthermore, larval drift routes could be quite different and a proportion of the larvae would probably end up in the western Norwegian Sea and be spread to regions where their survival rate might be much lower.
The catch history and series of stock assessments of northern shrimp in deep waters northwest, north, and east of Iceland, as well as at Greenland are too short for establishing links with environmental variability. Being a frequent item in the diet of small and medium-sized cod, stocks of northern shrimp are likely to be larger when cod abundance is low. However, in general terms, the stock probably benefits from cooler sea [[temperature]s], possibly through both enhanced recruitment and a reduced overlap of shrimp and cod distribution.
Possible impacts of climate change on fish stocks (13.3.4)
To project the effects of climate change on marine ecosystems is a very difficult task, despite knowing the effects of previous climatic change. Previous sections described how the marine climate around Iceland changed over the 20th century, from a cold to a warm state in the 1920s, lasting with some deviations for about 45 years, with a sudden cooling in 1965 which lasted until 1971. Since then, conditions have been warmer but variable and [[temperature]s] have not risen to the 1925 to 1964 levels. Available evidence suggests that, as a general rule, primary and secondary production and thereby the carrying capacity of the Icelandic marine ecosystem is enhanced in warm periods, while lower temperatures have the reverse effect. Within limits, this is a reasonable assumption since the northern and eastern parts of the Icelandic marine ecosystem border the Polar Front, which may be located close to the coast in cold years but occurs far offshore in warm periods when levels of biological production are enhanced through nutrient renewal and associated mixing processes, resulting from an increased flow of Atlantic water onto the north and east Icelandic plateau.
Over the last few years the salinity and temperature levels of Atlantic water (Seawater) off south and west Iceland have increased and approached those of the pre-1965 period. At the same time, there have been indications of increased flow of Atlantic water onto the mixed water areas over the shelf north and east of Iceland in spring and, in particular, in late summer and autumn. This may be the start of a period of increased presence of Atlantic water, resulting in higher temperatures and increased vertical mixing over the north Icelandic plateau, but the time series is still too short to enable firm conclusions.
However, there are many other parameters which can affect how an ecosystem and its components, especially those at the upper trophic levels, will react to changes in temperature, salinity, and levels of primary and secondary production. Two of the most important are stock sizes and fisheries, which are themselves connected. Owing to high fishing pressure since the early 1970s, most of the important commercial fish stocks in Icelandic waters are smaller than they used to be, and much smaller than at the onset of the warming period in the 1920s. Associated with this are changes in age and size distributions of spawning stocks; spawners are now fewer, younger, and smaller. These changes can affect reproductive success through decreased spawning areas and duration of spawning, smaller eggs of lower quality, and changes in larval drift routes and survival rates[46]. It is unlikely that the response of commercial fish stocks to a warming of the marine environment at Iceland, similar to that of the 1920s and 1930s, will be the same in scope, magnitude, and speed as occurred then. Nevertheless, a moderate warming is likely to improve survival of larvae and juveniles of most species and thereby contribute to increased abundance of commercial stocks in general. The magnitude of these changes will, however, be no less dependent on the success of future fishing policies in enlarging stock sizes in general and spawning stock biomasses in particular, since the carrying capacity of Icelandic waters is probably about two to three times greater than that needed by the biomass of commercial species in the area at present.
The following sections describe three possible scenarios of warming for the marine ecosystems of Iceland and Greenland and attempt to project the associated biological and socio-economic changes.
No climate change
Although the marine climate may dictate year-class success in some instances, there is little if any evidence to suggest that year-class failure and thereby stock propagation is primarily due to climate-related factors. Therefore, assuming no change from the ACIA baseline climate conditions of 1981–2000, the development and potential yield in biomass of commercial stocks will in most cases depend on effective rational management, i.e., a management policy aimed at increasing the abundance of stocks through reduced fishing mortalities and protection of juveniles. This is the present Icelandic policy. Although it has not yet resulted in much tangible success, it should eventually do so and with a speed that largely depends on how well incoming year classes of better than average size can be protected from being fished as adolescents.
A successful fishing policy of this kind should ensure an increase in the abundance of many demersal fish stocks by around 2030. This would considerably increase the sustainable yield from these stocks compared to the present. This could also apply for the Icelandic summer-spawning herring, although that stock is already exceeding its historical maximum abundance. The increase in yield in tonnes is, however, not directly proportional to increase in stock abundance. Thus, a doubling of the fishable biomass of the Icelandic cod stock would probably increase its long-term sustainable yield in tonnes by about 20 to 30% compared to the present annual catch of about 200,000t. Furthermore, due to natural variability in the size of recruiting year classes, increases in stock biomasses of the various species are most likely to occur in a stepwise fashion and the value of the catch would not necessarily increase proportionally.
However, on the negative side, it is likely that the northern shrimp catch would decrease due to increased predation by cod and that the capelin summer/autumn fishery would have to be reduced or stopped altogether, in order for the needs of their more valuable fish predators to be met and those of large whales, if whales remain subject to a moratorium on commercial whaling. Increases in abundance, but especially extended migrations of the Norwegian spring-spawning herring to feed in north Icelandic waters, will determine the value of the yield from that stock for Iceland. For this to occur on a long-term basis, the intensity of the cold East Icelandic Current must weaken and [[temperature]s] north of Iceland must increase. Such conditions are not envisaged under this scenario.
At Greenland, the no-change scenario will have little effect on the present situation, given that stocks are presently managed in a rational manner and that this is expected to continue.
Moderate warming
Most criteria in the no-change scenario are probably also valid for a moderate warming of 1 to 3ºC. However, due to greater primary and secondary production and a direct temperature effect per se, stock rebuilding processes are likely to be accelerated in most cases. Nevertheless, as for the no-change scenario, a rational fishing policy must be maintained. Indeed, it is very likely that harvesting strategies can be used which would give higher returns from most of the major demersal stocks in the Icelandic area. As under the no-change scenario, a side effect of such a policy would be a rise in the mean age and number of older fish in the spawning stock of cod, which would further enhance larval production and survival.
Drift of larval and 0-group cod across the northern Irminger Sea to East Greenland and onward to West Greenland waters is likely to become more frequent and the number of individuals transported to increase compared to the latter half of the 20th century. Since sea temperature off West Greenland will also increase under this scenario, it is very likely that the drift of cod larvae and juveniles from Iceland will lead to the establishment of a self-sustaining Greenlandic cod stock. With a successful management strategy and in the light of past events, that cod stock could become very large and have enormous positive economic benefits for Greenland (see Economic and social impacts of climate change: possible scenarios: Greenland, below). However, it is unlikely that this will contribute much to cod abundance at Iceland. This is because present fish finding and catch technologies are so effective that these cod can, and very likely will, be easily fished in Greenlandic waters before they could return to Iceland for spawning at the age of seven to eight years.
An increase in temperature of 1 to 3 ºC in the north Icelandic area is large in comparative terms and will, among other things, be associated with a weakening of the East Icelandic Current and a considerable reduction in its domain. The degree of reduction is very likely to be sufficient to enable the Norwegian spring-spawning stock to again take advantage of the rich supply of Calanus finmarchicus over the north Icelandic shelf. This scenario would make it easier and cheaper for Iceland to take its share of this stock, and would also make the stock more valuable. The reason for this is a large increase in the proportion of the catch which could be processed for human consumption compared to the current situation where a large proportion must be reduced to the comparatively cheaper fishmeal and oil. It is also very likely that more southern species such as mackerel and tuna will enter Icelandic waters in sufficient concentrations for commercial fishing in late summer and autumn.
Considerable warming
According to the B2 emissions scenario, model results indicate that a rise in temperature beyond 2 to 3 ºC in the Icelandic area in the 21st century is unlikely. However, should that happen, the high temperature is likely to lead to dramatic changes to the Icelandic marine ecosystem. Ecosystem essential (above) described the key role of capelin for the well-being of many demersal stocks, and highlighted the large reduction in weight-at-age of Icelandic cod during the two capelin stock collapses. Capelin spawning also ceased on their traditional grounds off the south and west coasts of Iceland in the late 1920's and early 1930's, occurring instead in fjords and inlets on the southeast and north coasts[47]. Under such conditions the extent of capelin spawning grounds would reduce considerably. Should the rise in sea temperature increase beyond that of the 1920 to 1940 period, it is likely that capelin spawning might be even further reduced and limited to the north and east coasts of Iceland. This would result in major changes in larval drift routes and survival and, eventually, to a large reduction in, or even a complete collapse of, the Icelandic capelin stock.
Owing to the key role of capelin as forage fish in the Icelandic marine ecosystem this scenario would be very likely to have a considerable negative impact on most commercial stocks of fish, whales, and seabirds which are dominant in this ecosystem at present. Such a scenario is also very likely to result in species from more temperate areas moving into the area and at least partially replacing those most affected by a lack of capelin.
The economic and social importance of fisheries (13.3.5)
The fishing industry and past economic fluctuations
Iceland
During the 20th century, the Icelandic gross domestic product (GDP) had an average annual growth of about 4% per year. This was largely driven by expansion in the fisheries and fish processing industries. Furthermore, fluctuations in aggregate economic output were highly correlated with variations in the fishing industry. Good catches and high export prices resulted in economic growth, while poor catches and adverse foreign market conditions led to economic slowdown and even depression. All five major economic depressions in the 20th century can be directly related to changes in the fortunes of the fishing sector, either wholly or partially[48].
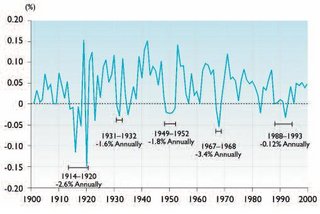
The first of these major depressions covers the period of the First World War, which had catastrophic effects on Iceland, as it did on many other European countries. The first two years of the war were favorable for the fishing sector however, as increased demand pushed up foreign prices, but in 1916 the international trade structure broke down and Iceland had to accept harsh terms of trade with the Allies. In 1917, Iceland was forced to sell half its trawler fleet to France. This led to substantially reduced demersal fish and herring catches in 1917 and 1918. The result was a sharp drop in GDP and a depressed economy until 1920 (Fig. 13.17).
The effects of the “Great Depression” were first felt in Iceland in autumn 1930, and in the following two years GDP fell by 0.5% and 5% respectively as demand for maritime exports declined sharply. Following a brief recovery, the economy was hit again when the Spanish Civil War broke out in 1936 and closed Iceland’s most important market for fish products. Despite these events, economic growth still averaged 3% in the 1930s, mostly because of strong rebound in the fisheries, especially the herring fisheries, in 1933 to 1939. The strong performance of the fisheries in the 1930s appears to be the reason that the “Great Depression” was felt less in Iceland than most other countries of Western Europe.
The Second World War was a boom period for Iceland led by good catches and very favorable export prices. But in 1947 and subsequent years, herring catches fell considerably and real export prices subsided from the high wartime levels. The result was a prolonged economic recession from 1949 to 1952.
During the 1960s, the economy grew at an average rate of 4.8%. This was largely due to very good herring fisheries. When the herring stocks collapsed toward the end of the decade the result was a severe economic depression in 1968 and 1969, when the GDP declined by 1.3% and 5.5% respectively. Unemployment reached over 2% – a great shock for an economy used to excess demand for labor since the 1930s – and many households moved abroad in search of jobs. Net emigration amounted to 0.6% of the total population in 1969 and 0.8% in 1970.
High economic growth resumed between 1971 and 1980 with annual rates averaging 6.4%. However, just as during the 1960s, this growth was to a significant extent based on overexploitation (Overfishing) of the most important fish stocks. Reduced fishing quotas and weak export prices reduced fishing profitability in the late 1980s. And, partly as a consequence of this, the Icelandic economy was stagnant between 1988 and 1993, with an average annual decline in GDP of 0.12%.
Since 1993, the Icelandic economy has shown steady and impressive annual growth rates. One reason for this is a recovery of some fish stocks. More important, however, are more favorable fish export prices and the impact of the individual transferable quota (ITQ) system. The ITQ system has enabled the fishing industry to increase and stabilize profits and more easily adjust to changing quotas and fish availability.
Thus, over the 20th century as a whole, it appears that major fluctuations in the Icelandic economy largely reflect changes in the fortunes of the fishing industry both in terms of harvest quantity and output prices. This implies that possible changes in fish stocks due to climate change may have similar macro-economic effects. However, it is very likely the macro-economic impact of any given change in fish availability will be smaller in the future than in the past. First, because the importance of the fishing industry for the Icelandic economy has declined substantially, and second, because the ITQ system has probably made the fishing industry more capable of adapting to changes in fish stocks. However, it must be noted that if the current depressed state of some of the most important fish stocks persists, adverse environmental changes may actually translate into larger biological shocks than those experienced in the past.
Greenland
Greenland does not offer the same overwhelming evidence of the national economic importance of the fishing industry as Iceland. This, however, does not mean that the economic importance of the Greenland fishing industry is any less than in Iceland. In fact it is probably much greater.
First, the Greenland fishing industry developed much later than that in Iceland. Thus, the Greenland fishing activity was relatively insignificant over the first half of the 20th century (see Fig. 4) even when compared to the rest of the Greenland economy. Second, being based on underexploited fish stocks, the Greenland fishing industry expanded relatively smoothly until the 1980's, resulting in far fewer of the dramatic fluctuations in fisheries output experienced in Iceland. Third, the Greenland economic statistics are less comprehensive than in Iceland, meaning fewer data.
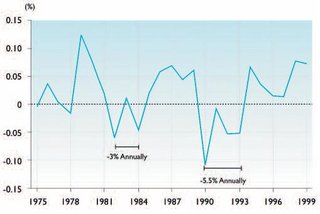
Since 1970, there have been two major cycles in the Greenland economy (Fig. 13.18) both associated with changes in the fishing industry, more precisely the cod fishery.
Historically, the cod fishery has been Greenland’s most important fishery (although this has now been superceded by the shrimp fishery). The cod fishery underwent a major expansion in the latter half of the 1970's due to reduction in foreign fishing following the extension of the Greenland fisheries jurisdiction to 200 nautical miles and a greatly expanded Greenland fishing effort. This led to a period of good economic growth that reversed abruptly in 1981 with a major contraction of the cod fishery due to a combination of overfishing and low export prices. The subsequent period of economic depression lasted for three years during which the GDP decreased by 9% per year. Another short-lived boom in the cod fishery from about 1985 led to a corresponding boom and bust cycle in the economy with a five-year growth period followed by a sharp depression lasting four years during which GDP decreased by over 20%. Economic growth resumed in Greenland in 1995, not on the basis of cod, which has not reappeared, but shrimp fishing which expanded very rapidly during the latter half of the 1990s.
As in Iceland, historical evidence indicates a close connection between fluctuations in GDP and variations in the Greenland fishing industry.
The economic and social role of fisheries
Iceland
The relative importance of the fishing industry in the Icelandic economy seems to have peaked before the middle of the 20th century. Since then, both the share of fish products in merchandise exports and the fraction of the total labor force engaged in fishing have declined significantly. In 2000, the fishing industry employed 8% of the labor force, accounted for 63% of merchandise exports, and generated 42% of export earnings. Total export value of fish products in 2000 was about US$ 1,220 million.
National accounts estimates of the contribution of the fishing industry to GDP – available since 1980 – confirm this trend. Thus, in 1980 the direct contribution of the fishing industry to GDP was over 16%. In 2000, this had dropped to just over 11%, which corresponds to an added US$ 900 million.
These aggregate statistics will understate the real contribution of the fishing industry to the Icelandic economy. There are two fundamental reasons for this. The first is that there are a number of economic activities closely linked to the fishing industry but not part of it. These comprise the production of inputs to the fishing industry, the so-called “backward linkages”, and the various secondary uses of fish products, the so-called “forward linkages”[51]. The backward linkages include activities such as shipbuilding and maintenance, fishing gear production, the production of fishing industry equipment and machinery, the fish packaging industry, fisheries research, and education. The forward linkages comprise the transport of fish products, the production of animal feed from fish products, the marketing of fish products, and retailing of fish products. According to Arnason[52], these backward and forward linkages may add at least a quarter to the direct GDP contribution of the fishing industry.
The other reason why the national accounts may underestimate the contribution of the fishing industry to GDP is the role of the fishing industry as a disproportionately strong exchange earner. To the extent that the availability of foreign currency constrains economic output, the economic contribution of a disproportionately strong export earner may be greater than is apparent from the national accounts. While the size of this “multiplier effect” is not easy to measure, some studies suggest it may be quite significant[53]. If this is the case, the total contribution of the fishing industry to GDP may be much higher than estimates suggest, in the sense that removing the fishing industry would, with all other things remaining the same, lead to this reduction in GDP.
There are also economic reasons as to why a change in the conditions of the fishing industry due, for example, to climate change, might have a lesser economic impact than suggested by the direct (and indirect) contribution of the fishing industry to GDP. Most economies exhibit some resilience to exogenous shocks. This means that the initial impact of such shocks is at least partly counteracted by the movement of labor and capital to economic activities made comparatively more productive by the shock. Thus, a negative shock in the fishing industry would to a certain extent be offset by labor and capital moving from the fishing industry to alternative industries and vice versa. Thus, the long-term impact of such a shock may be much less than the initial impact. The extent to which this happens depends on the availability of alternative industries. However, with increased labor mobility, communication technology, and human capital this type of flexibility is probably much greater than in the past.
Regional importance
Analysis in terms of macro-economic aggregates does not take into account that the economic importance of the fishing industry varies from one region of the country to another. In 2000, when the fishing industry (harvesting and processing) employed only about 8% of the national workforce, it provided jobs for over 35% of the working population in the western fjords and almost 30% of the working population in the eastern fjords. Both regions are sparsely populated and account for only a small proportion of the total Icelandic population. Near the capital, Reykjavík, where most of the alternative industries such as manufacturing and services are located, the fishing industry employed only about 3% of the working population.
|
Table 13.1. The importance of the fishing sectors to Icelandic communities in 1997. | |||
|
Labor share of the fishing sectors (%) |
Number of communities |
Number of inhabitants |
Percentage of total population |
| >40 | 24 | 12812 | 7.7 |
| 25-40 | 16 | 23063 | 8.6 |
| 10-25 | 14 | 36959 | 13.7 |
| 5-10 | 16 | 26832 | 10.0 |
| <5 | 54 | 161922 | 60.1 |
The local importance of the fishing industry is even more apparent at the community level. In 1997, the fishing industry accounted for over 40% of the local employment in 24 out of a total of 124 municipalities in Iceland (Table 13.1). A typical example of a community totally dependent on fishing is Raufarhofn, a small community of 400 inhabitants in northeast Iceland. Almost 70% of the adult population worked in the fishing industry in 1997. In four other communities the fishing industry accounted for over 60% of total employment in 1997.
By contrast, in 54 communities the fishing industry accounted for less than 5% of total employment. Most of the largest municipalities in Iceland belong to this group. It is mainly the smaller, economically less developed communities that depend heavily on fisheries (see Table 13.1).
Thus, the effects of a significant reduction in fish availability around Iceland, or the benefits of fisheries expansion would be differently felt in the various regions and communities of Iceland. In general terms, a significant reduction in fish availability is liable to be economically and socially disastrous for the western and eastern fjord regions and for certain other smaller regions of Iceland, while in the more densely populated southwest of Iceland such a reduction would be felt mainly as an increased influx of labor from the outlying regions and the corresponding realignment of economic activity.
Although labor mobility is high in Iceland, it may not be easy for inhabitants of fishing villages to find jobs elsewhere following a decline in fisheries due to climate change, especially if the economy is already depressed. Also, as many of the employment opportunities in and around the capital require particular education and training, individuals transferring from the fishing industry may have to accept relatively inferior jobs. At the same time, reduced employment and movement out of the fisheries-dependent regions and communities of Iceland will decrease real estate values in these areas, meaning that these migrants may have to suffer a significant decrease in the value of their assets at the same time as moving to seek new employment.
Thus, a significant reduction in the Icelandic fishing industry would lead to noticeable social disruption. However, given the nature of Icelandic society, it would probably be resolved within five to ten years of the initial shock, although the disruption would impose a certain stress on the social and political system during this period of adjustment.
Greenland
The fishing industry is by far Greenland’s most important production sector. In the 1960s and early 1970s fish and fish products accounted for between 80 and 90% of Greenland’s total export value. In 1974, there was a very large increase in the export of lead and zinc, which increased GDP by about 50% and caused fish and fish products to fall to between 60 and 70% of total export value. The export of lead and zinc ceased in 1990. Since then, export of fish and fish products has accounted for about 90% of Greenland’s total export value. In 2000, the export value of fish and fish products was about US$ 270 million and the total export value about US$ 285 million.
Exact statistics about the direct contribution of the fishing industry to the Greenland GDP are not available. However, the contribution to the gross national income (GNI) may be as high as 20%. This, however, does not tell the complete story. Greenland is part of Denmark with a “Home Rule” government. This means that Greenlanders can decide their own policies, except for foreign and defense policy. Every year, the Home Rule government receives economic support from the Danish State. In 2000 this amounted to about US$ 350 million or almost 25% of GNI. Correcting for this indicates a direct contribution of the fishing industry to the Greenland GDP of 25 to 30%.
As for Iceland, however, the fishing industry also has an indirect contribution to the Greenland economy via forward and backward linkages as well as multiplier effects. Adding these may bring the total contribution of the fishing industry to the Greenland economy as a whole to over 50%.
Regional importance
Greenland as a whole is highly dependent on the fishing industry. This is even more the case in less populated communities along the coast. About 20% of Greenland’s population lives in small villages and settlements with an average population of about 150 inhabitants. Many more live in small towns with less than a thousand inhabitants. The economic activity in these communities is almost exclusively based on the exploitation of living marine resources, i.e., through fishing and hunting. Also, the geographical isolation of many of these communities means alternative employment opportunities are few if any.
Thus, a significant drop in the fish stocks and other living marine resources would have a devastating impact on these communities. Most would decrease significantly and many would disappear altogether, causing those inhabitants that left to become economically and socially dispossessed. A secondary effect would be the substantial influx of these people to the more urban areas of Greenland and the problems that this would cause.
A significant increase in the stocks of fish and other living marine resources would cause the reverse effect and would strengthen the economic basis of Greenland’s smaller communities. While larger towns may benefit disproportionately from such a change, the net effect would probably be to increase population in the smaller communities and to expand the geographical extent of habitation in Greenland.
Economic and social impacts of climate change: possible scenarios (13.3.6)
From an economic point of view, climate change may have an impact on fisheries in at least two ways: by altering the availability of fish to fishers and by changing the price of fish products and fisheries inputs. Although both types of impact may be initiated by climate change, the former is a more direct consequence of climate change than the latter.
The possible impact of climate change on fish availability may occur through changes in the size of commercial fish stocks, changes in their geographical distribution, and changes in their catchability. These changes, if they occur, will affect the availability of fish for commercial harvesting. The direction of this impact is uncertain. It may be negative, and so reduce the maximum sustainable economic yield from the fish stocks, or positive, and so increase the maximum economic yield from the fish stocks. Also, the impact may vary for different fish stocks and for different regions. Irrespective of the direction of the impact, however, it is very likely that climate change will, at least temporarily, cause instability or fluctuations in harvesting possibilities while ecosystems adjusts to new conditions. The adjustment period may be long, and may even continue after the period of climate change has ended.
The same applies to changes in economic value in that relative prices may continue to adjust after an exogenous shift, such as climate change, has been resolved. In fact, economic adjustments following climate change, being dependent on biological/ecological adjustments, will by necessity continue after the latter are complete.
This section speculates on the possible economic and social impacts in Iceland and Greenland of changes in fish availability. The possible impacts of relative price changes are not discussed. However, the economic and social impacts of price changes will be similar to those of changes in fish stock availability. In terms of drawing inferences from historical evidence, it is not important whether expansions and contractions in the fishing industry result from changes in prices or fish availability.
Empirical evidence of possible economic impacts of changes in fish stock availability is either qualitative historical evidence or quantitative evidence. Qualitative evidence (discussed in The economic and social importance of fisheries above) relates economic fluctuations to qualitative evidence of expansions and contractions in the fishing industry. Quantitative evidence, in the form of time series for fisheries production and production values, provides a basis for statistical estimates of the relationship between the production value of the Icelandic and Greenland fishing industries and their respective GDP and Gross National Product (GNP) growth.
Iceland
Reliable time series data for the output and output value of the fishing industry are available since 1963. These data have been used to estimate the form and parameters of a relationship between economic growth rates and the output value of the fishing industry as well as other relevant economic variables such as capital and labor[54]. The equation exhibits good statistical properties and actual and fitted GDP growth rates are illustrated in Fig. 13.19.
This equation can, with certain modifications, be used to predict the short- and long-term impact of a change in fish stock availability due to climate change. It is important to realize, however, that to use this equation it is necessary to project (1) the extent and timing of climate change, (2) the impact of global climate change on fish stock availability, and (3) the impact of changed fish stock availability on the value of fish production (which involves both the volume and price of fish production).
Impact on GDP
This section presents the outcome of calculations to estimate the possible impact on GDP of changed fish stock availability as a result of climate change. The impact of other variables on the value of fish production is ignored. The calculations are based on two key factors: the impact of future climate change on the value of fish production in Iceland and the estimated relationship between economic growth and the value of fish production[55]. Both are highly uncertain. Thus, the following calculations must not be regarded as predictions. They are intended to serve as indications of the likely magnitudes of the impact on GDP in Iceland resulting from certain stated premises regarding changes in fish stock availability.
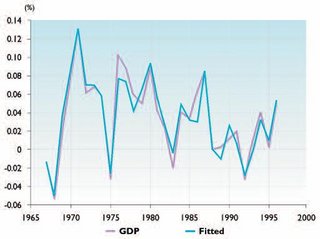 Figure 13.19 GDP growth in Iceland, 1966–1997: actual and fitted values. (Source: ACIA)
 Available projections (see Section 9.3.4.4 (Fisheries and aquaculture in the Central North Atlantic (Iceland and Greenland))) suggest that climate change over the next 50 to 100 years is (1) unlikely to have a great impact on fish stock availability in Icelandic waters and (2) is very likely to benefit the most valuable fish stocks. As a result, the overall effects of climate change on the Icelandic fisheries are likely to be positive. As these expectations are very uncertain, the rest of this section illustrates this point using three scenarios.
The first scenario assumes a gradual increase in fish stock availability of 20% over a period of 50 years. This is known as the “optimistic” scenario and corresponds to a 0.4% increase in the value of fish production annually. The second scenario assumes a gradual reduction in fish stock availability of 10% over 50 years. This is known as the “pessimistic” scenario and corresponds to an annual reduction in the value of fish production by 0.2%. The third scenario assumes a 25% reduction in fish stock availability over a relatively short period of five years. This corresponds to a collapse in the stock size of one major species or a group of important commercial species. In fact, there are some indications that the response of fish stocks to climatic change may be sudden and discontinuous rather than gradual. Owing to the magnitude and suddenness of this reduction it is known as the “dramatic” scenario.
These scenarios illustrate the likely range of economic impacts of climate change around Iceland. In interpreting their outcomes it is important to remember that these scenarios are restricted to the impact of climate change assuming all other variables affecting fish stocks and their economic contribution are unchanged. These outcomes do not incorporate the possibly simultaneous impact of improved fisheries management or other variables affecting the size of fish stocks and the value of the fisheries. In fact, given the currently depressed state of many of the most valuable fish stocks in Iceland, a better harvesting policy may easily contribute at least as much to the overall economic yield of the fisheries as the most optimistic climate scenario. However, such a policy will also improve the outcomes of the more pessimistic climate scenarios.
Optimistic scenario
In the optimistic scenario, fish stock availability is assumed to increase in equal steps by 20% over the next 50 years. The impact of this scenario on GDP relative to a benchmark GDP of unity is illustrated in Fig. 13.20. The figure illustrates that this quite considerable increase in fish stock availability has only a relatively minor impact on GDP. The maximum impact occurs in year 50, when increased fish stock availability has fully materialized. At this point GDP has increased (compared to the initial level) by less than 4%. The longterm impact, after economic adjustment processes are complete, is even less at around 2.5%. The largest annual increase in GDP is small at under 0.2%, and is substantially less than the GDP measurement error. Thus it would be hardly noticeable. In the years following the end of the increase in fish production, growth rates decline as production factors (which move to the fishing industry) reduce economic production elsewhere. Long-term GDP growth rates are, of course, unchanged. The main conclusion to be drawn is that a 20% increase in the output of the fishing industry equally spread over 50 years has a very small, hardly noticeable, impact on the short-term economic growth rates in Iceland as well as on long-term GDP.
Pessimistic scenario
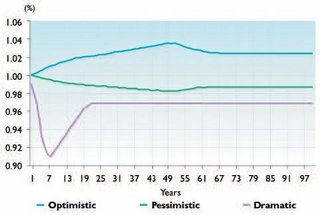 Figure 13.20. Iceland: impact of different scenarios on GDP (benchmark GDP = 1.0). (Source: ACIA)
 In the pessimistic scenario, fish stock availability is assumed to decrease in equal steps by 10% over the next 50 years. The impact of this scenario on GDP relative to a benchmark GDP of unity is also illustrated in Fig. 13.20. As in the optimistic scenario, it is apparent that this considerable decrease in fish stock availability has a relatively minor impact on long-term GDP. The maximum impact also occurs in year 50, at which point GDP has been reduced by less than 2%. The long-term impact, after economic adjustment processes are complete, is even less or just over 1%. The largest annual decrease in GDP is well over -0.1%. This occurs a few years after the decrease in fish stock availability begins. For most of the period, however, the impact on annual economic growth rates is much less. In the years following the end of the decrease in fish production, growth rates improve, as production factors (which move from the fishing industry) find productive employment elsewhere. All these deviations in annual GDP growth rates are well within GDP measurement errors. Long-term GDP growth rates are, of course, unchanged. As under the optimistic scenario, the main conclusion to be drawn is that a 10% decrease in output from the fishing industry equally spread over 50 years has a negligible impact on the short-term economic growth rates in Iceland as well as on long-term GDP.
Dramatic scenario
The dramatic scenario assumes a fairly substantial drop in fish stock availability and, hence, fish production of 25% over the next five years. The impact of the dramatic scenario on GDP relative to a benchmark GDP of unity is illustrated in the lowest curve in Fig. 13.20. This sudden drop in fish stock production has a significant negative impact on GDP in the short term. At its lowest point, in year eight, GDP is reduced by over 9% (compared to the initial level). The long-term negative impact, after economic adjustment processes are complete, is only about a 3% reduction in GDP. The decrease in annual GDP growth rates for the first seven years following the start of reduced fish stock production are significant or -1 to -2%. The maximum decline occurs toward the end of the reduction process in years four and five. However, only four years later, the contraction ends, and the deviation in annual GDP growth rates is reversed as production factors released from the fishing industry find productive employment elsewhere. According to these calculations, this adjustment process is complete by year 25 when growth rates have reverted to the underlying economic growth rate.
Social and political impacts
If the change in fishing industry output is gradual and the economic impact comparatively small (as in the “optimistic” and “pessimistic” scenarios), it is unlikely that the accompanying social and political impacts will be noticeable at a national level. Although over the long term, social and political impacts will undoubtedly occur, whether these will be large enough to be distinguished from the impact of other changes is uncertain. Regionally, however, the situation may be very different. In some parts of Iceland (see Section 13.5.2 (Fisheries and aquaculture in the Central North Atlantic (Iceland and Greenland))) the economic and social role of the fishing industry is far above the national average. In these areas, the economic, social, and political impact of an expansion or contraction in the fishing industry will be much greater than for Iceland as a whole and in some areas undoubtedly quite dramatic.
If, on the other hand, the change is fairly sudden (as in the “dramatic” scenario) the short-term social and political impact may be quite drastic. In the long term, however, after the initial impact, social and political conditions will revert to the long-term scenario described by the “pessimistic” scenario. Whether the economic and social adjustments will then also revert to their initial state is not clear.
Impact on fish markets
Reductions or increases in fish production in Iceland alone will not have a significant impact on global fish [[market]s]. Neither are they likely to have a large impact on the marketing of Icelandic fish products, provided the changes are gradual. If there is an overall decline in the global supply of species of fish that Iceland currently exploits, the impact on marketing of these species is uncertain. Almost certainly the marketing of the species in reduced supply will become easier. Thus, prices will rise counteracting the decrease in volume. However, the marketing impact might actually be the opposite. For some species, a large and steady supply is required to maintain marketing channels. If this is threatened, these channels may close and alternative outlets will have to be found.
Discussion
The main conclusion to be drawn is that the changes in fish stock availability that seem most likely to be induced by climate change over the next 50 to 100 years are unlikely to have a significant long-term impact on GDP in Iceland and, consequently, on social and political conditions in Iceland. Also, it appears that any impact, small as it may be, is more likely to be positive than negative. However, if on the other hand, climate change results in sudden rather than gradual changes in fish stock availability, the short-term impact on GDP and economic growth rates may be quite significant. The impact seems very unlikely to be dramatic (i.e., over 5% change in GDP between years) however. Over the long term, the impact on GDP of a sudden change in fish stocks will be indistinguishable from the effects of more gradual change. Long-term social and political impacts may differ although there is no clear evidence to support this.
Greenland
Reliable time series data for the export value of the Greenland fishing industry are available since 1966. These data have been used to estimate the form and parameters of a relationship between GDP and the real export value of fish products[56]. The equation exhibits reasonable statistical properties. Actual and fitted GDP growth rates according to this equation are illustrated in Fig. 13.21. It is projected that a 1% increase in the export value of fish products will lead to a 0.29% increase in the Greenland GDP. Subject to the same qualifications as for Iceland, this equation can be used to predict the economic impact of a change in fish stock availability resulting from climate change.
Impact on GDP
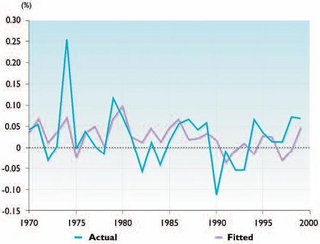 Figure 13.21. GDP in Greenland, 1970–1999: actual and fitted values. (Source: ACIA)
 Available projections (see [[Section 9.3.4.4 (Fisheries and aquaculture in the Central North Atlantic (Iceland and Greenland))]2] and sections in this artcile Past climatic variations and their impact on commercial stocks and Possible impacts of climate change on fish stocks suggest that climate change over the next 100 years is very likely to benefit the most valuable fish stocks at Greenland. This is particularly likely to be the case for the cod stock, which could experience a revival from its current extremely depressed state to a level, seen during warm periods of the 20th century, where it could yield up to 300,000t on a sustainable basis. However, climate change and increased predation by cod could lead to a dramatic fall in the sustainable harvest of shrimp by up to 70,000 t (Fig. 13.22). The value of the increased cod harvest would, however, greatly exceed losses due to a possibly reduced harvest of shrimp. In fact, this change could lead to doubling or even tripling of the total production value of the Greenland fishing industry. Thus, the projected climate change could have a major positive impact on the Greenland fishing industry. However, this is highly uncertain. As was the case for Iceland this section continues on the basis of three scenarios.
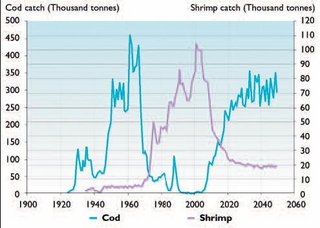
The first scenario, termed the “pessimistic” scenario, assumes that despite more favorable habitat conditions, cod will not reestablish permanently in Greenland waters. Instead, there will be periodic bursts of cod availability accompanied by a corresponding drop in shrimp, based on occasional large-scale larval drift from Iceland similar to that seen in warmer periods in the past. The overall impact will be a slight average increase in fish harvests with some peaks and troughs. The second scenario, termed the “moderate” scenario, assumes a modest and gradual return of cod to Greenland which in 20 years would be capable of yielding 100,000t per year on average. This would be accompanied by a corresponding decline in the shrimp stock. The third scenario, termed the “optimistic” scenario, assumes a return of the Greenland cod stock, initially generated by Icelandic cod larval drift, to the levels of the 1950s and 1960s. A full revival, however, would take some decades and would occur in a fluctuating manner. Ultimately, in about 30 years, the cod stock would be capable of producing an average yield of 300,000t per year, compared to almost nothing at present. The average shrimp harvest, however, would be reduced from a current level of almost 100,000t per year to about 20,000t per year. Nevertheless, the overall value of the Greenland fish harvest would almost double. These scenarios illustrate the likely range of economic impacts of climate change around Greenland. The harvest projections are all based on a two-species fisheries model developed for the Greenland fisheries[58].
Pessimistic scenario
The pessimistic scenario assumes an insubstantial change in overall average fish stock availability. However, due to the occasional large-scale influx and survival of Icelandic cod larvae, periodic bursts in cod availability occur. This situation results in fluctuating fish production rates and GDP impacts over time (see lowest curve in Fig. 13.83) with a small average increase. The average increase in GDP after 50 years is about 2% higher than would otherwise have been the case.
Moderate scenario
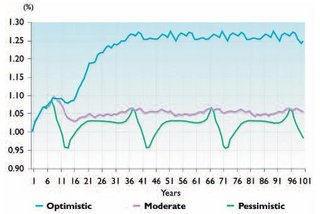 Figure 13.23. Greenland: impact of different scenarios on GDP (benchmark GDP=1.0). (Source: ACIA)
 In the moderate scenario, fish stock availability is assumed to increase gradually by about 20% over the next 100 years. The impact of this scenario on GDP relative to a benchmark GDP of unity is shown by the middle curve in Fig. 13.83. This increase in the availability of fish leads to a moderate long-term increase in GDP of 6% (compared to the initial level). However, as most of this increase is projected to occur over the first ten years (in fact the initial impact is projected to be greater than the long-term impact) there would be a significant addition to GDP of 1% per year during this initial period.
Optimistic scenario
In the optimistic scenario, fish stock availability is assumed to increase gradually, but in a fluctuating manner, by about 100% over the next 50 years. The projected relationship between the value of fish exports and GDP suggests that this will lead to an ultimate increase in GDP of 28% compared what would otherwise have been the case. This impact relative to a benchmark GDP of unity is illustrated in Fig. 13.83. Such an impact would be very noticeable. The addition to economic growth would be close to 0.8% per year over the first 30 years but would then decrease, stopping after 40 years.
Social and political impacts
If the optimistic scenario were to occur and the increased cod harvest was mainly caught and processed by Greenlanders there would be a dramatic improvement in the Greenland unemployment/underemployment situation and in the income of the large group of self employed small-boat fishers/hunters. Everything else being the same, the current high level of unemployment would disappear and the total income of many families would increase markedly. This would have a major social impact in Greenland. Cod fishing of the magnitude projected under the optimistic scenario might easily lead to the establishment of large-scale fish processing factories in the more densely populated regions of Greenland.
Under the pessimistic and moderate scenarios employment and consequently social impact would be far more moderate, especially if the changes appeared gradually over a long period. If, however, the change is sudden (as in the “dramatic” scenario for Iceland), short-term social and political impacts may be drastic.
Discussion
The likely impacts of the possible changes in fish stock availability in Greenland waters resulting from climate change cover a wider range than for Iceland. At one extreme, they could lead to a 30% increase in GDP, while at the other extreme the impact on GDP could be negligible. This range in outcomes reflects (1) the greater importance of the fisheries sector in Greenland compared to Iceland and (2) that during warm periods the very large marine habitat around Greenland can accommodate a biomass of commercial species which is many times greater than that at present. Since the arctic influence is more pronounced in the Greenland marine environment than in that around Iceland, it follows that impacts resulting from a moderate climate change, if it occurs, are very likely to be more dramatic in the marine environment around Greenland.
Ability to cope with change (13.3.7)
Climate change will almost certainly lead to changes in the relative sizes, biological productivity, and spatial distribution of commercial fish stocks. These changes may be predominantly advantageous or predominantly disadvantageous. They may be sudden or may emerge gradually. The economic and social impacts of changes in fish stock availability depend on the direction, magnitude, and rapidity of these changes. The economic and social impacts also depend, possibly even more so, on the ability of the relevant social structures to adapt to altered conditions. Good social structures facilitate fast adjustments to new conditions and thus mitigate negative impacts. Weak or inappropriate social structures exhibit sluggish and possibly inappropriate responses and thus may exacerbate problems resulting from adverse environmental changes.
One of the most crucial social structures in this respect is the fisheries management system. This determines the extent to which the [[marine fisheries|fisheries can adapt in an optimal manner to new conditions. Other important social structures relate to (1) the adaptability of the economic system – especially price flexibility, labor education and mobility, and the extent of economic entrepreneurship; (2) the ability to adjust macro-economic policies; and (3) the extent and nature of the social welfare system. These structures influence the form of the necessary adjustments to new conditions, for example whether they are smooth and quick or difficult and long-term.
The Icelandic fisheries management system is based on permanent harvest shares in the form of ITQs and so is inherently forward-looking and thus probably well-suited to adjust optimally to changes in the availability of fish, especially if these changes are to an extent foreseen. For any time path of fish stock productivity, ITQ holders have a strong incentive to maximize the expected present value of the fishery as this will also maximize their expected wealth. As a result, there is a high likelihood that TACs and other stock size determinants will be adjusted optimally to altered conditions. In other words, with the Icelandic fisheries management system, there is little chance that the fishing activity will exacerbate a negative biological impact arising from climate change. Also, the opportunities generated by a positive biological impact will probably be close to fully exploited by the fishing sector. In Greenland, however, fishers’ rights to harvest shares are considerably weaker. As a result, Greenland seems less prepared than Iceland to adapt in an economically efficient manner to changed fish stock availability.
For the other relevant social structures, it also appears that those in Iceland are well-suited to facilitating adjustment to adverse environmental changes. First, Icelandic social structures are used to having to adapt to quite drastic fluctuations in the economy (see The economic and social importance of fisheries above), which implies that these institutions have evolved to cope with such fluctuations. Second, labor education and mobility is high in Iceland. High labor mobility refers to labor movements within Iceland as well as to between Iceland and other countries. This means that negative [[region]al] impacts resulting from climate change are unlikely to lead to permanently depressed unemployment areas or even persistent national unemployment. Third, the level of private and commercial entrepreneurship is high in Iceland. This suggests that in the case of negative impacts, economic substitute activities are likely to be quickly spotted and exploited. Fourth, there is an extensive social welfare system in Iceland that would provide at least temporary compensation to individuals adversely affected by environmental change. Although this social “safety net” will tend to delay adjustments to new conditions, it will also ensure that the burden of adverse changes is shared among the total population and so prevents individual hardship.
Thus, broadly speaking, it appears that Icelandic social structures are well suited to cope with sudden changes in fish stock availability resulting from climate change. This means that adjustments to changes are likely to be fast and smooth. Adverse environmental changes will nevertheless be economically and socially costly. However, they are unlikely to be exacerbated by social and economic responses. On the other hand, although the Icelandic economy seems well prepared to deal with changes in fish stock availability, an adverse biological impact may be felt more strongly than in the past. This is because some of the most valuable commercial stocks are currently close to their historical minimum. Hence, if there is an adverse environmental change, the initial reduction in harvests may be more dramatic than previously experienced and, also, the risk of a long-term stock depression greater.
The ability of social structures in Greenland to adjust to new conditions is similar to the situation in Iceland. Greenlanders are used to variable environmental and economic conditions. Although perhaps not at the level of Iceland, general education and labor training is also high in Greenland. However, partly due to the size of Greenland and the isolation of many communities, labor mobility is considerably less than in Iceland. Most importantly, however, the degree of private and commercial entrepreneurship in Greenland seems much less than in Iceland.
Thus, while the Greenland social structure and institutions seem reasonably well placed to adjust to the changes in fish stock availability that might result from climate change, they presently appear less suited in this respect than those in Iceland.
Concluding comments (13.3.8)
The ecosystems of Iceland and Greenland are very different. Icelandic waters occur to the south of the Polar Front under normal circumstances and are therefore under the influence of warm Atlantic water. Greenland waters are dominated by the cold East Greenland Current. This difference is reflected in higher numbers of exploited species at Iceland than at Greenland where there is also a dominance of arctic species of plankton, commercial invertebrates, and fish.
Both ecosystems were subject to large climatic changes in the 20th century. After a prolonged period of cold conditions (lasting several decades), a warm period started around 1920 and peaked in the 1930s. Conditions were cooler in the 1940s, but warmed again and stayed warm for several years. There was a sudden cooling associated with decreased salinity and severe ice conditions in the mid-1960s. These changes reverberated around the North Atlantic at least twice during the next two decades. Conditions improved at Iceland in 1972 but remained variable for the next two and a half decades. Since the late 1990's, conditions have been persistently warmer at Iceland and even more so off West Greenland.
The warming of the 1920s and the early 1930s was followed by spectacular changes in the fish fauna of Icelandic and, in particular, Greenlandic waters. Cod and herring began to spawn in large numbers off the north coast of Iceland in addition to the traditional spawning areas in the Atlantic water off the south and west coasts. For some years, capelin were absent from their usual spawning areas to the south and west of Iceland, but spawned instead off southeast Iceland as well as in fjords and bays on the north and east coasts. Despite searches by Danish biologists and fishers, almost no cod were found to the south and west of Greenland between 1900 and 1920. However, after 1920 cod began to appear in increasing numbers in these areas and in the 1930s a cod fishery off West Greenland yielded on average about 100,000t per year. This change is attributed to a massive drift of 0-group cod from Iceland across the northern Irminger Sea to the east and then west of Greenland.
Other changes associated with the warm period were manifested in a regular appearance of more southerly species such as mackerel and tuna at Iceland, while cold-temperate species such as haddock, saithe, and herring became fairly common at Greenland. In the latter case, cod extended their distribution northward to the west of Greenland for hundreds of kilometers to Disco Bay. Likewise, the center of capelin distribution shifted from off southwest Greenland to the Disco Bay area and the northern limit of their distribution reached as far as Thule.
Although many of the cod which had drifted across to Greenland as juveniles returned to spawn in their native areas off south and west Iceland, many did not, but spawned instead off West Greenland and eventually gave rise to a self-sustaining Greenlandic cod component. The Greenland cod were very successful for a number of decades and eventually formed a large local stock that supported catches in the hundreds of thousands of tonnes.
The cooling of the mid-1960s had a devastating effect, both at Iceland and Greenland. The spawning of cod at Greenland seems to have ceased completely and the stock crashed. At Iceland, the zooplankton community in the north and east changed from an atlantic to an arctic type. The most drastic effect was the disappearance of the Norwegian spring-spawning herring (the largest known herring stock in the world) from its traditional feeding areas north of Iceland. In the following years the herring fed further east in the Norwegian Sea until the stock crashed in the late 1960's. The two local and much smaller Icelandic herring stocks suffered the same fate. These stocks were all subject to a large fishing pressure in the 1960's. While the collapses in the herring stocks can be traced to exploitation beyond sustainable levels, this is not the case for the Greenland cod stock. Although the stock was also heavily fished, and its downfall accelerated by the fishery, evidence suggests that cod cannot reproduce effectively at Greenland except under warm climatic conditions. On the other hand, the low [[temperature]s] of the latter 1960's and relatively cold but variable conditions of Icelandic waters since the early 1970s do not seem to have adversely affected the Icelandic cod stock. The relatively low abundance of cod at Iceland at present appears to be the result of overfishing.
From a socio-economic point of view, climate-driven changes in fish abundance at Iceland over the 20th century had very large effects. In particular, the disappearance of the Atlanto-Scandian herring had severe consequences at all levels of society. Iceland lost about half its foreign revenue from fish products almost instantly, resulting in severe economic depression. However, the depressed state did not last long. The herring sector of the fishery quickly targeted other local species and also shifted to fishing herring elsewhere, mainly in the North Sea (North Sea, Europe) and adjacent waters. The Icelandic fishery sector also adapted quickly to various fishing restrictions imposed during the last quarter of the 20th century.
The lucrative cod fishery, which started off West Greenland in the late 1920's and lasted until the stock collapse in the early 1970's, did not have much effect on the Greenland economy. This was because the lack of suitable vessels and gear, as well as the necessary infrastructure, meant Greenland was unable to benefit from these conditions except on a very small scale.
Three scenarios of possible future climate change (no change, moderate warming (1–3ºC), and considerable warming (4ºC or more)) were used to examine likely outcomes for Iceland and Greenland. Changes in the size and distribution of commercial stocks are very unlikely under the no-change scenario. Thus, the Greenlandic fishing sector would mainly depend on cold water fish such as Greenland halibut and invertebrates such as northern shrimp and snow crab. At Iceland, fish species such as Atlantic cod, haddock, saithe, and redfish would dominate demersal fisheries, while capelin, local herring, and possibly blue whiting would dominate the pelagic fisheries. Catches of some species under the no-change scenario could be increased considerably through effective fisheries management, particularly in Iceland.
Moderate warming is likely to result in quite large positive changes in the catch of many species. Through larval drift from Iceland, a self sustaining cod stock is likely to be established off West Greenland which could yield annual catches of around 300,000t. If that happens, catches of northern shrimp are likely to decrease to about 30% of the present level, while catches of snow crab and Greenland halibut are not likely to alter much. Such changes would probably approximately double the export earnings of the Greenland fishing industry, which roughly translates into the sum presently paid by Denmark to subsidize the Greenland economy. Such dramatic changes are not likely in the Icelandic marine ecosystem. Nevertheless, it is likely that there will be an overall gain through larger catches of demersal species such as cod, and pelagic species such as herring, and new fisheries of more southern species such as mackerel. On the other hand, capelin catches are likely to decrease, both through diminished stock size and the necessity of conserving this important forage fish for other species. Effective fisheries management is very likely to continue to play a key role for Greenland and Iceland.
Little can be said about potential changes under the scenario of considerable warming. This is because such a situation is outside any recorded experience.
Chapter 13: Fisheries and Aquaculture
13.1 Introduction (Fisheries and aquaculture in the Central North Atlantic (Iceland and Greenland))
13.2 Northeast Atlantic – Barents and Norwegian Seas
13.3 Central North Atlantic – Iceland and Greenland
13.4 Newfoundland and Labrador Seas, Northeastern Canada
13.5 North Pacific – Bering Sea
13.6. Synthesis and key findings
13.7. Research recommendations
References
- [60]Vilhjálmsson, 2002, Op. cit.
Citation
Committee, I. (2013). Fisheries and aquaculture in the Central North Atlantic (Iceland and Greenland). Retrieved from http://editors.eol.org/eoearth/wiki/Fisheries_and_aquaculture_in_the_Central_North_Atlantic_(Iceland_and_Greenland)- ↑ based on: Blindheim, J., 2004. Oceanography and climate. In: H.R. Skjoldal, R. Sætre, A. Færnø, O.A. Misund, I. Røttingen (eds.). The Norwegian Sea Ecosystem, pp. 65–96.Tapir Academic Press.--Stefánsson, U., 1999. Hafi? (The Ocean). Háskólaútgáfan, Reykjavík. 480p. (In Icelandic)
- ↑ Jensen, A.S., 1926. Indberetning av S/S Dana’s praktisk videndskabelige fiskeriundersøgelser ved Vestgrønland i 1925. Beretninger og Kundgørelser vedr. Styrelsen af Grønland, 2:291–315.
- ↑ Hansen, P.M., A.S. Jensen and Å.V.Tåning, 1935. Cod marking experiments in the waters of Greenland 1924–1933. Meddelelser fra Kommissionen for Danmarks Fiskeri- og Havundersøgelser. Serie: Fiskeri, 10(1):3–119.--Jónsson, J., 1996. Tagging of cod (''Gadus morhua'') in Icelandic waters 1948–1986. Rit Fiskideildar, 14(1):5–82.--Tåning, Å.V., 1934. Survey of long distance migrations of cod in the North Western Atlantic according to marking experiments. ICES Rapports et Procès-Verbaux des Réunions, 89(3):5–11.--Tåning, Å.V., 1937. Some features in the migration of cod. Journal du Conseil International pour l’Exploration de la Mer, 12:1–35.
- ↑ Anon, 2004b. Environmental Conditions in Icelandic Waters 2004. Technical Report 101. Marine Research Institute, Reykjavík, 37p. (In Icelandic – English summary, table and figure legends)--Astthorsson, O.S. and A. Gislason, 1995. Long-term changes in zooplankton biomass in Icelandic waters in spring. ICES Journal of Marine Science, 52:657–668.
- ↑ Malmberg S.A., 1988. Ecological impact of hydrographic conditions in Icelandic waters. In:T. Wyatt and M.G. Larraneta (eds.). Long-term changes in marine fish populations, pp. 95-123. Symposium held in Vigo, Spain, 18–21 November 1986.--Malmberg, S.A. and S. Kristmannsson, 1992. Hydrographic conditions in Icelandic waters, 1980–1989. ICES Marine Science Symposia, 195:76–92.--Malmberg, S.A., J. Mortensen and H.Valdemarsson, 1999. Decadal scale climate and hydrobiological variability in Icelandic waters in relation to large scale atmospheric conditions in the North Atlantic. International Council for the Exploration of the Sea. ICES CM 1999/L:13, 9p.--Vilhjálmsson, H., 1997. Climatic variations and some examples of their effects on the marine ecology of Icelandic and Greenland waters, in particular during the present century. Rit Fiskideildar, 15(1):7–29.
- ↑ based on: Stefánsson, U., 1999. Hafi? (The Ocean). Háskólaútgáfan, Reykjavík. 480p. (In Icelandic)--Vilhjálmsson, H., 1994. The Icelandic capelin stock. Capelin Mallotus villosus (Muller) in the Iceland, Greenland, Jan Mayen area. Rit Fiskideildar, 13(1), 281p.-- Vilhjálmsson, H., 2002. Capelin (''Mallotus villosus'') in the Iceland–East Greenland–Jan Mayen ecosystem. ICES Marine Science Symposia, 216:870–883.
- ↑ Buch, E., 1993. The North Atlantic water component of the West Greenland Current. ICES CM 1993/C: 20.--Buch, E. and H.H. Hansen, 1988. Climate and cod fishery at West Greenland. In:T.Wyatt and M.G. Larraneta (eds.). Long Term Changes in Marine Fish Populations. A symposium held in Vigo, Spain, 18–21 November 1986, pp. 345–364.--Buch, E., S.A. Horsted and H. Hovgaard, 1994. Fluctuations in the occurrence of cod in Greenland waters and their possible causes. ICES Marine Science Symposia, 198:158–174.--Buch, E., M.H. Nielsen and S.A. Pedersen, 2002. Ecosystem variability and regime shift in West Greenland waters. Northwest Atlantic Fisheries Organization, Standing Committee on Research Doc. 02/16, Ser. No. N4617.
- ↑ Muus, B.J., F. Salomonsen and F.C. Vibe, 1990. Grønlands fauna: fisk, fugle, pattedyr. The Greenland Fauna: fish, birds and mammals, 463p. (In Danish)
- ↑ Schmidt., J., 1909. The distribution of the pelagic fry and spawning regions of the Gadoids in the North-N-Atlantic from Iceland to Spain. ICES Rapports et Procès-Verbaux des Réunions, 10:1–229.
- ↑ Jensen, A.S., 1926. Indberetning av S/S Dana’s praktisk videndskabelige fiskeriundersøgelser ved Vestgrønland i 1925. Beretninger og Kundgørelser vedr. Styrelsen af Grønland, 2:291–315. 1939--Tåning, Å.V., 1937. Some features in the migration of cod. Journal du Conseil International pour l’Exploration de la Mer, 12:1–35.
- ↑ Pálsson, Ó.K., 1997. Food and feeding of cod (''Gadus morhua''). In: J. Jakobsson and Ó. K. Pálsson (eds.). Multispecies Research 1992–1995, pp. 177–191. Marine Research Institute, Reykjavík, Technical Report, 57. (In Icelandic)
- ↑ Vilhjálmsson, H., 1994. The Icelandic capelin stock. Capelin Mallotus villosus (Muller) in the Iceland, Greenland, Jan Mayen area. Rit Fiskideildar, 13(1), 281p.--Vilhjálmsson, H., 2002. Op. cit.
- ↑ Friis-Rødel, E. and P. Kanneworff, 2002. A review of capelin (''Mallotus villosus'') in Greenland waters. ICES Marine Science Symposia, 216:890–896.
- ↑ Buch, E., S.A. Horsted and H. Hovgaard, 1994. Fluctuations in the occurrence of cod in Greenland waters and their possible causes. ICES Marine Science Symposia, 198:158–174.
- ↑ e.g., Jarre, A. (ed.), 2002. Ecosystem West Greenland.Workshop held at the Greenland Institute of Natural Resources, Nuuk 29 November–03 December 2001. Arctic Research Journal 1.
- ↑ Jónsson, J., 1994. Fisheries off Iceland, 1600–1900. ICES Marine Science Symposia, 198:3–16.
- ↑ Thor, J. Th., 1992. British trawlers and fishing grounds at Iceland 1889–1916. Hi? íslenska bókmenntafélag, Reykjavik. 237p. (In Icelandic)
- ↑ Schopka, S.A., 1994. Fluctuations in the cod stock off Iceland during the twentieth century in relation to changes in the fisheries and environment. In: J. Jakobsson, O.S. Asthorsson, R.J.H. Beverton, B. Björnsson, N.Daan, K.T. Frank, J.B. Rothschild, S.Sundby and S. Tilseth (eds.). Cod and Climate. ICES Marine Science Symposia, 198:175–193.
- ↑ Buch, E., S.A. Horsted and H. Hovgaard, 1994. Fluctuations in the occurrence of cod in Greenland waters and their possible causes. ICES Marine Science Symposia, 198:158–174.
- ↑ Hansen, P.M., 1949. Studies of the biology of the cod in Greenland waters. ICES Rapports et Procès-Verbaux des Réunions, 123:1–83--Jensen, A.S., 1926. Indberetning av S/S Dana’s praktisk videndskabelige fiskeriundersøgelser ved Vestgrønland i 1925. Beretninger og Kundgørelser vedr. Styrelsen af Grønland, 2:291–315.--Jensen, A.S., 1939. Concerning a change of climate during recent decades in the Arctic and Subarctic regions, from Greenland in the west to Eurasia in the east, and contemporary biological and physical changes. The Royal Danish Science Society. Biological Reports, 14, 8:1–77.
- ↑ Jakobsson, J., 1964. Recent developments in the Icelandic purse-seine herring fishery. In: H. Kristjonsson (ed.). Modern Fishing Gear of the World 2, pp. 294–395. Fishing News Books, Oxford.
- ↑ Jakobsson, J., 1980. Exploitation of the Icelandic spring- and summerspawning herring in relation to fisheries management, 1947–1977. ICES Rapports et Procès-Verbaux des Réunions, 177:23–42.
- ↑ Vilhjálmsson, H., 1994. The Icelandic capelin stock. Capelin ''Mallotus villosus'' (Muller) in the Iceland, Greenland, Jan Mayen area. Rit Fiskideildar, 13(1), 281p.-- Vilhjálmsson, H., 2002. Op. cit.--Vilhjálmsson, H. and J.E. Carscadden, 2002. Assessment surveys for capelin in the Iceland-East Greenland-Jan Mayen area, 1987–2001. ICES Marine Science Symposia, 216:1096–1104.
- ↑ Anon, 2004c. State of Marine Stocks in Icelandic Waters 2003/2004. Prospects for the Quota Year 2004/2005. Technical Report 202. Marine Research Institute, Reykjavík, 181p. (In Icelandic – English summary, table and figure legends)
- ↑ Rosing-Asvid, A., 2005. Climate variability around Greenland and its influence on ringed seals and polar bears. Ph.D. Thesis, University of Copenhagen.
- ↑ based on: Anon, 2004b. Environmental Conditions in Icelandic Waters 2004. Technical Report 101. Marine Research Institute, Reykjavík, 37p. (In Icelandic – English summary, table and figure legends)--Stefánsson, U., 1999. Hafi? (The Ocean). Háskólaútgáfan, Reykjavík. 480p. (In Icelandic)
- ↑ Fridriksson, Á., 1948. Boreo-tended changes in the marine vertebrate fauna of Iceland during the last 25 years. ICES Rapports et Procès-Verbaux des Réunions, 125:30–32.--Jensen, A.S., 1926. Indberetning av S/S Dana’s praktisk videndskabelige fiskeriundersøgelser ved Vestgrønland i 1925. Beretninger og Kundgørelser vedr. Styrelsen af Grønland, 2:291–315.--Jensen, A.S., 1939. Concerning a change of climate during recent decades in the Arctic and Subarctic regions, from Greenland in the west to Eurasia in the east, and contemporary biological and physical changes. The Royal Danish Science Society. Biological Reports, 14, 8: 1–77.--Sæmundsson, B., 1934. Probable influence of changes in temperature on the marine fauna of Iceland. ICES Rapports et Procès-Verbaux des Réunions, 86:3–6.--Tåning, Å.V., 1934. Survey of long distance migrations of cod in the North Western Atlantic according to marking experiments. ICES Rapports et Procès-Verbaux des Réunions, 89(3):5–11.--Tåning, Å.V., 1948. On changes in the marine fauna of the North-NWestern Atlantic Area, with special reference to Greenland. ICES Rapports et Procès-Verbaux des Réunions, 25:26–29.
- ↑ Buch, E., S.A. Horsted and H. Hovgaard, 1994. Fluctuations in the occurrence of cod in Greenland waters and their possible causes. ICES Marine Science Symposia, 198:158–174.
- ↑ Vilhjálmsson, H., 1997. Climatic variations and some examples of their effects on the marine ecology of Icelandic and Greenland waters, in particular during the present century. Rit Fiskideildar, 15(1):7–29.
- ↑ adapted from: Buch, E., S.A. Horsted and H. Hovgaard, 1994. Fluctuations in the occurrence of cod in Greenland waters and their possible causes. ICES Marine Science Symposia, 198:158–174.--Buch, E., M.H. Nielsen and S.A. Pedersen, 2002. Ecosystem variability and regime shift in West Greenland waters. Northwest Atlantic Fisheries Organization, Standing Committee on Research Doc. 02/16, Ser. No. N4617.
- ↑ Sæmundsson, B., 1934. Probable influence of changes in temperature on the marine fauna of Iceland. ICES Rapports et Procès-Verbaux des Réunions, 86:3–6.
- ↑ Jensen, A.S., 1926. Indberetning av S/S Dana’s praktisk videndskabelige fiskeriundersøgelser ved Vestgrønland i 1925. Beretninger og Kundgørelser vedr. Styrelsen af Grønland, 2:291–315.--Schopka, S.A., 1994. Fluctuations in the cod stock off Iceland during the twentieth century in relation to changes in the fisheries and environment. In: J. Jakobsson, O.S. Asthorsson, R.J.H. Beverton, B. Björnsson, N.Daan, K.T. Frank, J.B. Rothschild, S. Sundby and S. Tilseth (eds.). Cod and Climate. ICES Marine Science Symposia, 198: 175–193.
- ↑ Jensen, A.S., 1939. Concerning a change of climate during recent decades in the Arctic and Subarctic regions, from Greenland in the west to Eurasia in the east, and contemporary biological and physical changes. The Royal Danish Science Society. Biological Reports, 14, 8:1–77.
- ↑ Ibid.
- ↑ Ibid.
- ↑ Ibid.
- ↑ Vilhjálmsson, H., 1997. Climatic variations and some examples of their effects on the marine ecology of Icelandic and Greenland waters, in particular during the present century. Rit Fiskideildar, 15(1): 7–29.
- ↑ Astthorsson, O.S. and A. Gislason, 1995. Long-term changes in zooplankton biomass in Icelandic waters in spring. ICES Journal of Marine Science, 52:657–668.--Malmberg S.A., 1988. Ecological impact of hydrographic conditions in Icelandic waters. In: T. Wyatt and M.G. Larraneta (eds.). Long-term changes in marine fish populations, pp. 95-123. Symposium held in Vigo, Spain, 18–21 November 1986.--Thórdardóttir, Th., 1977. Primary production in North Icelandic waters in relation to recent climatic changes. In: M.J. Dunbar (ed.). Polar Oceans. Proceedings of the Polar Oceans Conference held at McGill University, Montreal, 1974, pp. 655–665. Arctic Institute of North America, Canada.--Thórdardóttir, Th., 1984. Primary production north of Iceland in relation to water masses in May–June 1970–1980. ICES CM 1984/L:20.
- ↑ Jakobsson, J., 1992. Recent variability in the fisheries of the North Atlantic. ICES Marine Science Symposia, 195: 291–315.
- ↑ Anon, 2004b. Environmental Conditions in Icelandic Waters 2004. Technical Report 101. Marine Research Institute, Reykjavík, 37p. (In Icelandic – English summary, table and figure legends)
- ↑ Dragesund, O., J. Hamre and Ø. Ulltang, 1980. Biology and population dynamics of the Norwegian spring spawning herring. ICES Rapports et Procès-Verbaux des Réunions, 177:43–71.--Jakobsson, J., 1969. On herring migration in relation to changes in sea temperature. Jökull, 19:134–145.--Jakobsson, J., 1978.The north Icelandic herring fishery and environmental conditions 1960–1968. ICES Symposium on the Biological Basis of Pelagic Fish Stock Management. Paper no. 30, 101p.--Jakobsson, J., 1980. Exploitation of the Icelandic spring- and summerspawning herring in relation to fisheries management, 1947–1977. ICES Rapports et Procès Verbaux des Réunions, 177:23–42.--Jakobsson, J. and O.J. Østvedt, 1999. A review of joint investigations of the distribution of herring in the Norwegian and Iceland Seas 1950–1970. In: H.Vilhjalmsson, J. Olafsson and O.S. Astthorsson (eds.). Unnsteinn Stefánsson Festschrift. Rit Fiskideildar, XVI:209–238.
- ↑ Jakobsson, J. and G. Stefánsson, 1999. Management of Icelandic summer spawning herring off Iceland. ICES Journal of Marine Science, 56: 827–833
- ↑ Jakobsson, J., 1980. Exploitation of the Icelandic spring- and summerspawning herring in relation to fisheries management, 1947–1977. ICES Rapports et Procès-Verbaux des Réunions, 177: 23–42.
- ↑ Astthorsson, O.S. and H. Vilhjálmsson, 2002. Iceland Shelf LME: decadal assessment and resource sustainability. In: K. Sherman and H.R. Skjoldal (eds.). Large Marine Ecosystems of the North Atlantic, pp. 219–243. Elsevier Science.--Vilhjálmsson, H., 1994. The Icelandic capelin stock. Capelin ''Mallotus villosus'' (Muller) in the Iceland, Greenland, Jan Mayen area. Rit Fiskideildar, 13(1), 281p.--Vilhjálmsson, H., 2002. Capelin (Mallotus villosus) in the Iceland–East Greenland–Jan Mayen ecosystem. ICES Marine Science Symposia, 216:870–883.
- ↑ Sæmundsson, B., 1934. Probable influence of changes in temperature on the marine fauna of Iceland. ICES Rapports et Procès-Verbaux des Réunions, 86:3–6.
- ↑ Marteinsdottir, G. and G. Begg, 2002. Essential relationships incorporating the influence of age, size and condition on variables required for estimation of reproductive potential in Atlantic cod ''Gadus morhua'' stocks. Marine Ecology Progress Series, 235:235–256.--Marteinsdottir, G. and A. Steinarsson, 1998. Maternal influence on the size and viability of Iceland cod (''Gadus morhua L.'') eggs and larvae. Journal of Fish Biology, 52(6):1241–1258.
- ↑ Sæmundsson, B., 1934. Probable influence of changes in temperature on the marine fauna of Iceland. ICES Rapports et Procès-Verbaux des Réunions, 86:3–6.
- ↑ Ibid..
- ↑ Agnarsson, S. and R. Arnason, 2003. The Role of the Fishing Industry in the Icelandic Economy. An Historical Examination.Working paper W03:08. Institute of Economic Studies, University of Iceland.
- ↑ Anon, 2000. Udvikling i nogle centrale økonomiske konjunkturindikatorer. Konjunkturstatistik 200: 2. Statistics Greenland. <a class="external free" href="http://www.statgreen.gl/dk/publ/konjunk/00-1konj.pdf" rel="nofollow" title="http://www.statgreen.gl/dk/publ/konjunk/00-1konj.pdf">http://www.statgreen.gl/dk/publ/konjunk/00-1konj.pdf</a>
- ↑ Arnason, R., 1994.The Icelandic Fisheries: Evolution and Management of a Fishing Industry. Fishing News Books, Oxford.
- ↑ Ibid..
- ↑ Agnarsson, S. and R. Arnason, 2003.Op. cit.--Arnason, R., 1994.The Icelandic Fisheries: Evolution and Management of a Fishing Industry. Fishing News Books, Oxford.
- ↑ Ibid..
- ↑ Ibid..
- ↑ Vestergaard and Arnason, 2004
- ↑ Hvingel, C., in prep. Shrimp (''P. borealis'')-cod (''G. morhua'') interactions and their implications for the management of the West Greenland fisheries.
- ↑ Hvingel, C., 2003. A Predictive Fisheries Model for Greenland. Discussion paper.