Fisheries and aquaculture in the North Pacific (Bering Sea)
Lead Authors: Hjálmar Vilhjálmsson, Alf Håkon Hoel; Contributing Authors: Sveinn Agnarsson, Ragnar Arnason, James E. Carscadden, Arne Eide, David Fluharty, Geir Hønneland, Carsten Hvingel, Jakob Jakobsson, George Lilly, Odd Nakken,Vladimir Radchenko, Susanne Ramstad,William Schrank, Niels Vestergaard,Thomas Wilderbuer
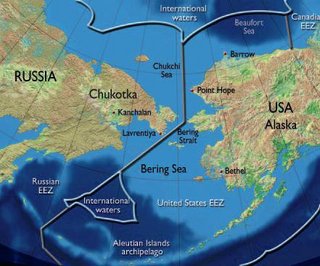 Fig. 13.33. Bering Sea and adjacent areas overlain by the EEZs of Russia and the United States, respectively. (Source: ACIA)
 The continental shelves of the eastern and western Bering Sea together produce one of the world’s largest and most productive fishing areas (Fig. 13.33).They contain some of the largest populations of marine mammals, birds, crabs, and groundfish in the world[6]. A quarter of the total global yield of fish came from here in the 1970's. The central Bering Sea contains a deep basin that separates the shelves on the Russian and American sides and falls partly outside the 200 nautical mile (nm) Exclusive Economic Zone (EEZ)s of the two countries. Prior to extended fishing zones, a complex set of bi and multilateral fisheries agreements was established for the area. These range from agreements on northern fur seal (Callorhinus ursinus) harvests and Canada/US fisheries for Pacific salmon (Oncorhynchus spp.) and Pacific halibut (Hippoglossus stenolepis), to the multilateral International North Pacific Fisheries Convention for the development and use of scientific information for managing fisheries on the high seas[[[7]]]. (Various post-EEZ license agreements have permitted fishing by non-Russian and US fleets. At present such fishing is precluded in the US EEZ and is much reduced in waters of the Russian Federation.) In the so-called “Donut Hole”, a pocket of high seas area surrounded by US and Russian EEZs, scientific research and commercial fishing are carried out in accordance with the Convention on the Conservation and Management of Pollock Resources in the Central Bering Sea by the two coastal states and Japan, Korea, Poland, and China. The North Pacific Science Organization (NPSO) and the North Pacific Anadromous Fish Commission (NPAFC) were established to facilitate fisheries and ecosystem research in the North Pacific region, including the Bering Sea.
Commercial fisheries in the Bering Sea are generally large-scale trawl fisheries for groundfish of which about 30% of the total catch is processed at sea and the rest delivered to shoreside processing plants in Russia and the United States. Home port for many of the Bering Sea vessels is outside the ACIA region reflecting the comparative advantage of supply and service available in lower cost regions. Small coastal communities have a strong complement of indigenous peoples with subsistence fishing interests.They depend on coastal species, especially salmon, herring, and halibut, but the overlap with commercial activities is generally small. Anadromous species extend far inland via the complex river systems and are critical resources for indigenous peoples. The chief indigenous involvement in the marine commercial sector is the Community Development Program in the Northeast Pacific where 10% of TACs (Total Allowable Catches) are allocated to coastal communities and their chosen partners[8]. Because the eastern Bering Sea is within the EEZ of the United States, harvest levels of commercially important species of fish and invertebrates are regulated through federal laws. Management plans exist for the major target species that specify target fishing mortality levels calculated to maintain the long-term female spawning stock levels at 40% of the unfished equilibrium level for fully exploited species. In the western Bering Sea, within the Russian EEZ, fishery management is executed on the basis of an annual TAC established for all commercial stocks of fish, invertebrates, and marine mammals. Allowable catch is calculated as a percentage of the fishable stock. Percentages for individual stocks and species were based on early scientific studies and do not exhibit annual change. However, since 1997, these harvest percentages have been revised by government research institutes, using new modeling applications and adaptive management approaches. The recommended TACs are approved by the special federal agency and issued as a governmental decree.
Annual catches of all commercial groundfish species between 1990 and 2001 in the US eastern Bering Sea EEZ ranged from 1.3 to 1.8 million t and averaged 1.6 million t. The walleye pollock (Theragra chalcogramma) catch averaged 1.2 million t and ranged from 0.99 to 1.45 million t[9]. In the western Bering Sea, the total groundfish catch reached 1.45 million t in 1988 of which walleye pollock contributed 1.29 million t. The annual catch of walleye pollock between 1990 and 2001 averaged 0.73 million t ranging from 0.45 to 1.06 million t. Walleye pollock comprised 89% of the catch, on average, over the 11-year period. Aquaculture is not a particularly important activity in the Bering Sea region. In the eastern Bering Sea region, Alaska has adopted policies that prohibit aquaculture but enable some land-based hatcheries that produce salmon for release into the sea to supplement at times of low escapement. Some of these salmon pass through the eastern Bering Sea and may have some effect on larvae, for example red king crab (Paralithodes camtschaticus) larvae, but this has not been demonstrated. None of the hatcheries operate in the western Bering Sea region[10].
Contents
- 1 Ecosystem essentials (13.5.1)
- 2 Fish stocks and fisheries (13.5.2)
- 3 Past climatic variations and their impact on commercial stocks (13.5.3)
- 4 Possible impacts of climate change on fish stocks (13.5.4)
- 5 The economic and social importance of fisheries (13.5.5)
- 6 Variations in Bering Sea fisheries and socio-economic impacts: possible scenarios (13.5.6)
- 7 Ability to cope with change (13.5.7)
- 8 Concluding comments (13.5.8)
- 9 References
Ecosystem essentials (13.5.1)
The Bering Sea is a subpolar sea bounded by the Bering Strait to the north and the Aleutian Islands archipelago to the south (Fig. 13.33). Geographically, the Bering Sea lies between 52º and 66º N, and 162º E and 157º W. The narrow (85km long) and shallow (<42m deep) passage of the Bering Strait connects the Bering Sea to the more northern Chukchi Sea and the Arctic Ocean to the north. The sea area covers almost 3 million km2 and is divided almost equally between a deep basin in the southwest and a large, extensive continental shelf in the east and north. The eastern continental shelf is 1200km in length, exceeds 500km in width at its narrowest point, and is the widest continental shelf outside the Arctic Ocean[[[11]]]. The shelf is a featureless plain that deepens gradually from its extensive shoreline to the shelf break at about 170m depth. There are very limited commercial fisheries in the Chukchi Sea or the Arctic Ocean north of the Bering Strait due to a known lack of resources, operating difficulties, and distance from markets. Marine mammal populations are locally important for subsistence use.
Fish stocks and fisheries (13.5.2)
This section describes the life history characteristics, distribution, and trends in abundance and fisheries for the main species which are or have been the subject of important fisheries or which are important as forage fish for such species. Catch records for the major groundfish species of the eastern and western Bering Sea are shown by species in Figs. 2 and 3 respectively.
Capelin
In the Bering Sea, adult capelin only occur near shore during the month surrounding the spawning run. In other months they occur far offshore. In the eastern Bering Sea capelin occur in the vicinity of the Pribilof Islands and the continental shelf break; in the western Bering Sea they occur in the northern Anadyr Gulf and near the northwestern Kamchatka coast. The seasonal migration may be associated with the advancing and retreating sea-ice edge. In the eastern Bering Sea, sea ice retreats during summer. As a coldwater species, capelin may migrate in close association with the retreating ice edge resulting in the summer capelin biomass located in the northern Bering Sea, an area not covered by surveys and with very little commercial fishing. Capelin aggregations near the northwestern Kamchatka coast have a stable distribution over the warm season. It is reported that the biomass of capelin and smelt grows in periods of climatic transition, when the abundance of other common pelagic fish (walleye pollock and herring) are low in the western Bering Sea[12]. Capelin biomass was estimated at 200,000t on the western Bering Sea shelf between 1986 and 1990. Their biomass may be much larger on the expanded eastern shelf. Nevertheless, capelin are not commercially exploited in the Bering Sea. In Russia, some attempts were made to include capelin and polar cod in a commercial fishery in the mid-1990s. Capelin are a major component of the diets of marine mammals feeding along the ice edge in winter[13] and of seabirds in spring.
Greenland Halibut
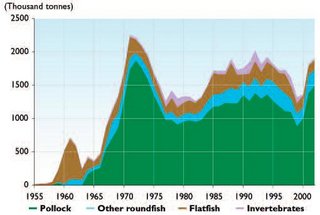 Fig. 13.34. Catch by species from the eastern Bering Sea, 1955–2002[1]. (Source: ACIA)
 In the Bering Sea, Greenland halibut (commonly known as Greenland turbot) spend the first three or four years of life on the continental shelf after which they migrate to deep waters of the continental slope where they live as adults[14]. Although tagging studies show that they undergo feeding and spawning migrations in the North Atlantic Ocean, it is unknown to what extent this happens in the Bering Sea. A slow growing and long-lived species, Greenland halibut reach over 100cm in length and 20 years of age in the Bering Sea. Greenland halibut are a valuable commercial product and have been caught in trawling operations and by longlines. Catches of Greenland halibut and arrowtooth flounder were reported together in the 1960's; combined catches ranged from 10,000 to 58,000t per year with an average annual catch of 33,700t. The Greenland halibut fishery intensified in the 1970's with catches of this species peaking between 1972 and 1976 at 63,000 to 78,000t per year, primarily taken by distant-water trawl fleets from Japan. Catches declined after implementation of the Magnuson Fishery Conservation and Management Act (FCMA) in 1977, where the US fisheries jurisdiction was extended to 200nm from the coast. However, catches were still relatively high in 1980 to 1983 with an annual range of 48,000 to 57,000t. After that, trawl harvest declined steadily and averaged 8,000t between 1989 and 2000. This decline is mainly due to catch restrictions placed on the fishery because of declining recruitment and market conditions. In the western Bering Sea, Greenland halibut were lightly exploited due to low stock abundance before the FCMA took effect in the eastern Bering Sea. In 1978, a Greenland halibut fishery began on the northwestern continental slope, mostly by longlines. Annual harvest varied from 2,010 to 6,589t between 1978 and 1990 with part of the harvest resulting from bycatch in the Pacific cod longline fishery. Since the early 1990's, Greenland halibut stock abundance and catches have declined. Resource assessment surveys on the continental shelf in 1975 and between 1979 and 2002 showed that intermediate size Greenland halibut (40–55 cm) were present throughout the region from 50 to 200 m depth during the late 1970's and early 1980's[15]. By 1985 and 1986 the distribution range had decreased such that Greenland halibut were only encountered in the area to the west and south of St. Matthew Island and at much reduced densities. Since then, fish of this size range have only been caught in small quantities in the northern part of the survey area. It is unknown whether environmental conditions in the late 1970's and early 1980's were favorable for strong recruitment of Greenland halibut and levels have since returned to more normal recruitment levels, or whether there has been reduced recruitment to this stock since the mid-1980's. However, stock assessment models suggest a declining population since 1985[16]. Greenland halibut are widely distributed in the western Bering Sea but are not abundant there. The most significant Greenland halibut aggregations occur on the outer continental shelf and slope along the Korjak coast[17]. Survey results indicate that Greenland halibut abundance was higher in the northern Bering Sea in the 1990's than in the 1980's. However, the total biomass and overall distribution of this flatfish decreased in the Bering Sea region as a whole.
Shrimp
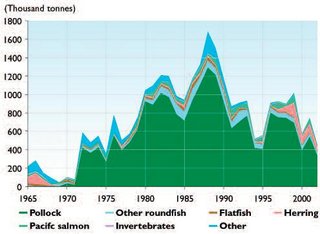 Fig. 13.35. Catch by species from the western Bering Sea, 1965–2002 (1965–1993 data from Committee on the Bering Sea Ecosystem[2]; 1994–2003 data from the TINRO-Center archive,Vladivostok, Russia). (Source: ACIA)
 Pandalid shrimp (primarily Pandalus jordani) are widely distributed along the outer third of the eastern continental shelf where they are consistently caught in resource assessment trawl catches in small numbers. Humpy shrimp (P. goniurus) are distributed throughout the northern Bering Sea shelf and the Anadyr Gulf, in contrast to northern shrimp (P. borealis), which are much less abundant. Northern shrimp were the first commercially exploited shrimp in the Bering Sea after aggregations were discovered on the outer shelf north of the Pribilof Islands in 1960[18]. This fishery was conducted by Japanese vessels and peaked at 31,600t in 1963. After that the northern shrimp stock declined sharply and commercial fishing ceased after 1967. Since then there has been no fishery for pandalid shrimp in the Bering Sea. Humpy shrimp aggregations were discovered in the Anadyr Gulf in 1967. A large-scale Russian trawl fishery harvested humpy shrimp in the northern Bering Sea in late 1960's to 1970's until they too became less abundant. Individual trawl catches of Humpy shrimp reached 10t per 15 minute haul in the Anadyr Gulf, which became the catch value record in the world shrimp fishery. Humpy shrimp biomass was estimated at 350,000t in the Anadyr Gulf in 1975. The annual Russian harvest of humpy shrimp exceeded 11,200t in 1978[19] but then declined due to the lack of a market for small-sized shrimp. Other pandalid shrimp species were also caught as bycatch in the pursuit of other target species.
Polar Cod
Polar cod are caught in small amounts in resource assessment surveys at the northernmost survey stations on the eastern Bering Sea shelf. The southern extent of their summer distribution is related to bottom water temperature where they have been found to range from 59º N in 1999 (coldest year) to 62º N in 1996 (warmest survey year on record, except 2003). Since polar cod are found at such high latitudes, little information is available on their life history characteristics in the eastern Bering Sea and they are not pursued as a commercial species due to their low abundance. In the northwestern Bering Sea and the Chukchi Sea, polar cod are distributed at depths from 15 to 251m[[[20]]]. A local fishery on polar cod existed there during years of high abundance (1967–1970[21]).
Crabs
Snow crab and Tanner crab (Chionoecetes bairdi) are distributed throughout the eastern Bering Sea shelf with the exception of the shallow waters of Bristol Bay[22]. The abundance of commercial size males was estimated at 183.5 million crabs in 1988[23]. The distribution extends beyond the study area to the north and west, and to a small extent into the Gulf of Alaska. Owing to the relatively narrow shelf area of the western Bering Sea, snow crab abundance is notably less there. In 1969 the number of commercial size males was estimated at 25 million crabs[24]. An intensive directed fishery began for snow crab in the Bering Sea in the 1980's. They were initially caught incidental to the pursuit of red king crab until 1964 when both Japan and Russia increased their effort for this species due to a bilateral agreement with the United States to limit king crab catches[25]. The combined Japanese–Russian catch of snow and Tanner crab increased until 1970 to 22,844t[26], after which quotas were established for these nations’ fishing fleets and the catch was sharply reduced. The American pot fishery (non trawl) began shortly after and catches increased during the 1980's to a peak in 1991 at 172,588t. Catches rapidly declined with stock decrease but increased again in the mid-1990's as the snow crab stock condition improved. Since 2000, the stock has again declined and the commercial fishery is presently operating under reduced quotas. The Tanner crab fishery has been closed since 1997 in the eastern Bering Sea[27]. In the western Bering Sea, there was no commercial snow crab or Tanner crab fishery in 2000 and 2001. Only insignificant catches (250t) were allowed during research surveys. The results indicated some improvement in stock condition and a small commercial fishery was allowed in 2002.
Pollock
Walleye pollock (hereafter referred to as pollock) is the most abundant species within the Bering Sea and is widely distributed throughout the North Pacific Ocean in temperate and subarctic waters[28]. Pollock are a semidemersal schooling fish, which become increasingly demersal with age. They are a relatively short-lived (natural mortality estimated at 0.3) and fast-growing fish, females usually become sexually mature at four years of age. The maximum recorded age is about 22 years. The stock structure of Bering Sea pollock is not well defined. In the US part of the Bering Sea, pollock are considered to form three stocks for management purposes: the eastern Bering Sea stock (which comprises pollock occurring on the eastern Bering Sea shelf from Unimak Pass and to the US–Russian Convention line), the Aleutian Islands Region stock (which occurs within the Aleutian Islands shelf region from 170° W to the US–Russian Convention line), and the Central Bering Sea stock (known as the Bogoslof Island pollock, and which are thought to be a mixture of pollock that migrate from the US and Russian shelves to the Aleutian Basin around the time of maturity). There are only two stocks in the Russian EEZ. Pollock currently support the largest fishery in US waters and comprise 75 to 80% of the annual catch in the eastern Bering Sea and around the Aleutian Islands. From 1954 to 1963, pollock were only harvested at low levels in the eastern Bering Sea. Directed foreign fisheries first began in 1964 after which catches increased rapidly during the late 1960's, and peaked in 1970 to 1975 when they ranged from 1.3 to 1.9 million t per year. Following a peak catch of 1.9 million t in 1972, catches were reduced through bilateral agreements with Japan and Russia. Since the US claim to extended jurisdiction in 1977, the annual average eastern Bering Sea pollock catch has been 1.2 million t, ranging from 0.9 million t in 1987 to nearly 1.5 million t (including the Bogoslof Islands area catch in 1990), while stock biomass has ranged from a low of 4 to 5 million t to highs of 10 to 12 million t[29]. In 1980, US vessels began fishing for pollock and by 1987 were able to take 99% of the quota. Since 1988, only US vessels have been operating in this fishery and by 1991, the current domestic observer program for this fishery was fully operational. In the southwestern Bering Sea, the pollock fishery developed slowly during the mid-1960's stabilizing at 200,000 to 300,000 t in the latter half of the 1970's and the 1980's. After 1995, there was a reduction in harvest due to a decline in pollock stocks in the western Bering Sea. After that, the total pollock catch in the Russian EEZ was maintained by increasing fishing activity in the Navarin region between 1996 and 1999, and ranged from 596,000 to 753,000 t. The pollock catch subsequently declined in the northern region due to poor stock condition as well as to the application of precautionary approaches in pollock fishery management. The total pollock catch in the Russian EEZ declined from 1,327,000t in 1988 to 393,180t in 2000. Vessels of “third countries” began fishing in the mid-1980's in the international zone of the Bering Sea (commonly referred to as the “Donut Hole”).The Donut Hole is located in the deep water of the Aleutian Basin and is distinct from the customary areas of pollock fisheries, namely the continental shelves and slopes. Japanese scientists began reporting the presence of large quantities of pollock in the Aleutian Basin in the mid- to late 1970's, but large-scale fisheries did not begin until the mid-1980's. Thus, the Donut Hole catch was only 181,000t in 1984, but grew rapidly and by 1987 exceeded the catch within the US Bering Sea EEZ. The outside-of-EEZ catch peaked in 1989 at 1.45 million t and then declined sharply. By 1991, the Donut Hole catch was 80% less than the peak value, with subsequent low catches in 1992 and 1993. A moratorium was enforced in 1993 and since then only minimal pollock catches have been harvested from the Aleutian Basin by resource assessment fisheries.
In response to continuing concerns over the possible impacts groundfish fisheries may have on rebuilding populations of Steller sea lions (listed as an endangered species after four decades of decline), changes have been made in regulations of the pollock fisheries in the eastern Bering Sea and at the Aleutian Islands. Pollock are important prey items for Steller sea lions and these changes were designed to reduce the possibility of competitive interaction of the fishery with Steller sea lions. For the fisheries, comparisons of seasonal fishery catch and pollock biomass distributions in the eastern Bering Sea led to the conclusion that the fishery had disproportionately high seasonal harvest rates within critical sea lion habitat which could lead to reduced sea lion prey densities. Consequently, management measures were designed to redistribute the fishery both temporally and spatially according to pollock biomass distributions (the underlying assumption being that the independently derived area-wide and annual exploitation rate for pollock would not reduce local prey densities for sea lions).
Pacific cod
Pacific cod are widely distributed from southern California to the Bering Sea, although the Bering Sea is the center of greatest abundance for this species. Tagging studies have shown that they migrate seasonally over large areas. In late winter, Pacific cod converge in large spawning concentrations over relatively small areas. Spawning takes place over a wide depth range (40–290m) near the bottom. Eggs are demersal and adhesive. Estimates of natural mortality range from 0.29 to 0.99, while a value of 0.37 is used in the stock assessment model. Pacific cod have been found aged up to 19 years and females are estimated to reach 50% maturity at 5.7 years, corresponding to an average length of 67cm. Pacific cod are the second largest Bering Sea groundfish fishery. Beginning in 1964, the Japanese trawl fishery for pollock expanded and cod became an important bycatch species and an occasional target species during pollock operations (in the early 1960's, a Japanese longline fishery harvested Bering Sea Pacific cod for the frozen fish market). By 1977, foreign catches of Pacific cod had consistently been in the 30,000 to 70,000 t range for a full decade[30]. The foreign and joint venture sectors dominated catches through 1988, when a US domestic trawl fishery and several joint venture fisheries began operations. By 1989, the domestic sector was dominant and by 1991 the foreign and joint venture operations had been displaced entirely. Catches of Pacific cod since 1978 have ranged from 33,000t in 1979 to 232,600t in 1997 with an average of about 141,900t. At present, the Pacific cod stock is exploited by a multiple-gear fishery, including trawl, longline, pot, and jig components (with the exception of 1992, the trawl catch was the largest component of the fishery (in terms of catch weight) between 1978 and 1996. Since 1997, the longline fleet has taken the greatest proportion of Pacific cod). Pacific cod were estimated to be at low abundance levels in 1978 but experienced strong recruitment (age 3) in the early 1980's, which built the stock to high levels. The population biomass peaked at 2.5 million t in 1987 and then declined gradually to about half the peak value in 2001. In the western Bering Sea, the Russian cod fishery developed slowly and was mostly unsuccessful until the late 1960's. Several attempts were undertaken by Japanese and local fishermen in longline and trawl fisheries development in the 1920's and 1930's. Meanwhile, commercially significant Pacific cod concentrations were described by scientific expeditions. In particular, dense aggregations were found in the northwestern area in 1950 to 1952 near the Navarin Cape[31]. This led to the organization of a special cod fishery expedition in 1968[32]. Pacific cod harvest from this area ranged from 6,500 to 24,500 t in the first years, and peaked at 117,650 t in 1986. In the 1990's, catches declined due to a restructuring of the fishery and, in recent years, from decreases in cod abundance in the North Pacific. Pacific cod biomass was estimated at 766,000 t in 1989[33] and had declined to 172,000 t by 2000.
Flatfish
The flatfish harvest and resource is much smaller in the southwestern Bering Sea with its relatively narrow shelf than in the eastern Bering Sea. A directed flatfish fishery began in the mid-1950s in the southwestern Bering Sea. This is a small-scale land-based fishery using Danish seines and, to a lesser extent, trawls. Yellowfin sole (Limanda aspera) comprise the main part of the flatfish harvest in the southwestern Bering Sea (72.7% of the predicted flatfish TAC for 2002 and about 74% in Danish seine catches in recent years) and its biomass is estimated at 78,000t on the southwestern shelf compared to 1.6 million t in the eastern Bering Sea. Maximum catches in the southwestern Bering Sea, 32,000 and 20,000 t respectively, were registered in 1958 and 1959. The situation changed dramatically in 1960 and 1961 when the flatfish harvest fell to its lowest ever values (100 to 160 t). The stock condition improved over the following decades. By the mid-1960's catches had stabilized at approximately 6,000t per year which continued through 1974, after which they declined until the early 1980's. During 1996 to 2002, the flatfish catch in the southwestern Bering Sea varied from 6,000 to 13,500t. In terms of other flatfish species, Alaska plaice (Pleuronectes quadrituberculatus), rock sole (Lepidopsetta bilineata), and northern flathead sole (Hippoglossoides robustus) are the most important in the southwestern Bering Sea.
The abundance of yellowfin sole is low in the northwestern Bering Sea. The most important flatfish species is northern flathead sole, which accounts for about two-thirds of the total flatfish biomass, followed by Alaska plaice, and rock sole. A directed flatfish fishery did not begin in the northwestern region until the 1990's and never developed extensively. However, the flatfish bycatch sometimes reached significant levels and between 1965 and 1984 ranged from 2,440 to 29,140 t in the northwestern Bering Sea. The flatfish bycatch increased to 33,460t in 1985 and 39,900t in 1986, leveling off at 24,000 to 29,000 t over the next six years, and then declining to an average of 9,700t after 1993. A target flatfish fishery did not develop extensively, and the target catches remained less than the bycatch in the large cod and pollock fisheries.
In the eastern Bering Sea, yellowfin sole is distributed from British Columbia to the Chukchi Sea, into the western Bering Sea, and south along the Asian coast to about 35º N off the South Korean coast[34]. In the Bering Sea, it is the most abundant flatfish species and is the target of the largest flatfish fishery in the United States. While also found in the Aleutian Islands region and the Gulf of Alaska, the center of abundance for this stock is on the eastern Bering Sea shelf. Adults are benthic and occupy separate winter and spring/summer spawning and feeding grounds. They overwinter near the shelf break at approximately 200m depth and move into nearshore spawning areas as the shelf ice recedes[35]. Spawning is protracted and variable, beginning as early as May and continuing through August, occurring primarily in shallow water at depths less than 30m[36]. Eggs, larvae, and juveniles are pelagic and usually found in shallow areas. The estimated age at 50% maturity is 10.5 years with a length of about 29cm[37]. The natural mortality rate is likely to be within the range 0.12 to 0.16, with a maximum recorded age of 33 years[38]. Yellowfin sole have been caught with bottom trawls on the Bering Sea shelf every year since the fishery began in 1954. Between 1959 and 1962 yellowfin sole was overexploited by Japanese and Russian trawl fisheries when catches averaged 404,000t annually. As a result stock abundance declined. Catches also declined to an annual average of 117,800t between 1963 and 1971, declining further to an annual average of 50,700t between 1972 and 1977. The yield in this latter period was partially due to the discontinuation of the Russian fishery. In the early 1980's, catches increased peaking at over 227,000t in 1985. In the 1980's, there was a major transition in the characteristics of the fishery in the eastern Bering Sea. Before this, yellowfin sole were taken exclusively by non-US fisheries and these fisheries continued to dominate through 1984. However, US fisheries developed rapidly in the 1980's, and foreign fisheries were phased out. Since 1990, only domestic harvesting and processing has occurred.The 1997 catch of 181,389t was the largest since the fishery became completely domestic, but decreased to 101,201t in 1998. The 2000 catch totaled 83,850t and the 2001 catch was 63,400t. For many years in the 1990's the yellowfin sole fishery was constrained by closures in order to attain the bycatch limit of Pacific halibut allowed in the yellowfin sole directed fishery. Stock biomass has declined by 1 million t from the peak biomass observed in 1985 and was estimated at 1.6 million t in 2002.
Salmon
The Bering Sea is important habitat for many stocks comprising the five species of Pacific salmon during the ocean phase of their life history. Here, the various stocks intermingle from origins in Siberia, Alaska, the Aleutian Islands, Japan, Canada, and the US west coast. The earliest fisheries for salmon were probably indigenous subsistence fisheries in which salmon were captured returning to their native streams to spawn. During the 20th century there were three main fisheries for salmon in the Bering Sea: the Russian and Alaskan domestic fisheries, the Japanese high-seas gillnet and longline fishery, and the bycatch of salmon in the groundfish fisheries.
Salmon canneries first appeared on the Alaskan side of the Bering Sea in the late 1890's to process fish returning to Bristol Bay. It is reported that between 1894 and 1917 the Kvichak and Nushagak [[river]s] flowing into Bristol Bay produced 10 million sockeye salmon (Oncorhynchus nerka) annually[39]. Purse seines and gill nets were the primary fishing gear in the early days of the fishery. Gill nets were hauled from the beach using horses, which were later replaced by engines, whereas the purse seine fishery started around 1915 with the advent of powered fishing craft. Purse seining continues to the present as the primary gear in a highly mobile fleet fishing near-shore, which assures the targeting of specific salmon stocks. Although all five species of Pacific salmon are present in Bristol Bay, sockeye salmon are the most abundant and have dominated the salmon catch for years.The Bristol Bay salmon catch for all species totaled 42 million fish in 1993, of which 41 million were sockeye salmon, the largest catch on record (fishery statistics from the Pacific salmon fishery on the western Bering Sea coast (eastern Kamchatka region) are available since 1906). On average, pink salmon (O. gorbuscha) contributed 73.8% of the Russian salmon catch in the western Bering Sea between 1952 and 1993, chum salmon (O. keta) 24.2%, sockeye salmon 1.3%, chinook salmon (O. tshawytscha) 0.6%, and coho salmon (O. kisutch) only 0.1%[40]. Since 1989, the runs of pink salmon to the eastern Kamchatka coast have been in good condition in odd years. The historical highest catch totaled 83,640t in 1999. The average pink salmon catch (38,390t) for 1989 to 2001 is more than twice the average level of 15,996t for 1952 to 1993[41]. Similarly, chum salmon catches were stable at 11,000 to 12,000 t in 2000 to 2001 compared to 5,250t for 1952 to 1993. The recent improved stock conditions coincide with new fishery regulations, which limit the chum salmon bycatch during the pink salmon fishery. The main sockeye salmon fishery in eastern Kamchatka results from the productive Kamchatka River, slightly south of the Bering Sea.
The Japanese high-seas gillnet and longline salmon fishery expanded into the Bering Sea in 1952 with three motherships and 57 catcher boats, which increased to 14 motherships and 407 catcher boats by 1956[42]. (Motherships are large vessels to which catcher boats deliver their catches and where the fish are processed for human consumption or reduced to meal and oil, they also carry fuel and other provisions for the catcher fleet.) The peak catch of 116,200t occurred in 1955 and annual catches ranged from 71,000 to 87,000 t between 1957 and 1977[43]. Sockeye, chum, and pink salmon comprised 95% of the catch in this fishery, which ceased operations in 1983. The bycatch of salmon in the commercial groundfish fisheries is of less importance than for the directed fisheries, but still accounts for fishing mortality important to resource managers. Observer sampling of the groundfish fishery indicates that chinook salmon are more frequent in bottom trawls and the other species more frequent in the pelagic trawls[44]. In the western Bering Sea, primarily chinook and chum salmon were present in the bottom trawl catches during research surveys in 1974 to 1991[45].
Marine mammals
The Bering Sea contains a rich and diverse assemblage of marine mammals, including north temperate, arctic and subarctic species. Twenty-six species from the orders Pinnipedia (sea lions, walrus, and seals), Cetacea (whales, dolphins, and porpoises), and Carnivora (sea otter), and polar bears are present at varying times of the year[46]. Some species are resident throughout the year (e.g., harbour seal, Steller sea lion, sea otter (Enhydra lutris), beluga whale (Delphinapterus leucas), and Dall’s porpoise (Phocoenoides dalli)) while others migrate into the Bering Sea during the summer on feeding excursions. Arctic species including polar bears, walrus, ringed and bearded seals (Erignathus barbatus), and bowhead whales (Balaena mysticetus) mostly occur in the Bering Sea during autumn and winter and are associated with the presence of seasonal sea ice. Most of the marine mammal species are found over the continental shelf and in coastal areas, although five whale species reside in the deep/oceanic waters of the Bering Sea basin[47].
Harvesting of marine mammals has occurred since at least 1790, the first year when northern fur seal harvests were recorded[48]. The harvest peaked in the 1870's at over 100,000 animals and was at levels exceeding 40,000 males annually until 1985 when the northern fur seal commercial harvest was stopped and only subsistence hunting by Aleuts was allowed in the Pribilof Islands. In the Russian EEZ, fur seal hunting has seen many changes since the mid-1980's. Since 1987, the experimental hunting of “silver” fur seals (aged 3–4 months) has been conducted on the Commander Islands[49]. The harvest rate was established at 60% from the average annual male abundance for 1987 to 1989. Actually, significantly less than 50% were killed, which has further decreased to less than 30% since 1989. The number of animals killed decreased from 6,700 in 1995 to 3,000 in 1999 and 2,180 in 2000. The declining harvest is related to the decline in the fur seal population and the negative effect of disturbance by hunters on seal reproduction. All fur seal hunting is presently restricted to Bering Island. Bachelor males aged from two to five years were hunted on Medny Island until the mid-1990's (2,134 animals were killed in 1994) and this area was then closed to harvesting in 1995. Whaling spread to the Bering Sea in the mid-19th century when large numbers (2,500 in 1853) of bowhead whales were taken[50]. This harvest continued for 50 years until the bowhead whale population became depleted. The current subsistence harvest totals 60 to 70 whales annually. Some species, such as humpback and grey whales (Eschrictius robustus), which are present in the Bering Sea in summer, were historically harvested during the winter near Hawaii and California and in waters off the Chukotski Peninsula (about 130 to 135 whales). Kenyon[51] reported that Steller sea lions were very abundant in the Pribilof Islands when discovered in 1786, but were soon overhunted. After protective measures were taken, numbers grew from a few hundred in 1914 to about 6,000 in 1960.The population has since declined to low numbers and has been the subject of extensive research to find the cause of the decline.
In the United States, stock assessment information on the 39 stocks of the 24 species of marine mammals in the Bering Sea are used to classify each stock as either strategic, non-strategic, or not available[52]. Strategic stocks are those considered threatened, endangered, or depleted under US law. The strategic stocks include: northern fur seal, sperm whale, humpback whale, fin whale, the North Pacific right whale (Eubalaena japonica), and the bowhead whale. Three Bering Sea stocks also have further designations: northern fur seals are designated as depleted under the Marine Mammal Protection Act, and the western stock of Steller sea lion is listed as endangered under the Endangered Species Act, as is the bowhead whale. Nine of the 39 marine mammal stocks are estimated to be increasing, five are stable, three are declining, and the status of the others is unknown. Subsistence harvest is allowed for three species: northern fur seals, beluga, and bowhead whales. In Russia, marine mammal populations are classified as commercial, non-commercial, or protected. Protected species include all whales and dolphins (with the exception of grey whales, whaled by indigenous people for subsistence), sea otter, and polar bear. Some commercial quota is established for beluga whales, but is not taken. Walrus, spotted seal (Phoca largha), ringed seal, and ribbon seal (P. fasciata) are hunted in the northwestern Bering Sea. However, their harvest has been relatively low since the cessation of ship-based hunting operations. In 1998 to 2000, the harvest was less than 60% of the established TAC on different seal species and averaged 32.8%.
Past climatic variations and their impact on commercial stocks (13.5.3)
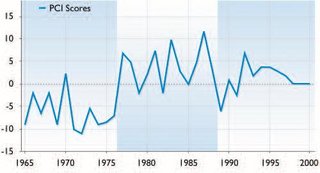 Fig. 13.36 Regime shifts in the Bering Sea, 1968–2000(composite of 31 physical indicators[3]). (Source: ACIA)
 Climate change primarily influences ocean water [[temperature]s] through the regulation of synoptic atmospheric processes and water exchange between the western Bering Sea and the Pacific Ocean. Four physical processes determine the change in ocean climate regimes in the North Pacific[53]: the lunar tidal cycle, variations in solar radiation[54], changes in the North Pacific circulation that affect air–sea exchange of heat and, finally, changes in the momentum of the Aleutian Low atmospheric pressure pattern. These processes generate a subset of basin-scale factors, each of which contributes to the oceanographic conditions of the Bering Sea. The Aleutian Low is an example of an atmospheric activity center in the northern-hemisphere[55]. Water inflow and atmospheric forcing appear to serve as links in the signal transfer chain for the Bering Sea region. Their functioning reflects the direct effect of the atmosphere on the marine environment through the temperature regime of shelf waters, and the undirected oceanographic phenomena offshore. The signal propagates through changes in the general current pattern and tidal wave parameters, which determine the intensity of the water exchange between the shelf and open sea regions.
The direct effects of atmospheric forcing resulting from climate variations are very important to the physical oceanographic dynamics of the eastern Bering Sea shelf, which has a characteristically sluggish mean flow and is separated from any direct oceanographic connection to the North Pacific Ocean by the Alaska Peninsula. Therefore, linkages between the eastern Bering Sea shelf and the climate system are mainly a result of the ocean–atmosphere interaction[56]. Climate variations in this region are directly linked to the location and intensity of the Aleutian Low pressure center which affects winds, surface heat fluxes, and the formation of sea ice[57]. The pressure index shows eight statistically significant shifts, alternating between cool and warm periods, over the 20th century, which occurred on roughly decadal time scales[58]. A well-documented shift[59] from a cool to a warm period occurred between 1977 and 1989, which coincided with the commencement of fishery-independent sampling programs and fishery catch monitoring of major groundfish species. Information from the contrast between this period and the prior and subsequent cool periods (1960–1976 and 1989–2000) forms the basis of the following discussion of the response of eastern Bering Sea species to climate induced system changes (Fig. 13.36).
Effects on primary productivity
The influx of Pacific waters northward into the western Bering Sea results in a warming effect. The dynamics of the environmental conditions of the Bering Sea offshore zone and the relatively narrow western shelf are largely determined by the periodic behavior of current patterns[60].The direction and velocity of these currents coincide with changes in the atmospheric circulation pattern, effects which are manifested through the change in intensity of the inflow of North Pacific Ocean water (Seawater). From 1977 to 1989, a period of enhanced atmospheric transport, an intensification of currents into the Bering Sea resulted in enhanced fluctuations in the thermal properties of the system towards a warmer state. During those years, the effect of horizontal water movement and mixing on primary production was almost as important as vertical mixing due to the renewed supply of nutrients necessary for phytoplankton blooms. According to long-term data series, the highest concentrations of spring-time nutrients in the upper mixed layer were observed in the Aleutian straits, over the continental slope, and in areas where the influx of North Pacific water was present. The enhanced rate of primary production may be as much as 10 to 13 g C/m2 per day[61], which is more than can be used by the zooplankton and microheterotrophs (especially in the western Bering Sea shelf). The unutilized primary production accumulates at the upper boundary of subsurface waters, which is relatively cold for microheterotrophs, and the organic matter gradually rises into the upper layers in divergence zones and cyclonic eddies during the warm season. Therefore, favorable conditions for plankton development during spring, both from [[heat]ing] and nutrient supply from Pacific waters, may cascade through higher trophic levels and play a large role in determining the total biological productivity for the year[62].
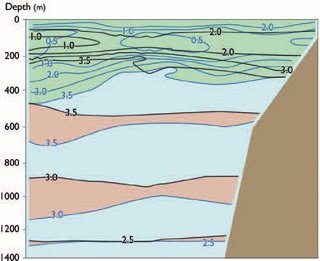 Fig. 13.37. Comparison of vertical temperature (ºC) sections across the Kamchatka Strait on August 13–14, 1991 (black lines[4]) and June 27, 2002 (blue lines, from TINRO Center data, Vladivostok). Pink area indicates the layers where the water temperature was higher in 2002, green area – in 1991. (Source: ACIA)
 Changes in atmospheric climate are mainly transmitted through the eastern Bering Sea physical environment to the biota through wind stress[63] and annual variation in sea-ice extent[64]. These mechanisms directly alter the timing and abundance of primary and secondary production through changes in salinity, mixed-layer depth, upwelling, nutrient supply, and vertical mixing. These environmental changes vary at a decadal scale and resulted in higher levels of primary and secondary production during the warm period of 1977 to 1988 than in the earlier cool period[65]. During periods of low summer storm activity in the Bering Sea region, as in 1993 to 1998, water column stratification increases. Heating of a thin surface layer above the seasonal thermocline prevents vertical nutrient transport from the underlying, stratified layers, which reduces levels of primary production and biological productivity in the Bering Sea[66], despite warmer surface water temperature. This is consistent with the total heat budget of the upper layer of the Bering Sea, which was lower in 2002 than in the warmer period of the previous decade (Fig. 13.37).
In the relatively warm years of 1997 to 1998, there was significant growth in euphausiid biomass in the western Bering Sea[67] suggesting that warmer waters provide favorable conditions for the survival and growth of some subarctic zooplankton species. Crustacean growth rates have also been found to be above average in warm conditions[68]. This enhanced growth rate allows for a longer maturation period and spawning season. A meta-analysis of marine copepod species indicates that growth rate is positively correlated with increasing temperature and that generation time decreases, allowing more productivity in warmer climates[69]. The oceanographic conditions in the epipelagic layer are not considered crucial for copepod reproduction in the Bering Sea, since copepod species reproduce in relatively stable deeper layers below 500m. However, calanoid copepod biomass was much higher in the eastern Bering Sea middle shelf in warm years[70], probably due to higher growth rates. These findings suggest that climate change to a warm period enhances ecosystem productivity from the lower trophic levels, particularly for planktonic crustaceans.
Effects on sea-ice formation, distribution, and longevity
If it is assumed that any future climate change maintains the scale and periodicity of recent climate change events in the Bering Sea, then the period of meridional type predominance in the wind transport above the Bering Sea, which began in the early 1990's, may last for 10 to 12 years before changing to a period of enhanced zonal transport. During the warm 1980's the zonal pattern of atmospheric circulation predominated[71], as was the case in the 1920's and 1930's[72]. Periods of decreased zonal atmospheric circulation index[73] are characterized by colder arctic air masses over the Bering Sea region and a decrease in air temperature. The transitional 1989 to 1990 years were also characterized by a decrease in the zonal atmospheric circulation pattern above the far-eastern seas[74].
Sea-ice distribution and residence time are frequently regarded as integral with the thermal regime of the Bering Sea pelagic zone[1].The dynamics of sea-ice conditions directly depend on the intensity of the shelf water cooling in winter, wind direction, and water exchange between the shelf and the open sea. Similarly, ice conditions determine the intensity and degree of winter convection, the formation of cold near-bottom shelf waters, and the temperature distribution of surface and intermediate layers. The extent and timing of the sea ice also determine the area where cold bottom water temperatures will persist throughout the following spring and summer. This area of cold water, known as the “cold pool”, varies with the annual extent and duration of the ice pack, and can influence fish distributions. For example, adult pollock have shown a preference for warmer water and exhibit an avoidance of the cold pool[76] such that in colder years they utilize a smaller proportion of the shelf waters and in warm years have been observed as far north as the Bering Strait and the Chukchi Sea.
Oscillating control hypothesis
During warm periods, favorable environmental conditions after the seasonal sea-ice retreat can result in a significant increase in the Bering Sea biological productivity. In contrast, physical factors during cold periods adversely affect zooplankton growth and biomass, and thus the viability of the pelagic fish juveniles feeding on this production. The “oscillating control hypothesis” proposes that the southeastern Bering Sea pelagic ecosystem alternates between primarily bottom:up control in cold regimes and primarily top-down control in warm regimes[77]. Late ice retreat (late March or later) leads to an early, ice associated bloom in cold water (as occurred in 1995, 1997, and 1999), whereas no sea ice, or early ice retreat before mid-March, leads to an open-water bloom in May or June in warm water (as occurred in 1996, 1998, and 2000). Zooplankton, particularly crustaceans, are sensitive to water temperature. In years when the spring bloom occurs in cold water, low temperatures limit the production of zooplankton, the survival of larval and juvenile fish, and their recruitment. Such a phenomenon may be important for large piscivorous fish, such as walleye pollock, Pacific cod, and arrowtooth flounder. When continued over decadal scales, this situation leads to bottom:up limitation and a decreased biomass of piscivorous fish. Alternatively, in periods when the bloom occurs in warm water, zooplankton populations should grow rapidly, providing plentiful prey for larval and juvenile fish. In the southeastern Bering Sea, important changes in the biota since the mid-1970's include a marked increase in the biomass of large piscivorous fish and a concurrent decline (due to predation) in the biomass of forage fish, including age-1 walleye pollock, particularly over the southern part of the shelf[78].
Effects on forage fish
Spatial distributions of forage fishes including herring, capelin, eulachon (Thaleichtys pacificus), and juvenile cod and pollock indicate temperature-related differences[79]. Annual capelin distributions exhibit an expanded range in years with a larger cold pool and contract in years of reduced sea-ice cover. Although the productivity of capelin stocks in relation to temperature is not known, population growth of this relatively cold-water dwelling fish is not expected under the conditions of a warm regime. As discussed, capelin biomass increased when the abundance of walleye pollock and Pacific herring were low in the western Bering Sea[80], possibly due to a reduction in predation pressure of these species on capelin larvae. The eastern Bering Sea herring stocks showed improved recruitment in warm years[81], similar to herring stocks on the Pacific coast of the United States where the timing of spawning is also temperature related[82]. In the western Bering Sea, Pacific herring have also demonstrated a dependence on reproductive success related to the thermal conditions of coastal waters. However, herring stock increase and large-scale fishery restoration are related to the “historically most abundant”[83] year class, which appeared in the anomalously cold year of 1993. Generally, strong herring year classes have appeared in the western Bering Sea in years with high sea surface temperatures in May but the lowest sea surface temperatures in June[84]. After 2000, herring biomass decreased in the western Bering Sea but still exceeds the average level for the last warm period (1977– 1989). In general, the distributions of all forage species from trawl surveys in a cold year (1986) were more widespread and with greater overlap among species than in a warm year (1987)[85].
Effects on pollock stocks
Pollock larvae concentrate in the water mass under the seasonal thermocline[86]. More productive year classes of pollock coincided with better nursery conditions for their larvae, which were related to a well-developed thermocline (pycnocline), large biomass of copepod nauplii, and low abundance of predators[87]. The first two factors are related to warm conditions in the Bering Sea epipelagic layer. Age-1 pollock may also be distributed throughout the cold pool and move between water masses. During cold conditions, predation pressure on age-1 pollock is intense by their major piscine predators (adult pollock, arrowtooth flounder, and Pacific cod). As the cold pool reduced, predation on age-1 pollock increased due to overlapping distributions of Greenland halibut, yellow Irish lords (Hemilepidotus jordani), and thorny sculpins (Icelus spiniger)[88]. The total biomass of the first group of predators was much higher in the 1980's than the second group[89] and has remained higher until the present, despite some declines in western Bering Sea walleye pollock and cod stocks. In addition, the second group of predators comprises relatively small-sized fish (except Greenland halibut) and age-1 pollock could avoid predation through higher growth rates during warm conditions. In the relatively warm 1980's, strong year classes of pollock occurred synchronously throughout the Bering Sea[90] and coincided with above-normal air and bottom temperatures and reduced sea-ice cover[91]. These favorable years of production were due to high juvenile survival and are related to how much cold water habitat is present[92], the distribution of juveniles relative to the adult population to avoid predation[93], and enhanced rates of embryonic development in warmer water[94]. Strong year classes of pollock were also observed in the eastern Bering Sea in the 1990's[95], which may be related to the higher frequency of ENSO events, which contributed to heat transport throughout the region[96]. However, there were no strong year classes of pollock in the western Bering Sea in the 1990's. This could be due to a general cooling of the Bering Sea climate and the oceanographic regime in a period of less intensive Pacific water inflow in the 1990's. The pelagic layer heat budget may need to be similar to that of the late 1970's and 1980's for the pollock reproduction conditions to improve in the Bering Sea as a whole.
Effects on other groundfish
Time series of recruitment and stock biomass have been examined for evidence that climate shifts induce responses in the production of groundfish species in the Bering Sea and North Pacific Ocean[97]. Even though results from these studies can be highly variable, strong autocorrelation in recruitment, associated with the significant change in climate in 1977, was observed for salmonids and some winter-spawning flatfish species. Substantial increases in the abundance of Pacific cod, skates, flatfish, and non-crab benthic invertebrates also occurred on the Bering Sea shelf in the 1980's as evidenced from trawl survey CPUE[98]. This warm period was characterized by larger research catches and a change in the benthic invertebrate species composition from a system largely dominated by crabs to a more diverse mix of starfish, ascidians, and sponges.
In the southwestern Bering Sea, transition from the relatively warm period of 1977 to 1989 to the subsequent cool period was also evident in the groundfish community. The proportion of Pacific cod decreased from 80% in 1985 to 12 to 26.3% in the 1990's, while sculpin (8.2% in 1985) and flatfish (9.3% in 1985) proportions increased by 15.1 to 31.5% and 24.2 to 39.6%, respectively[99]. Anthropogenic factors can also affect the state and dynamics of benthic communities. For example, large fishery removals of red king crab occurred in the 1970's and may have contributed to the reorganization of the benthos in the eastern Bering Sea. The climatic change related to recruitment success for winter-spawning flatfish may be associated with cross-shelf advection of larvae to favorable nursery areas, instead of with water temperature[100].
Sea-ice conditions and water temperatures can influence fishery effectiveness in addition to fish stock distributions and abundance. Coldwater effects have been observed in the behavior of flatfish species that may cause changes in the annual operation of the fishery. Because cold water causes slower metabolism in high latitude fish stocks, spawning migrations of yellowfin sole may be delayed in cooler years[101], which can alter the temporal and spatial characteristics of the fishery. In addition, high catch rates have been obtained by targeting yellowfin sole close to the retreating ice edge, which has a high temporal variability and in warm years only occurs in areas north of the spring distribution of yellowfin sole. The catch process can also be affected as it is believed that flatfish bury themselves in muddy substrate during cold years and so become less vulnerable to herding by the sweep lines of bottom trawls[102]. This would result in lower catch rates in cold years for shelf flatfish species. These temperature related behavior effects may also occur in other commercial species, particularly in pelagic fish, which react to avoid capture[103].
Effects on salmon
Throughout their century-long exploitation, Alaskan salmon stocks have had periods of high and low production which persist for many consecutive years before abruptly reversing to the opposite production state. These production regimes coincide with low frequency [[climate change]s] in the North Pacific Ocean and the subarctic Bering Sea (i.e., the Pacific Decadal Oscillation and the Aleutian Low Pressure Index). In the 1930's and early 1940's, and then again in the late 1970's, Bering Sea salmon catches reached high levels during warm temperature regimes in their oceanic habitat. It is hypothesized that improved feeding conditions may prevail during warm oceanic regimes[104].There is also evidence of an upper thermal tolerance for salmon species that has set limits on their distributions[105], but it is doubtful that this effect would occur in the Bering Sea because the historical temperature range there is much lower.
Effects on crab stocks
The three species of crab that inhabit the eastern Bering Sea shelf (red king crab, Tanner crab, and snow crab) exhibit highly periodic patterns of increased abundance. Rosenkranz et al.[106] investigated five hypotheses on factors affecting year class strength of Tanner crab in Bristol Bay in order to understand these patterns.They determined that anomalously cold bottom [[temperature]s] may adversely affect the Tanner crab reproductive cycle and that northeast winds may promote coastal upwelling, which advects larvae to regions of fine sediments favorable for survival upon settling. Incze et al.[107] linked low densities of copepods inside the 70m isobath of Bristol Bay with low abundance of Tanner crab larvae. An examination of recruitment patterns of red king crab in relation to decadal shifts in climate indicates that the Bristol Bay stocks are negatively correlated with the deepening of the Aleutian Low and warmer water temperatures[108]. Red king crabs were also moderately exploited during the late 1970's, which contributed to the population decline.
Possible impacts of climate change on fish stocks (13.5.4)
Given the present state of knowledge of complex marine [[ecosystem]s] such as in the Bering Sea, it is not possible to predict with any certainty the effects of future atmospheric forcing, in this case increased sea surface temperature, on commercial fish and invertebrate species. Evaluation of a future state of nature would require knowledge of the future values of many ocean–atmosphere parameters to describe how these changes would be manifested in upper trophic level commercial stocks. These parameters include storm activity and frequency, wind direction and intensity, shelf stratification characteristics, effects on circulation and transport activity, sea level pressure (location and intensity of the Aleutian Low pressure system), and precipitation as well as projections of sea surface temperature.
Three future climate scenarios are considered for the Bering Sea: no change from present conditions; moderate warming; and considerable warming.
No change
Under the no-change scenario the Bering Sea climate will continue to exhibit decadal-scale shifts alternating between warm and cool periods.These shifts in temperature regime have been shown to favor some species while their effect on others is unclear (Past climatic variations and their impact on commercial stocks above).
Under the present US and Russian management systems, it is expected that fish and invertebrate populations would be at or rebuilt to target spawning biomass levels as dictated by the management plans. This should result in an increase in total catches from the Bering Sea. Over the long term, however, a large total average increase is unlikely, but could nevertheless be considerable in individual cases.
Moderate warming
A moderate warming scenario can be developed by extrapolating trends characterizing the decadal-scale variability in the key physical factors influencing the Bering Sea ecosystem. On the basis of a moderate increase in air temperature (of 1 to 3 ºC) and a general warming of the upper pelagic zone, several changes are likely:
- an increase in the zonal type repetition of atmospheric circulation for the early 2000's and for the period of the next 11-year cycle of solar radiation;
- an increase in storm activity and wind-induced turbulence for the same period;
- gradual increase in water exchange with the Pacific Ocean, reaching a maximum in 2015 to 2020; and
- reduced sea ice, accelerated by an increase in air temperature, for the next 10 to 20 years after which time sea ice might increase again.
Variability in solar radiation correlates with many phenomena[109]. It is a potential forcing mechanism for decadal-period oscillations of the coupled air–ice–sea system in the northern-hemisphere[110]. Changes in solar fluxes correlate with change in the height of an atmospheric pressure surface in the troposphere of the northern-hemisphere (correlation coefficient = 0.72[111]). Spectral maxima occur roughly every 7–17 (with an average of 11) and 22 years. The North Pacific Index also has phases similar to those noted for changes in solar radiation[112]. Storm activity and wind-induced turbulence of the sea surface layer are determined by the tracks and strength of cyclones, which are in turn deter mined by the nature of the pressure field. In the Bering Sea, a strong Aleutian Low is the source of most of the storm energy, and results in intense mixing of the sea surface layer in winter. Strengthening of the Aleutian Low occurs in years of zonal air transfer predominance[113]. Such interrelations enable a prediction of high storm activity and wind-induced turbulence for all of the next 11-year cycle of solar activity.
Available information for the recent warm period in the Bering Sea suggests that primary productivity, and thus carrying capacity, would be enhanced under the warming scenario. However, because mixed-layer depth and water movements are not available for this scenario, the extent of this increase cannot be predicted owing to uncertainties concerning the renewal of the nutrient supply essential for sustaining the phytoplankton and zooplankton blooms. Also, as spring blooms are associated with the ice edge, a decrease in sea-ice extent associated with climate warming could delay the onset of primary production in spring[114]. High water-column stability, which occurs at the ice edge during ice retreat, also supports intense phytoplankton blooms.
Recent studies on phytoplankton sinking velocities show that diatom cells sink more quickly than flagellates, which are lighter[115].Thus, it is possible that iceless winters could create unfavorable conditions for diatom blooms. This implies that climate warming could result in decreased biological production in the Bering Sea until the start of the projected increase in sea-ice cover after 2010. The dynamics of the Bering Sea sea-ice conditions are characterized by several periods of cyclic recurrence, ranging from 2–3 to 50 years[116]. Obviously, this series is short for an exact tracking of the 50-year cycle. However, dramatic shifts in ice-cover anomalies were noted in the Bering and Chukchi Seas between 1976 and 1979, which divide the 1952–1994 data series into two distinct periods, which differ by 5.4% in average values[117]. Alternatively, a warmer period could increase thermal stratification such that the bloom, which is not ice-dependent, would start sooner. However, it could also be that the nutrient supply is quickly depleted during a short and intense bloom and that photosynthesis is slowed. In addition to upwelling and nutrient recycling in the pelagic layer, Pacific water inflow is also a source of nitrogen and phosphorus. Intensification of water exchange with the Pacific Ocean under climate warming is thus likely to result in increased primary production in the Bering Sea[118]. Increased levels of primary production are usually associated with improved survival for juveniles of most fish species[119] and subsequent contribution to the adult spawning stock.
Predictions of the relationship between climate change and commercial species distribution, abundance, and harvest patterns are based on the assumption that future management policies will be the same as at present. Namely, that target fishing mortality values will be designed to maintain the female spawning stock at a minimum of 40 to 60% of the unfished level (depending on species). Also, that when stocks are assessed to be below this level, harvest is reduced proportionally to rebuild the spawning stock to the target level. This approach is likely to result in fisheries for species which respond favorably to warmer conditions realizing greater catches and possibly shifting to areas of increased abundance or expanded habitat, while fisheries for species which are negatively affected by a warmer climate are likely to have smaller quotas, reduced areas of operation, and even vastly different areas.
Literature documenting changes in the Bering Sea ecosystem under the previous warm period suggests that increases in the abundance of many groundfish species are very likely under future warming. Pollock, Pacific cod, Pacific halibut[120], skates, some flatfish species, salmon, eastern Bering Sea herring, and Tanner crab are all likely to benefit under warmer conditions (Table 13.2), although the mechanisms underlying the increase are not clear in most cases. Strickland and Sibley[121] proposed a possible northward expansion of pollock feeding and spawning habitat under a warming scenario due to reduced sea-ice cover, water column stratification, and increased food supply.
|
Table 1. Changes to stocks in the western Bering Sea and projected stock dynamics in response to a moderate warming (+ positive effect evident, - negative effect evident, 0 no effect evident or unclear effect). (Source: ACIA) | |||||||
|
Group |
Increase in water temperature in upper pelagic layer |
Increase in wind stress, zonal transport oscillation |
Increase in water exchange with Pacific Ocean |
Mild sea-Ice conditions |
Prevalent biological effects related to the physical environment changes |
Overall trend in stock abundance |
Key |
| Adult pollock |
+ |
0 |
+ |
+ |
+ (food supply) |
+ |
Shuntov et al.[122] |
| Juvenile pollock |
+ |
- |
+ |
+ |
- (predation) |
- |
Nishiyama et al.[123] |
| Pacific cod |
+ |
0 |
+ |
0 |
+ (food supply) |
+ |
Bakkala[124] |
| Pacific herring, WBS |
- |
0 |
- |
+ |
- (competition) |
- |
Naumenko[125] |
| Pacific herring, EBS |
+ |
0 |
- |
+ |
- (competiton) |
+ |
Wespestad[126] |
| Pacific salmon |
+ |
- |
+ |
0 |
+ (food supply) |
+ |
Hollowed et al.[127] |
| Cephalopods |
- |
0 |
+ |
0 |
- (predation) |
- |
Sinclair et al.[128] |
| Capelin |
- |
- |
- |
- |
- (predation) |
- |
Wespestad[129] |
| Arctic cod |
|
|
|
|
|
|
Wylie-Echeverria and Ohtani[130] |
| Pacific halibut |
|
|
|
|
|
|
Clark et al.[131] |
| Greenland halibut |
|
|
|
|
|
|
Livingston et al.[132] |
| Arrowtooth flounder |
|
|
|
|
|
|
Wilderbuer et al.[133] |
| Small flatfish |
|
|
|
|
|
|
Wilderbuer et al.[134] |
| Skates |
|
|
|
|
|
|
Borets[135] |
| Sculpins |
|
|
|
|
|
|
Borets[136] |
| Atka mackerel |
|
|
|
|
|
|
Shuntov et al.[137] |
| Mesopelagic fish |
|
|
|
|
|
|
Radchenko[138] |
| Tanner crab |
|
|
|
|
|
|
Rosenkranz et al.[[[139]]] |
| King crab |
|
|
|
|
|
|
Haflinger and McRoy[140] |
| Shrimp |
|
|
|
|
|
|
Ivanov[141] |
| Benthic epifauna |
|
|
|
|
|
|
Conners et al.[142] |
| Benthic infauna |
|
|
|
|
|
|
Livingston et al.[143] |
| Jellyfish |
|
|
|
|
|
|
Brodeur et al.[144] |
| Euphausiids |
|
|
|
|
|
|
Shuntov[145] |
| Copepods |
|
|
|
|
|
|
Shuntov[146] |
| Phytoplankton |
|
|
|
|
|
|
Shuntov[147] |
There are very likely to be many changes in the Bering Sea ecosystem following a change to warmer conditions from those at present. Centers of capelin distribution are likely to move northward to colder waters and forego the large areas of spawning habitat that would be available in colder years. Polar cod and five species of marine mammals that are associated with the ice edge (harbour seal, Steller sea lion, sea otter, beluga whale, and Dall’s porpoise) are likely to be restricted to the Chukchi Sea for large parts of the year. Red king crab, which decreased in abundance during the past warming period, is unlikely to do well under future warming. Deep-water species such as Greenland halibut are unlikely to be affected during their larval and juvenile stages, except when they are present in shallow water. Greenland halibut recruitment is likely to be enhanced in colder years, perhaps due to a decrease in overlap with adult pollock[148]. Similarly, predation by large piscivorous fish is likely to affect the pandalid shrimp stocks; these shrimp species are among the preferred prey of Pacific cod during summer feeding in the northern Bering Sea, especially for new recruits[149]. Predation on shrimp stocks is likely to increase with increased recruitment of Pacific cod. Annual consumption of gonatid squid species was estimated at 4.2 million t in the Bering Sea for the late 1980s[150]. A growth in squid stocks is unlikely under a warming regime due to predicted increases in the abundance of their main predators (except for Greenland halibut). Increased abundance of sculpins and western Bering Sea herring in the 1990s was attributed to the weakening of interspecific competition in the pelagic and benthic fish communities by Naumenko et al.[151].These stocks are likely to experience future decreases due to increases in pollock stock size.
Although some flatfish species on the Bering Sea shelf have shown increased productivity under warmer conditions, their distributions are unlikely to shift in response to ocean temperature. These species migrate to deeper, warmer waters in winter (where some spawn) and then migrate to the mid-shelf area in spring and early summer where they feed on the benthic infauna. Site fidelity is important for feeding purposes and these species are likely to tolerate moderate thermal changes. Habitat specialists, which have successfully developed niche preferences, are much less likely to be affected by climate change than “colonizing” species which have a more diverse diet so might be inclined to shift with the changing conditions. Such characteristics are expected to influence the extent to which fisheries would change under a warmer climate. However, the total fishery catch occurring under a climate change scenario would only increase to the extent allowable under current management practices. This also corresponds to historical data for the western Bering Sea fishery (Fig. 13.35). Attempts to forecast this increase, as described in the rest of this section, are based on the previously achieved maximum fishery harvest and assume that current management philosophies continue.
The maximum pollock catch in the Bering Sea was 4.07 million t in 1988, and averaged 3.55 million t between 1986 and 1990[152]. The total walleye pollock biomass in the Bering Sea over that period was about 20 million t[153]. Conventional wisdom assumes that the 1990s stock reduction was due to a decrease in productivity in response to environmental conditions rather than to overfishing. This means that the pollock harvest in the favorable period of the late 1980s can be used as the reference point for predicting future catch for the projected warm period. As a rule, an increase in the pollock fishery stock is due to several average and strong year classes, as in the latter 1960s, or one super-strong year class. A super-strong generation appeared in the Bering Sea in 1978 and ensured a stabilization of stock abundance and the development of the large-scale pollock fishery at the end of the 1980s[154]. The eastern Bering Sea population of pollock almost doubled between 1995 and 2001 and supports an annual catch of more than 1 million t with strict regulations. The stable condition of this population provides for the likely increase in future abundance associated with a moderate climatic warming. However, the 1978 year class occurred 13 years after the first strong year class in 1965[155] and no cohorts of this strength have been observed since. Thus, a swift increase in stock size and catch of pollock in the near future is unlikely.
The annual Pacific cod harvest ranged from 33100 to 117650 t and averaged 65 210 t in the western Bering Sea during the period of Dutch seine trawls and, to a lesser degree, longline fisheries between 1981 and 2001. The catch for the whole Bering Sea for that period totaled 207,110t. This is a relatively low catch compared to an estimated cod biomass of 3.27 million t. Adult Pacific cod are the main predator for some commercially important fish (e.g., pollock and herring) and crustaceans, particularly Tanner crab and shrimp. Relative to their weight, one unit of Pacific cod biomass consumes about 1.11 biomass units of Tanner crab juveniles, 1.12 of shrimp, 0.8 of walleye pollock, 0.39 of squid, and 0.31 of herring on the western Kamchatka shelf during the six months of the warm season[156]. Whether an assumed increase in fishing pressure is justifiable for the purpose of decreasing predation by Pacific cod on other species in the ecosystem is under investigation. If the Pacific cod stock attains the same abundance in the Bering Sea as in the mid-1980s, it is likely that the total harvest could be increased (in both the western and eastern Bering Sea) to the level experienced in the 1980s and 1990s, i.e., around 350,000t.
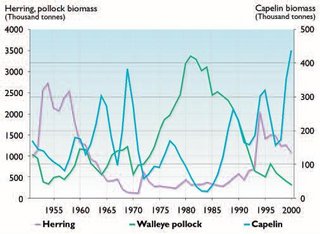 Fig. 13.38. Long-term changes in pelagic fish biomass in the western Bering Sea, 1951–2000[5]. (Source: ACIA)
 Between 1981 and 1991, herring fisheries in the southeastern Bering Sea, in the vicinity of the Alaskan coast, harvested around 30,000t, while harvests in the southwestern part of the Bering Sea (Fig. 13.38) were around 17,000t over this period, relative to a total biomass level of nearly 500,000t.The same level of harvest is likely for the next warm period. The western Bering Sea “fat herring” fishery is very likely to decline during the next decade, but the Alaskan roe-sac herring fishery is likely to increase.
The Pacific salmon fishery recently surpassed its top harvest level in the northeastern Kamchatka area due to the record pink salmon catches in 1997 (82,300t) and 1999 (83,600t). However, some decline is likely to occur there since the local stocks of other Pacific salmon species are not as abundant. The chum salmon coastal catch did not exceed 12,200t, while the sockeye salmon catch did not exceed 7,000t for these years. However, these relatively high catches were made in the latter half of the 1990s. On the basis of the 5-years rate of increase in the 1990s, the total chum and sockeye salmon harvest could reach a surplus of 20 and 12%, respectively, by the end of the 2020s. Eastern Bering Sea salmon production is dominated by sockeye salmon which contributed 41 million fish from a total catch of 42 million Pacific salmon in Bristol Bay in 1993. This was a historical record and followed the previous record of 37 million fish (101,550t) in 1983[157]. The Bristol Bay sockeye stock has since declined and is presently in a period of low production. Stock dynamics observed over the 1960s to 1990s[[[158]]] suggest that periods of low productivity can last for 15 to 20 years and with an average annual sockeye catch of about 20,000t. However, if moderate climatic warming is favorable for Pacific salmon growth and survival during the marine part of its life cycle, it is likely that the annual catch will approach that of the previous warm period (1977 to 1993), i.e., about 110,000t. The proportion of sockeye salmon is very likely to increase from the mid-2000s to the 2020s from 25 to 30%, to 50 to 55% of the total and the proportion of pink salmon will decrease accordingly. Chum salmon are very likely to take third place, chinook salmon fourth, and coho salmon fifth.
Although flatfish biomass will possibly increase in future warm periods, the catch is likely to remain low due to bycatch and market constraints. The Atka mackerel (Pleurogrammus monoptergius) of the Aleutian Islands, skates, smelt, and saffron cod (Eleginus gracilis) of the southeastern shelf are other potential stocks in good condition. Development of new markets for these fishery products could increase future harvests. Comments concerning a future crab fishery in the Bering Sea cannot be made as it is not well understood which environmental conditions would enable better survival and growth of crab larvae and juvenile stages. Also, the reasons for the sharp crab stock decrease in the Bering Sea in the 1980s are not known and there is debate as to whether the decline was due to overfishing or environmental change. Polar cod, capelin, sculpin, mesopelagic fish, shrimp, and squid fisheries are presently undeveloped in the Bering Sea, and no precondition exists to develop these fisheries under a warmer climate regime. Some bycatch of commander squid (Berryteuthis magister magister) and sculpins in the trawl fishery for pollock in the Dutch seine fishery on groundfish is used, but the total value of this harvest is insignificant.
Considerable warming
Since a warming of >4 ºC has not previously been observed, it is not possible to comment on changes which might occur in the marine ecosystem based on past cause and effects. It is likely that the distributions of many species would shift poleward and that there would be significant changes in the arctic ecosystem. Ice-associated species would encounter a shrinking habitat and there would be greater potential for stock collapse for species forced to forego past areas of desirable spawning and nursery habitats due to thermal intolerance. The species succession likely under a scenario of considerable warming is not known, but a sudden reduction in the economic potential of Bering Sea fisheries is possible.
The economic and social importance of fisheries (13.5.5)
In comparison to other areas of the Arctic, the commercial fisheries of the North Pacific, including the Sea of Okhostk, and the Bering Sea, are relative newcomers. Near-shore artesanal fisheries by indigenous peoples have occurred for centuries in the Bering Sea[159] (see Chapters 3 (Fisheries and aquaculture in the North Pacific (Bering Sea)) and 12 (Fisheries and aquaculture in the North Pacific (Bering Sea))). The first documented commercial exploitation of groundfish dates back to 1864, when a single schooner fished for Pacific cod in the Bering Sea[160], although salmon were part of commerce during earlier times. In 1882, American sailing schooners began a regular handline cod fishery. As recorded in Russian literature, the California-based fishers ceased to sail to fish in the Sea of Okhotsk after the cod shoals near the Shumagin Islands in the Gulf of Alaska were discovered. In the western Bering Sea, the early Russian fisheries were poorly developed and limited to near shore subsistence fishing by indigenous peoples and settlers[161]. However, even at this early date the Bering Sea was known to contain a rich resource of fish. The herring fishery area expanded northward to the Bering Strait and operated during two weeks in May when herring migrated near the coasts. The Pacific salmon fishery yielded 12 million fish each year of which 2 to 4 million fish were from the Yukon Delta area, while the remainder were caught by Russian development companies and Japanese corporations operating concessions on Russian [[river]s][162].
In contrast to the slow development of the early fisheries, the hunting of marine mammals developed rapidly. In the western Bering Sea, the fur seal harvest ranged from 20,000 to 50,000 animals on the Commander Islands. A Russian–American Company was mainly responsible for the hunting and fur purchase operations in the eastern Bering Sea, Gulf of Alaska, and Aleutian Archipelago regions between 1786 and 1862. The sea otter harvest totaled 201,403 animals during the time of the Russian–American Company of which nearly a third was purchased by merchants from the indigenous peoples. Other marine mammal harvests included sea lion hunting on St. George Island (on the Pribilof Archipelago), which yielded 2,000 animals per year, and walrus hunting, which yielded 300 to 2,000 animals per year until the harvest was reduced in the 1830s due to a declining population. Owing to overexploitation, the fur seal breeding grounds disappeared from the Pribilof Islands, Unalashka Island, and adjacent areas in 1830 to 1840. From 1743 to 1823, 2,324,364 fur seals, 200,839 sea otters, about 44.2t of walrus tusk, and 47.8t of baleen were harvested from the Aleutian Arc, other islands, and the Alaskan coast. The first protective measures on fur seal populations from Japanese and American illegal sealers were set by Russia in 1893. There is an illustration of this in the Rudyard Kipling ballad The Rhyme of the Three Sealers:
Now this is the Law of the Muscovite, that he proves with shot and steel
When ye come by his isles in the Smoky Sea ye must not take the seal.
In 1911, a three-sided treaty was concluded between Russia, the United States, and Japan, which established a sealing prohibition on the high seas in exchange for compensation paid from harvests in the rookeries[163].
Large-scale commercial exploitation of the Bering Sea fish stocks developed slowly. Between 1915 and 1920, as many as 24 US vessels fished Pacific cod. Annual harvests ranged from 12,000 to 14,000 t[164]. Small and infrequent halibut landings were made by US and Canadian fishers between 1928 and 1950, which increased sharply and exceeded 3,300t between 1958 and 1962[165]. In the early 1970s, the halibut catch fell to a low of 130t before recovering to a high in 1987, and then slowly declined. The International Pacific Halibut Commission, established by Canada and the United States in 1923 to manage the halibut resource, determined that factors such as over-exploitation by the setline fishery, juvenile halibut bycatch, and adverse environmental conditions led to the decline in abundance[166]. In the western Bering Sea, the exploitation of groundfish resources was mainly by small-scale coastal operations. Information on groundfish abundance was lacking until the first Soviet Pacific Integrated Expedition in 1932 to 1933. This covered the entire Bering Sea and found the eastern shelf and continental slope to be more productive fishing grounds than the narrower western ones. As a result, Soviet fisheries concentrated their efforts in the eastern Bering Sea after 1959. By the mid-1960s, newly organized Soviet fishing on the eastern Bering Sea shelf and in the Gulf of Alaska yielded about 600,000t of Pacific ocean perch, yellowfin sole, herring, cod, crabs, and shrimps[167].
The Japanese and Russian fleets expanded rapidly between 1959 and 1965, with vessels from the Republic of Korea and other nations also participating in later years. These fishery efforts were added to the solely Japanese fishery efforts, which have actively operated in the Bering Sea since the 1930s, especially after the Second World War. By 1960, 169 vessels from Japan were present on the Bering Sea fishing grounds along with 50 to 200 vessels from the Soviet Union[168]. Significant growth in fishing effort led to overfishing of several stocks.The Soviet walleye pollock fishery began in the early 1970s after the decline of some commercially valuable fish stocks. Before that, walleye pollock was not regarded in the Soviet fishery as a target species. The Japanese mothership operations had three to five conventional catcher/trawlers and as many as eight pairs of trawlers associated with each mothership[169]. The catch was processed at sea with the frozen products transported ashore for food. Japanese catches were mostly processed aboard motherships into fishmeal, with livers extracted for vitamin oil. Female walleye pollock in spawning condition soon became an important source of roe-bearing fish, which were processed into valuable products such as different kinds of fish roe and surimi. The increase in product value, combined with an increase in pollock abundance after the latter half of the 1960s led to the gradual increase in catch: up to 550,000t in 1967 and 1,307,000 t in 1970[170]. Groundfish catches were mainly by vessels from Japan and the Soviet Union until 1986, when US fishing vessels participating in joint ventures with foreign processing vessels took a larger proportion of the catch. By 1990, the distant water fleets were phased out of the eastern Bering Sea (the US EEZ) and US fishing vessels became the sole participants in the fishery. Some fishing occurs under license from the Russian Federation in its EEZ.
Fisheries
United States fisheries off Alaska constitute more than half of landings and about half the value of national landings of fish and shellfish from federal waters[171]. Depending on species, approximately 90% of the landings in Alaska are from the Bering Sea/Aleutian Islands area. All the groundfish, crab, and salmon in the US EEZ of the Bering Sea are caught by domestic fishing bodies[172]. In the Russian EEZ the majority of the harvests are taken by domestic fleets with a decreasing amount harvested under agreements with neighboring states. In 1997 it is estimated that the Russian Far East fisheries accounted for 70% of the Russian Federation total fisheries production[173], however this proportion may be decreasing due to the declines in pollock, crab, herring, and other species not being offset by the increases in Pacific salmon.
|
Tazble 2. Trends in abundance and value of major Alaskan fisheries (inflation-adjusted US dollars) (Alaska Department of Fish and Game, as cited by Pacific Fishing, January 2002). (Source: ACIA) | |||||
|
Species |
Stock 1997 |
Value 1977 |
Stock 2001 |
Value 2001 |
Discussion |
|
Salmon |
200 million fish |
US$ 500 million with peak value in 1988 of US$ 1.18 billion |
175 million fish |
US$ 205 million |
A small decrease in total catch but a large decrease in price due to competiton with farmed fish |
|
Groundfish |
Very small US harvest |
US$ 2-3 million but rapidly increasing to US$ 1.0 billion in 1988 as a result of Americanization |
1.65 million t harvested |
US$ 400 million |
Whitefish markets strong yet price weak but US dollar also weak |
|
Shellfish (primarily crab species but some shrimp in early years) |
Red king crab strong, other species small harvests |
US$ 440 million. Drops when red king crab bubble bursts but Opilio crab takes over |
Most species at low levels |
US$ 125 million |
Strong competitoon in Opilio fishery from Eastern Canada but weak competition from Russia |
|
Pacific halibut |
Low catch most likely due to foreign fleet bycatch |
Less than US$ 30 million |
High abundance |
US$ 150 million |
Strong stocks and good price vis a vis other white fish |
|
Herring |
Low abundance |
Less than US$ 30 million although value increased in mid-1980's/mid-1990's to US$ >50 million |
Low abundance |
Less than US$ 30 million |
Herring in same situation in 1977 and 2001 |
In the Bering Sea, walleye pollock is the major harvest by volume and value, with Pacific cod, flatfish, salmon, and crabs constituting most of the rest (Table 2). The total wholesale (raw fish landings) value for groundfish harvests in the eastern Bering Sea was approximately US$ 426 million in 2001. The total primary processed value was approximately US$ 1.4 billion. Crab harvests, mainly from the Bering Sea/Aleutian Islands area, amounted to US$ 124 million even at the low population abundances noted earlier[174]. Pacific salmon, a large amount of which comes from the Bristol Bay and Yukon River areas, had a Bering Sea catch value of between US$ 122 million (2001) and US$ 179 million (2000)[175].The Community Development Quota (CDQ) Program, which allocates 10% of the total Bering Sea TAC to 65 coastal communities organized into six CDQ corporations, earns more than US$ 40 million annually[176]. A separate value is not assigned in this study to recreation or subsistence harvests in the Bering Sea due to lack of adequate analyses, despite their local and cultural significance. Economic value data for the Russian Far East are difficult to locate[177]. Press reports for product value estimate the total 2001 production to account for US$ 3.0 billion[178]. Since the transition to a market economy began in the early 1990s and the Soviet style management of fisheries has changed, it appears that there are significant tracking and reporting difficulties with less fish being landed to avoid taxation and fees. Instead, harvests may be transferred at sea or transported directly to foreign markets by fishing vessels[179].Thus, production and value data must be treated with caution until a more robust accounting system is developed.
Fishing fleet and fishers
Almost every fishing vessel in the Bering Sea fleet is registered outside the region. Vessels must be of requisite size to weather the environmental conditions and to have adequate scale efficiencies to operate in the area. These factors plus the lack of deepwater moorings and other support services make the eastern North Pacific a largely “distant water” fishery. Overall, the number of vessels eligible to fish for the increasing stocks of groundfish in the federal waters of the Bering Sea has decreased since the mid-1990s from 464 vessels in 1995 to 398 in 2001. This is the case for all groundfish vessel classes and types. In 2001, there were 163 hook and line (longline) vessels, 81 pot vessels, and 162 trawl vessels fishing, of which around 20 were at-sea capture/processors for pollock. The overall decrease in number results from rationalization programs for pollock under the American Fisheries Act 1998 and the North Pacific Fishery Management Council’s license limitation program for all species (although this figure does not include halibut/sablefish vessels which have Individual Fishing Quota qualification)[180]. For other sectors, there were around 274 eligible Bering Sea/Aleutian Islands crab fishing vessels, 2500 catcher longliners (including Alaska state-water vessels) mostly involved in halibut/sablefish and Pacific cod fisheries, and some 5200 salmon fishing vessels of various types[181].
Employment in the groundfish harvesting sector (at-sea catching and processing on land as well as motherships) in 2001 amounted to 4000 full-time equivalent jobs including skippers, fishing crew, processing crew, and home office staff[182]. With few exceptions, most of this employment is in relatively small corporations. North Pacific Fishery Management Council license limitation regulations limit the size and ability to grow of existing catching bodies. Thus, few large integrated harvesting and processing companies exist. Still, even the smaller organizations deal in multi-million dollar investments with substantial annual operating expenses, e.g., a typical catcher vessel of about 35 to 40 m in length would require a family owner or small business to have a fair market value of US$ 2.5 million to 3.5 million[183]. In the western Bering Sea, the situation is similar to that in the Alaskan EEZ. A large part of the harvesting capacity is located in the southern parts of the area, as are the financial and supply and repair services.
The number of fishing vessels has declined drastically since the end of the Soviet era distant water fishing, owing to other nations extending their EEZs and to efforts to renew the fishing fleet and to reorganize it on market economy terms[184]. Between 1990 and 1999 the Russian fishing fleet decreased by nearly 44% in number. Most of the fleet was privatized in the form of joint stock companies (56.7%), or transferred to cooperatives (kolkhozes; 23.7%), private companies (12.5%), or joint Russian–foreign ventures (2.4%)[185]. In the Russian Far East, this has enabled small and mid-scale fisheries to develop while some large entities under Soviet style fisheries have changed and remained dominant forces. Likewise, total employment in the fisheries sector fell from 550,000 in 1990 to 398,000 in 1998. Contributing to the decline in employment in the Russian Far East was an exodus of people assigned to duties there returning to families and friends in their home regions.
The land side of the fishing industry
Approximately 70% of the Bering Sea harvests are processed on shore in a relatively small number (8) of groundfish processing plants near Dutch Harbor/Onalaska[186]. Recent efforts have been made to locate processing facilities on Adak Island in the western Aleutians. Crabs are processed on the Pribilof Islands during periods of high abundance of red kfng crabs and snow crab in the Bering Sea. Salmon tendering and processing is focused around Bristol Bay although not exclusively. Sites where processing occurs require significant infrastructure for processing as well as for providing services to the fishing fleet. Given the remote nature of the Bering Sea fish processing activities, the communities in which these occur are highly dependent on the fishing industry for economic activity, with government services and tourism distant rivals. Most of the groundfish processing occurs adjacent to the densest aggregations of groundfish and where catcher vessels with refrigerated sea-water holds can make relatively rapid trips to maintain product quality. However, for some species and products (e.g., high grade surimi) it is difficult for shoreside processors to compete.
Employment in Alaskan shoreside processing for groundfish is estimated at 3,525 full-time equivalents[187].The number of processing jobs onshore in the Bering Sea has increased by as much as 50% between the early 1990s and the present because of policies decreasing the amount allocated to at-sea processing versus onshore processing. Much of the work force is an ethnically diverse group of work permit holders from other parts of the world, mostly west coast United States, Mexico, and the Philippines. Over time, Alaskan communities in the Bering Sea region are being transformed as workers stay on and climb the corporate ladder.
In the Russian Far East a significant proportion of the catches have been processed at sea with the rest processed on shore or kept in cold storage, etc. With domestic demand low in terms of the ability to compete with global market price and other tax and regulatory issues onshore, there is a substantial incentive to process offshore and export directly[188]. This has contributed to a sizeable decrease in domestic consumption and employment in shoreside processing and other services to the fishing industry. The transition to a market economy has been difficult but the learning curve is trending upward with new management institutions and experience. However, without the full cooperation of the fishing industry and management, and tensions over the allocation of revenue between the Far East and Moscow, it will be some time before the industry stabilizes.
Fisheries communities
The North Pacific fishing communities surrounding the Bering Sea are different to those of the North Atlantic. There is no history of small coastal fishing communities developing commercial fishing on the currently harvested large stocks of pollock, Pacific cod, etc. In the eastern Bering Sea some 65 communities exist with a total population of around 27,500.They are frequently inhabited by a large percentage of indigenous Alaskans, but not exclusively[189]. Until they became participants in the CDQ program, they had limited coastal subsistence fisheries as well as some small-scale commercial fisheries for salmon and halibut. Involvement in the groundfish and crab fisheries has provided valuable income and employment as well as a role in management of the offshore fisheries.The main location of the fish processing on Akutan and Dutch Harbor/Onalaska had been important for crab, halibut, and some salmon fisheries. It was not until foreign and domestic investment was encouraged in shoreside processing of groundfish in the late 1980s that these communities were transformed. Loss of access to fishing in the US EEZ prompted Japanese investment in processing so that raw fish could be purchased at low prices and benefits gained in value-added processing from shore-based plants.
The history of the purchase of Alaska from Russia in 1867 and its status as a territory until Statehood in 1959 was that of a domestic colony. In particular, fishing interests in western Washington and Oregon were some of the prime early investors in Alaskan fisheries. Ownership of the highly seasonal Alaskan canneries was mostly outside Alaska. Salmon fishing brought labor from the south. Halibut fisheries were developed as soon as icemaking and refrigeration technologies permitted catching and transport of fish to southern markets. Early crab fishing interests were based out of Seattle. Thus, the fisheries of Alaska have strong personal, financial, and service connections to Seattle due to the laws of comparative advantage. Alaska is a high cost area for living and carrying out a business[190]. In the federal water fisheries, residents of other states must not be discriminated against in management regulations, which further enforces the long, mostly cooperative, relationship between fishing interests in Washington and Oregon and those in Alaska. Overall dependence on fisheries varies by community but in Alaska as a whole, fisheries is a distant second to oil production in terms of revenue from resource extraction and for some cities with onshore processing, fisheries are the prime source of local landing tax revenue.
Similar to Alaska, small indigenous Russian settlements existed around the western Bering Sea. With the colonization by Russians, larger towns developed and during the Soviet era these grew as bases for resource development and national defense. Population in the seven administrative regions of the Far East is concentrated in coastal cities and declined slowly throughout the 1990s[191]. Several large cities account for the majority of the population such that much of the Russian coastline is undeveloped. Fisheries are dominated by fishing interests in Vladivostok and Nakhodka. Increasingly stronger demands are being made by other regional fishing bases for more autonomy in management and greater allocations to proximate users.
Markets
The relatively low populations of the Bering Sea region do not constitute a very large local market for the large-scale fisheries. Thus, both Alaska and the Russian Far East look to distant markets at home and abroad. For Alaska, the prime markets are Japan, Korea, and China with Europe providing entry for some products. Over 90% of Alaskan fish is exported. Korea and now China with their relatively low wage labor have served as processing centers for some products that are reexported, i.e., imported back in some value-added form. For the Russian Far East, exports have started to play an increasing role in the fisheries economy. During the Soviet era up to 80% of the Far Eastern fish products were processed and sent on to domestic markets in the western more populous parts of the country. The rest was exported or taken under fisheries agreements with neighboring states to obtain hard currencies needed by the central government. While low effective demand (i.e., domestic consumers) is not able to pay international prices for seafood products, many of the higher value species are exported and low value species and products are imported so that around 50% of the seafood harvested is destined for export[192].Thus, the remote Bering Sea is a major player in terms of global seafood markets where declines in abundance of Atlantic cod, for example, open markets for fillets of pollock at the same time demand for pollock surimi products seems to be slackening as a result of weak Japanese and Korean markets. Similarly, high abundance of snow crab in Canada causes market erosion for this species in the eastern Bering Sea.
Owing to the significant price competition from farmed Atlantic salmon, the wild salmon dependent fishing enterprises and communities are facing major adjustments. Even though North Pacific wild salmon stocks are abundant at present, the large quantity of farm raised salmon and its method of sale and delivery reduce the price that can be obtained. There is some consideration in Alaska and Russia about starting aquaculture but it is recognized that the investment, organization, and technology may be significant hurdles[193]. Given the experience with salmon, there is also concern over the farming of halibut, sablefish, and cod becoming competitive with wild stock harvests.
Management regime
The US and Russian EEZs are the major management jurisdictions in the Bering Sea although the multilateral conventions for management of the “Donut Hole” fishery outside these boundaries also has an important role in fisheries management. Similarly, the Convention for a North Pacific Marine Science Organization and the Convention for the Conservation of Anadromous Stocks in the North Pacific Ocean provide frameworks for scientific exchange and cooperation. Even though the major activities covered by these conventions occur to the south of the ACIA boundary, the Wellington Convention for the Prohibition of Fishing with Large Driftnets constrains fisheries on the high seas with potential to intercept salmon of Russian and US origin as well to have negative bycatch effects on Dall’s porpoise and some seabird species. Bilateral agreements, such as between Canada and the United States for salmon and halibut management and between Russia and Japan for salmon, also exist.
At the national level, the Magnuson-Stevens Fishery Conservation and Management Act is the prime legislation guiding fisheries management in federal waters. In Alaska, this means that all waters between 3nm from the state’s baselines and 200nm is under federal jurisdiction. Other relationships exist, such as federal management for halibut in all waters due to the Convention between Canada and the United States for the Preservation of the Halibut Fishery of the Northern Pacific Ocean and Bering Sea, and Alaskan state jurisdiction (with federal oversight) over crabs as creatures of the continental shelf and salmon that are harvested within state waters[194].The waters off Alaska constitute one of the nation’s eight fishery management regions. This is administered by the regional office of the National Marine Fisheries Service, with management decision-making taking place in the North Pacific Fishery Management Council – an advisory body to the regional director and thereby to the Secretary of Commerce. The federal regulations aim to develop a decision process that is comprehensive, transparent, and open to participation by all interested parties[195].
The main tools for fishery management are Fishery Management Plans that set out the rules and regulations for management of each species or species complexes. Under the current management approach,TAC is set on an annual basis in the Stock Assessment Fishery Evaluation process[196]. As part of this process, ecosystem considerations are made explicit in the form of a chapter of the Stock Assessment Fishery Evaluation document that addresses ecosystem trends and relationships to fishing, as well as in the environmental assessments required in accordance with the National Environmental Policy Act. All meetings of the Council and its Advisory Committee and Scientific and Statistical Committee are open to the public. Thus, any interested party can observe and participate in deliberations of Plan Development Teams setting TACs.
The North Pacific Fishery Management Council has developed innovative approaches to management. Scientific advice is rigorously adhered to in the setting of TACs and conservative harvest limits are applied. A cap of two million tonnes has been set on total removals in the fishery even when allowable catches might be considerably higher. Bycatch is counted against TAC and target fisheries can be closed if the bycatch limit is reached before the target fishery TAC. Larger boats are required to carry and pay for one or more observers to gather scientific information about harvests. Species such as halibut, salmon, and herring are considered prohibited species in the groundfish and other non-target species fisheries. Finally, significant areas of the fishing grounds are closed to trawling to protect habitat necessary for other species, e.g., red king crab savings area[197]. In addition, much of the present work of the North Pacific Fishery Management Council is on developing spatially explicit relationships between fisheries and fish [[habitat]s] under the Essential Fish Habitat Provisions of the Magnuson-Stevens Fishery Conservation and Management Act[198].There is also a Council emphasis on rationalization of fisheries through share-based management systems such as the Individual Fishing Quota program for halibut and sablefish (and as proposed for Bering Sea and Aleutian Islands crabs) or through using a cooperative approach as for pollock under the American Fisheries Act, 1999.
In the EEZ of the Russian Far East, the issues and basic management system are similar to those in the Northeast Atlantic (see Section 13.2.5 (Fisheries and aquaculture in the North Pacific (Bering Sea))) with the exception of the reciprocal fishing agreements. The regional administration is subject to central control for setting allocations and for Border Guard enforcement. From comments about the implementation of enforcement in western Russia, it seems the US Coast Guard and the Border Guards have developed a more effective cooperation on enforcement in the Bering Sea, particularly with respect to the fishing zone boundary and high seas driftnet fishing. The scientific basis for setting allocations in Russia is similar to that of Alaska. Significant concerns have been expressed about how well such allocations are being followed and enforced[199]. Similarly, the role of the central as opposed to the regional fishery administrations in the setting and allocation of quotas is being challenged. For several years, significant proportions of the total allowable harvest are being auctioned to the highest bidders.This innovative effort has been controversial.
Variations in Bering Sea fisheries and socio-economic impacts: possible scenarios (13.5.6)
The major changes in the commercial fisheries of the Bering Sea have been in the distribution of the harvests among nations and sub-nation user groups. Changes in the species composition of the catch due to changes in environmental conditions and fishing pressures have also affected those employed in the fishing industry and their communities. However, while the latter are of considerable interest in the present assessment, it is important to note that the adjustments to changing claims to jurisdiction in the Bering Sea have been extensive[200]. The enormous dislocation of fishing fleets from Japan and then the Soviet Union post-EEZ extension, shows that major adjustments can be made but with considerable hardship. Similarly, the response of the US fishing industry assisted by favorable government incentives shows how quickly it can respond to opportunity. The question thus is how fully occupied fisheries can respond to sustainable and precautionary management.
Fisheries in the Bering Sea are largely a post World War IISecond World War phenomenon in terms of the technology and scale of enterprise necessary to fish the inhospitable and enormous expanses of the remote Bering Sea shelf. With the developments in mothership operations and food processing technology came the development of new markets for species such as walleye pollock that despite being available in large quantities had not previously been considered a target species. Little is known about the fisheries ecosystem of the Bering Sea prior to the development of the intensive industrial-scale fisheries. Attention has been given to the early whaling activity in the North Pacific as this affected the more valuable and easier to harvest species. The effects of removing this biomass of whales on controls in the Bering Sea ecosystem is not clear[201] but cannot have been insignificant. The decline in the North Pacific whaling was offset by effort directed toward other areas, including the Southern Ocean. For communities where rending and processing occurred onshore, the displacement of effort meant the end of whaling as a source of employment and income.
Fisheries development after the Second World War tended to target the highest value species first. Despite efforts to develop sufficient scientific information and international management under the International Convention for High Sea Fisheries of the North Pacific Ocean, some stocks such as Pacific ocean perch and other longer-lived, high value species were overfished. The opportunity to fish on previously unfished stocks of very large size and extent resulted in significant employment and income benefits. With the development of coastal state management came the need to manage these large-scale fisheries properly. Most observers do not consider the harvests reported for the early period to be an accurate representation of catches. The valuable but limited joint scientific survey of stocks, performed by Canada, Japan, and the United States under the Convention, provides some information. This results in the period of record being extremely limited. Another factor is that the Bering Sea is a large, remote, and difficult area to characterize and monitor. Thus, the linking of scientific advice to fisheries management objectives has been a process of successive refinement. The ability to assess the range in natural variability in stock sizes is very imprecise and how the [[ecosystem]s] function is only now being modeled with a significant degree of sophistication to begin to understand some of the issues involved[202].
Eight periods of alternating cold/warm sea [[temperature]s] are evident in the instrumental record. The extent to which these have altered population sizes and concentrations is difficult to establish for the reasons mentioned. Furthermore, population sizes may have been affected by high levels of fishing for some high value species, and low levels of fishing for species with low market value or with high levels of bycatch. Fishery management is generally thought to mediate for overfishing and to manage to maintain abundance of desired species. Since the mid- to late 1970s warmer temperatures and the associated patterns of atmospheric and sea surface circulation may have favored salmonids, winter spawning flatfish, walleye pollock, Pacific cod, and Pacific halibut, and have been detrimental to capelin, Pacific herring, shrimps, and several species of large crab. Fisheries have developed on those species that are at high levels of abundance and left those whose abundance is low[203].
The US fishing industry in the Bering Sea survived changes in the relative abundance of particular species during the growth phase by, for example, shifting from crab fishing to walleye pollock fishing and Pacific cod fisheries. This has altered conditions for traditional crab processing ports in the Pribilof Islands but has contributed to the growth of groundfish processing in Dutch Harbor/Onalaska and Akutan. The question is what would happen to the industry under a pronounced shift to a coldwater period. Fisheries management is attempting to rationalize effort in these fisheries to increase efficiency, to reduce bycatch of prohibited species, and to increase capture value through higher quality products and utilization rates. This tends to reduce flexibility of movement, as occurred when the domestic fisheries developed. There is little planning in place for how fishery management could operate in a transition between cold and warm regimes. For most of the groundfish species management under quotas, the expectation is that small or large year classes would be detected in the assessments and that quotas would rise and fall to prevent overfishing. For species with short lifespans this approach may be less effective, although high natural variability is considered by managers. For exceptionally long-lived species such as rockfish (Sebastes spp.), experience shows that very conservative harvest rates may need to be used and no-take marine reserves have been suggested as a tool to insure against loss of older highly productive fish.
This is an important issue, as is evident from the massive buildup of the red king crab fleet in the late 1970s to harvest anomalously large quantities of a Bristol Bay stock that subsequently crashed – probably due to recruitment failure following changes in environmental conditions. Additional effort entered the crab fleet with the strong stocks of snow crabs in the 1980s and 1990s. A sharp decline in these fisheries, again associated with changes in environmental conditions, caused severe problems for operators with high debt service and relatively few assets. These problems in the eastern Bering Sea crab fisheries provided an incentive to find other pot gear fishing opportunities and so other fixed gear operators in Pacific cod are now being squeezed by the entry of crab vessels into their traditional fisheries. This domino effect is highly predictable even if the underlying phenomena driving the process are not. Warmer conditions are less favorable for pinnipeds. This appears to be an indirect food web effect rather than a direct effect through predation, although there may be interacting effects. This complex interaction between climate and pinniped survival has a pronounced effect on major commercial fisheries in the eastern Bering Sea under US jurisdiction. The spatial extent and timing of walleye pollock, Atka mackerel, and Pacific cod fisheries have been modified as a precautionary measure to protect Steller sea lions[204]. In this way, changes in environmental conditions that result in effects on non-target species can be sufficiently significant in terms of the management of endangered and threatened species that they result in increased fishing costs and thus reduced profits.
The many subsistence fishing villages on the shores of the Bering Sea experience climate variability directly. The 65 CDQ communities in the eastern Bering Sea region have direct connections with climate variability through subsistence fishery activities and participation in the industrial fisheries through their partners. Industrial fisheries in the Bering Sea are dependent on large-scale shore-based processing plants that can operate, like the fishery itself, under difficult conditions.This is because catcher vessels that deliver to the shoreside plants must now operate further offshore because of the closed areas to buffer sea lion competition for prey. At-sea processors are more adaptable to changing environmental conditions because they can follow the fish and fishing conditions and can deliver to various ports.
Salmonids have well-documented aggregate north/south shifts in production under warm and cold periods[[[205]]]. Although this does not explain all sources of variability it has been used successfully to gain a better management understanding. These trends are now being exacerbated by the decrease in market price following the decline in the Asian market and competition from farmed sources of Atlantic salmon. Even at high levels of abundance fishing for wild salmonids in the Bering Sea is at best marginal. This may force fundamental change in the structure and practices of salmon fishing. Also, extremely low returns to the Yukon River make survival of the Alaskan and Canadian indigenous peoples dependent on the abundance of migrating salmonids precarious. This has brought disaster relief in the form of federal and state loans and welfare programs. Recent studies[[[206]]] suggest that the decline in Yukon stocks may be due to warmer environmental conditions and so beyond the control of fishery managers. The low levels of salmon have already resulted in renewed calls for reducing the salmon bycatch in Bering Sea trawl fisheries. Even though salmon bycatch rates have been reduced, more salmon are wanted by Yukon and other peoples. The trawl industry that has been pushed from low to higher bycatch areas due to measures for Steller sea lion protection has taken proactive real time measures to avoid salmon bycatch.
The location of the sea-ice edge and of the extent and timing of the melting of the sea ice as well as the development of the “cold pool” can have positive and negative effects on fisheries through their tendency to concentrate or disperse certain species or to contribute to increased levels of primary and secondary production within the Bering Sea ecosystem. Direct impacts on crab pot loss resulting from shifts in the position of the ice edge have been noted in the opilio fisheries in some cold years. The economic consequences of these types of variability are considered part of the risks of fishing in the Bering Sea. At present, it is possible to make only general comments about the effects of climate variability on fisheries in the Bering Sea from a socio-economic perspective. Better analyses require a better scientific understanding of ecosystem dynamics within the Bering Sea and a better ability to predict. A complicating factor is the difficulty of understanding the dynamics within the fisheries due to the very short period of record. Also, external market forces are currently affecting the value of the fisheries to a very significant extent and this may be more important than variability in landings or overall fish abundance.
At the industrial scale of fishing and processing that is characteristic of groundfish and crab fisheries in the Bering Sea, the social effects reflect broader economic trends. Lower prices and quantities generate fewer and less well paid jobs. However, high world market prices for species such as red king crab may offset declines in stocks when other sources of supply decrease (e.g., in Russian waters), or increase (e.g., red king crab in northern Norway). Rationalization through the economic system or fishery management systems may allow greate long-term stability with less overall investment in harvesting and processing. Fewer operators earning a greater return on investment are more likely to absorb swings in abundance due to changes in environmental or other conditions. It is difficult to assess impacts on consumers as the world trade in fisheries tends to find ways to satisfy market demands. However, impacts on fishery dependent communities and small family-owned enterprises can be devastating as the high costs of fishing may exceed the price available[[[207]]]. Having most assets tied up in ownership of a fishing vessel and gear, a limited entry area permit, and nowhere to sell is a formula for disaster. Many operations face bankruptcy and in communities with many such entities, there are few alternatives.
Ability to cope with change (13.5.7)
Over the past few decades Bering Sea fisheries have been built around fairly consistent warm water species although there are some differences between the western and eastern Bering Sea. Coastal states have benefited more in recent years than distant water fishing nations. However, the management response to a transition to a cold phase has not been adequately considered nor has the response to continued warm periods. Changes to stocks in the western Bering Sea and projected stock dynamics in response to a moderate warming are explored in Table 13.2. Assuming a shift between a cold and warm regime in the mid-1970s, which for the Bering Sea is only ±1 ºC (see Possible impacts of climate change on fish stocks above), could result in many effects and other coincident changes. For example: salmon increase in number but the world market price declines; groundfish abundance increases but the Asian market is weak owing to other economic factors; US snow crab stocks decline but Canadian stocks increase due to possible unfavorable or favorable environmental conditions.
A very small difference in ocean conditions can be detected as a cold or warm phase in the Bering Sea. Although a global climate change scenario for the Bering Sea per se does not exist, this shift between cold and warm periods provides some working hypotheses about what could be expected. At a minimum, it is likely that the conditions that have prevailed over the past few decades might constitute a baseline for slightly warmer conditions. Which means there is unlikely to be a resurgence of crab or shrimp populations or herring and capelin and other small pelagic species. The ecosystem would continue to be dominated by walleye pollock, Pacific cod, and flatfish. Walleye pollock juveniles may continue to occupy the role of coldwater forage fish. Salmonids would probably remain abundant in the aggregate in northern waters but in the south off British Columbia and Washington and Oregon stocks would decrease.
Socio-economically this baseline case would replicate the current system in terms of production of fish commodities. Through improvements in fishery management, it may be possible to increase the harvests of certain stocks by managing for recovery to levels of former abundance. However, it is just as likely that unforeseen events or interactions may result in management mistakes that offset such gains. Exploitation of underutilized species may be feasible to some degree. There may be some gains in catching the whole TAC due to changes in gear and fishing practices to generate lower bycatch rates. To attain increases in value added and utilization rates, it may be necessary to further rationalize the industry. Additional factors to be included in the scenario of a continuation of prevailing conditions are declines in marine mammal and seabird populations. In some cases, fishery interactions, while modest and indirect, may justify further efforts to protect the numbers of seabirds and marine mammals under an adverse environmental regime, and such requirements may constrain fisheries more than would be the case if the stock was the sole interest of management. Similarly, environmental groups may change the level of performance that they expect fishery management to attain, i.e., no detectable impact standard or negligible effect standard and this would alter the management “field of play”.
With continued warming, there is likely to be a range of sea [[temperature]s] that would continue to generate positive recruitment and growth scenarios for some of the warm water species (Table 13.2). This is likely to result in unfavorable conditions (i.e., increased predation) for pandalid shrimp and most crab species. If walleye pollock stocks increase, their impact as a predator on fish may also increase with unpredictable outcomes. Migration paths, timing of spawning, timing of the start of primary production, and species composition are very unlikely to remain the same. Similarly, reduced sea ice is likely to change the early spring ecosystem processes but greater surface exposure to winter storm conditions is likely to increase nutrient cycling and resuspension from shallower waters. To date, there are no credible published predictions of changes to fisheries north of the Bering Strait under a no or low sea ice scenario.
Concluding comments (13.5.8)
In comparison to fisheries in other areas of the Arctic, commercial fisheries of the North Pacific, including the Sea of Okhostk and the Bering Sea, are relative newcomers. Commercial fishing for groundfish stocks other than Pacific halibut began in the Bering Sea in the 1950s by fleets from Japan and Russia and soon developed into large-scale operations involving many nations.These fleets primarily harvested walleye pollock, Pacific cod, flatfish, sablefish, Atka mackerel, crab, herring, and salmon stocks. In the late 1970s, EEZs were established 200nm seaward from the coast by Russia and the United States and fisheries management plans were established. By 1990, the distant water fleets were phased out of the eastern Bering Sea (i.e., the US EEZ). US fisheries off Alaska constitute more than half the landings and about half the value of national landings of fish and shellfish from federal waters. In the Russian EEZ, most catches are taken by domestic fleets with a decreasing proportion harvested under agreements with neighboring states.
Well-documented climate regime shifts occurred in the Bering Sea over the 20th century at roughly decadal time scales, alternating between warm and cool periods. A climate regime shift in the Bering Sea in 1977 changed the marine environment from a cool to a warm state. The warming-induced ecosystem shifts favored recruitment to herring stocks and enhanced productivity for Pacific cod, skates, flatfish, and non-crustacean invertebrates. The species composition of the benthic community changed from a crab-dominated assemblage to a more diverse mix of starfish, ascidians, and sponges. Pacific salmon production was found to be positively correlated with warmer [[temperature]s]. Consecutive strong year classes were established and historically high commercial catches were taken. Levels of walleye pollock biomass were low in the 1960s and 1970s (2 to 6 million t) but subsequently increased to levels greater than 10 million t and have remained large in most years since 1980.
Information from the contrast between the 1977 to 1989 warm period and the prior and subsequent cool periods (1960–1976 and 1989–2000) form the basis of the predicted response of the Bering Sea ecosystem to scenarios of future warming. Predictions include increased primary and secondary productivity with a greater carrying capacity, increased catches for species favored by a warm regime, poleward shifts in the distributions of some cold-water species, and possible negative effects on ice-associated species.
Walleye pollock is the major harvest species by volume and value, with Pacific cod, flatfish, salmon, and crabs constituting most of the rest. Total wholesale value for groundfish harvests in the eastern Bering Sea is approximately US$ 426 million, while the total primary processed value is approximately US$ 1.4 billion. The North Pacific fishing communities surrounding the Bering Sea are different from those of the North Atlantic. On the coast of the eastern Bering Sea there are some 65 communities with a total population of around 27,500 inhabitants, but these do not have a long history of fishing.
Fishery Management Plans are the main tool for fishery management in US waters. These set forth the rules and regulations for the management of each species or species complexes. Under the current management approach, TACs are set on an annual basis in the Stock Assessment Fishery Evaluation process. Ecosystem considerations are explicitly made available at the time of the TAC setting process. The North Pacific Fishery Management Council has developed some fairly innovative approaches to management. In the EEZ of the Russian Far East, the regional administration is subject to central control for setting TAC allocations and for Border Guard enforcement.
The main changes over the years in the commercial fisheries of the Bering Sea have been in the distribution of the harvests among nations and sub-national user groups. There have been extensive adjustments to changing claims to jurisdiction in the Bering Sea. The tremendous dislocation of fishing fleets from Japan and Russia (then the Soviet Union) after the EEZ extension to 200nm shows that major adjustments can be made but with considerable hardship. Similarly, the response of the US fishing industry, assisted by favorable government incentives, shows how quickly the fishery can respond to changed opportunities.
Eight periods of alternating cold/warm sea [[temperature]s] are evident in the instrumental record. Population sizes may have been affected by both high levels of fishing for some high-value species and low levels of fishing for species with low market value or with high levels of bycatch. Fishery management is generally intended to prevent overfishing and maintain the abundance of desired species. Since the mid- to late 1970s, warmer temperatures and associated atmospheric and sea surface circulation may have favored salmonids, winter-spawning flatfish, walleye pollock, Pacific cod, and Pacific halibut but have been detrimental to capelin, Pacific herring, shrimps, and several species of large crab. Fisheries are fully developed on those species that are at high levels of abundance, but have essentially ceased on those whose abundance is low.The last few decades of Bering Sea fisheries have been built around species that consistently favor warm water. However, there are some contradictions between the western and eastern Bering Sea. There is no question that coastal states have benefited more in recent years than distant water fishing nations. However, the management response to a transition to a cold phase has not been adequately considered, nor has it for the opposite, i.e., continued prevailing warm conditions.
Previous sections of this chapter have demonstrated that a very small difference in ocean environmental conditions can be detected as a cold or warm phase in the Bering Sea. While there is not a global climate change scenario for the Bering Sea per se, this shift between cold and warm periods does provide a basis for some working hypotheses about what to expect in the area in future. At a minimum, it is likely that the conditions which have prevailed over the last few decades might constitute a baseline for slightly warmer conditions. Therefore, there is not likely to be a resurgence of crab or shrimp populations, or herring and capelin and other small pelagic fish species. The ecosystem is likely to continue to be dominated by walleye pollock, Pacific cod, and flatfish. Walleye pollock juveniles are likely to continue their role as cold-water forage fish. Salmonids are likely to remain abundant in the aggregate in northern waters, but south off British Columbia and Washington and Oregon stock abundance would be depressed.
Socio-economically this baseline case would replicate the current system in terms of production of fish commodities. Through improvements in fisheries management, it may be possible to increase harvests of certain stocks by managing for recovery to levels of former abundance. However, it is probably just as likely that unforeseen events or interactions may produce management mistakes that offset such gains in a dynamic ocean system. Exploitation of underutilized species may be feasible to some degree. Some gains in catching the whole TAC might be possible due to improvements in gear and fishing practices to lower bycatch rates. In order to attain increases in value added and in utilization rates, the industry may need to be further rationalized.
Under a continued warming scenario, it is very likely that there could be a range of temperatures that would continue to generate positive recruitment and growth scenarios for some of the warm advantaged species. These conditions would be negative for pandalid shrimp and most crab species. If walleye pollock stocks increase, their impact as a predator on fish may also increase with unpredictable outcomes. It is very unlikely that migration paths, timing of spawning, timing of start of primary production, and composition of species would remain the same. Similarly, loss of sea ice may result in changes to the early spring bloom and associated ecosystem processes, however greater surface exposure to winter storm conditions might increase nutrient circulation and resuspension in shallower waters. To date, there are no credible published data on what could happen in the waters north of the Bering Strait with respect to fisheries under a change to a significantly warmer climate.
Chapter 13: Fisheries and Aquaculture
13.1 Introduction (Fisheries and aquaculture in the North Pacific (Bering Sea))
13.2 Northeast Atlantic – Barents and Norwegian Seas
13.3 Central North Atlantic – Iceland and Greenland
13.4 Newfoundland and Labrador Seas, Northeastern Canada
13.5 North Pacific – Bering Sea
13.6. Synthesis and key findings
13.7. Research recommendations
References
- ^NPFMC, 2004. Stock Assessment and Resource Evaluation Report. The groundfish resources of the Bering Sea. North Pacific Fisheries Management Council.
- ^1965–1993 data from: Committee on the Bering Sea Ecosystem, 1996. R.C. Francis (Chair), L.G. Anderson,W.D. Bowen, S.K. Davis, J.M. Grebmeier, L.F. Lowry, I. Merculieff, C.H. Peterson, C. Pungowiyi,T.C. Royer, A.M. Springer and W.S.Wooster, 1996.The Bering Sea Ecosystem. Commission on Geosciences, Environment and Resources (CGER), Polar Research Board (PRB). 320p.
- ^Hare, S.R. and N. Mantua, 2000. Empirical evidence for North Pacific (climatic) regime shifts in 1977 and 1989. Progress in Oceanography, 47(2–4):103–145.
- ^after: Stabeno, P.J., N.A. Bond, N.B. Kachel, S.A. Salo and J.D. Schumacher, 2001. On the temporal variability of the physical environment over the south-eastern Bering Sea. Fisheries Oceanography, 10(1):81–98.
- ^after: Naumenko, N.I., P.A. Balykin and E.A. Naumenko, 2001. Long-term fluctuations in the pelagic community in the western Bering Sea. In: Abstracts of PICES Tenth Annual Meeting,Victoria, BC, Canada.pp. 125.
- ^Overland, J.E. 1981. Marine Climatology of the Bering Sea. In: D.W. Hood and J.A. Calder (eds.). The eastern Bering Sea shelf: oceanography and resources, pp. 15–22. University of Washington Press.
- ^Miles, E., S. Gibbs, D. Fluharty, C. Dawson and D.Teeter, 1982a. The Management of Marine Regions:The North Pacific. California University Press, 656p.-- Miles, E., J.Sherman, D. Fluharty and S. Gibbs, 1982b. Atlas of Marine Use:The North Pacific. California University Press, 121p.
- ^Ginter, J., 1995. The Alaska community development quota fisheries management program. Ocean and Coastal Management, 28(1–3):147–163.
- ^Hiatt,T., R. Felthoven and J.Terry, 2002. Stock assessment and fishery evaluation report for the groundfish fisheries of the Gulf of Alaska and Bering Sea/Aleutian Island Areas. Appendix D economic status of the groundfish fisheries of Alaska, 2001. Alaska Fisheries Science Center, National Marine Fisheries Service, National Oceanic and Atmospheric Administration, Seattle, 119p.
- ^NPAFC, 2001. Annual Report, 2001. North Pacific Anadromous Fish Commission,Vancouver.
- ^Coachman, L.K. 1986. Circulation, water masses, and fluxes on the southeastern Bering Sea shelf. Continental Shelf Research, 5:23–108.
- ^Naumenko, N.I., P.A. Balykin, E.A. Naumenko and E.R. Shaginyan, 1990. Long-term changes in pelagic fish community in the western Bering Sea.TINRO Transactions, 111:49–57. (In Russian)
- ^Wespestad,V.G., 1987. Population dynamics of Pacific herring (Clupea pallasii), capelin (Mallotus villosus) and other coastal pelagic fishes in the eastern Bering Sea. In: Forage fishes of the Southeastern Bering Sea. US Dep. Int., Min. Mgt. Serv., Alaska OCS Region, MMS87- 0017:55–60.
- ^Alton, M.S., R.G. Bakkala, G.E.Walters and P.T. Munro, 1988. Greenland turbot, Rheinhardtius hippoglossoides, of the eastern Bering Sea and Aleutian Islands. NOAA Tech. Rep. NMFS 71, 31 p.-- Shuntov,V.P. 1970. Seasonal distribution of black and arrow-toothed halibuts in the Bering Sea.TINRO Transactions, vol. 72.VNIRO Transactions, Mutual issue, 70:391–401. (In Russian)-- Templeman,W., 1973. Distribution and abundance of the Greenland halibut, Rheinhardtius hipploglossoides (Walbaum) in the Northwest Atlantic. International Commission Northwest Atlantic Fisheries Research Bulletin, 10:82–98.
- ^Alton, M.S., R.G. Bakkala, G.E.Walters and P.T. Munro, 1988. Greenland turbot, Rheinhardtius hippoglossoides, of the eastern Bering Sea and Aleutian Islands. NOAA Tech. Rep. NMFS 71, 31 p.
- ^Ianelli, J.N.,T.K.Wilderbuer and T.M. Sample, 2001. Greenland turbot. In: Stock Assessment and Fishery Evaluation Report for the Groundfish Resources of the Bering Sea/Aleutian Islands regions. Chapter 4.
- ^Borets, L.A., 1997. Bottom ichthyocoenoses of the Russian shelf of the far-eastern seas: composition, structure, functioning elements, and commercial significance.TINRO-Center. 217 p. (In Russian)-- Novikov, N.P., 1974. Commercial fishes of continental slope of the northern part of Pacific Ocean. Moscow: Food Industry. 308 p. (In Russian)
- ^Ivanov, B.G., 1970. Distribution of northern shrimp (Pandalus borealis Kr.) in the Bering Sea and the Gulf of Alaska.TINRO Transactions vol. 72.VNIRO Transactions, Mutual issue, 70:131–148. (In Russian)
- ^Ivanov, B.G., 2001. Studies and fisheries of pandalid shrimps (Crustacea, Decapoda, Pandalidae) in the Northern Hemisphere: A review in the XXI century eve (with special reference to Russia), pp. 9–31. In: Ivanov, B.G. (ed.). Study of biology of commercial crustaceans and algae of Russian seas. (In Russian)
- ^Tuponogov, V.N., 2001. Polar cod. In: Hydrometeorology and Hydrochemistry of Seas, pp. 199–204.Vol. 10.The Bering Sea. Issue 2. Hydrochemical Conditions and Oceanological Fundamentals of Formation of Biological Productivity. Hydrometeoizdat. (In Russian)
- ^see: Tuponogov, V.N., 2001. Polar cod. In: Hydrometeorology and Hydrochemistry of Seas, pp. 199–204.Vol. 10.The Bering Sea. Issue 2. Hydrochemical Conditions and Oceanological Fundamentals of Formation of Biological Productivity. Hydrometeoizdat. (In Russian)
- ^Otto, R.S., 1998. Assessment of the eastern Bering Sea snow crab, Chionoecetes opilio, stock under the terminal molting hypothesis. In: G.S. Jamieson and A. Campbell (eds.). Proceedings of the North Pacific Symposium on Invertebrate Stock Assessment and Management. Can. Spec. Publ. Fish. Aquat. Sci. 125:109–124.
- ^Stevens, B.G. R.A. MacIntosh, G.A. Haaga and J.H. Bowerman, 1993. Report to the industry on the 1992 eastern Bering Sea crab survey. Alaska Fisheries Science Center. Processed Rep. 93–14. 53 p.
- ^Slizkin, A.G. and V.Ya. Fedoseev, 1989. Distribution, biology, population structure and abundance of Tanner crabs in the Bering Sea. In: Proceedings of the International Scientific Symposium on Bering Sea Fisheries. Sitka, Alaska. Seattle, pp. 316–347.
- ^Davis, 1982
- ^ADF&G, 2002. Alaska Commercial Harvests of King,Tanner, and Snow Crab, 1953–2000. Alask department of Fish and game, www.cf.adfg.state.ak.us/region4/shellfsh/crabs/1953–00.htm
- ^NPFMC, 2002. Stock Assessment Fishery Evaluation. North Pacific Fishery Management Council, Anchorage.
- ^Shuntov,V.P., A.F.Volkov, O.S.Temnykh and E.P. Dulepova, 1993. Walleye pollock in the far-eastern seas ecosystems.TINRO, 426p. (In Russian)-- Wolotira Jr., R.J.,T.M. Sample, S.F. Noel and C.R. Iten, 1993. Geographic and bathymetric distributions for many commercially important fishes and shellfishes off the west coast of North America based on research survey and commercial catch data, 1912–1984. NOAA Tech. Memorandum NMFS-AFSC-6, 184p.
- ^NPFMC, 2002. Stock Assessment Fishery Evaluation. North Pacific Fishery Management Council, Anchorage.
- ^Thompson, G.G. and M. Dorn, 2001. Pacific cod. In: Stock Assessment and Fishery Evaluation Report for the Groundfish Resources of the Bering Sea/Aleutian Islands regions. Chapter 2.
- ^Gordeev,V.D., 1954. Results of the Bering Sea trawl expedition of 1950–52.TINRO Transactions, 41:253–269. (In Russian)
- ^Vinnikov, A.V., 1996. Pacific cod (Gadus macrocephalus) of the western Bering Sea. In: O.A. Mathisen and K.O. Coyle (eds.). Ecology of the Bering Sea: A review of Russian literature, pp. 183–202. Alaska Sea Grant College Program Report No. 96–01.
- ^Vinnikov, A.V., 1996. Pacific cod (Gadus macrocephalus) of the western Bering Sea. In: O.A. Mathisen and K.O. Coyle (eds.). Ecology of the Bering Sea: A review of Russian literature, pp. 183–202. Alaska Sea Grant College Program Report No. 96–01.
- ^Hart, J.L. 1973. Pacific Fishes of Canada. Fisheries Research Board of Canada Bulletin 180, 740p.
- ^Nichol, D.G., 1997. Effects of geography and bathymetry on growth and maturity of yellowfin sole, Pleuronectes asper, in the eastern Bering Sea. Fishery Bulletin, 95:494–503.
- ^Wilderbuer,T.K., A.B. Hollowed,W.J. Ingraham, P.D. Spencer, M.W. Conners, N.A. Bond and G.E.Walters, 2002. Flatfish recruitment response to decadal climate variability and ocean conditions in the eastern Bering Sea. Progress in Oceanography, 55(1–2):235–248.
- ^Nichol, D.G., 1994. Maturation and spawning of female yellowfin sole in the eastern Bering Sea. Proceedings of the International Pacific Flatfish Symposium, Anchorage, Alaska.
- ^Wilderbuer,T.K., 1997.Yellowfin sole. In: Stock Assessment and Fishery Evaluation Report for the Groundfish Resources of the Bering Sea and Aleutian Islands Regions as projected for 1998, pp. 160–187.
- ^Netboy, A., 1974. The salmon: their fight for survival. Houghton Mifflin, Boston.
- ^Chigirinsky, A.I., 1994. Commercial fishing of Pacific salmon in the Bering Sea.TINRO Transactions, 116:142–151. (In Russian)
- ^Chigirinsky, A.I., 1994. Commercial fishing of Pacific salmon in the Bering Sea.TINRO Transactions, 116:142–151. (In Russian)
- ^Netboy, A., 1974. The salmon: their fight for survival. Houghton Mifflin, Boston.
- ^Harris, L. (Chairman), 1989. Independent Review of the State of the Northern Cod Stock. Department of Fisheries and Oceans, Ottawa.
- ^Queirolo, L.E., L.W. Fritz, P.A. Livingston, M.R. Loefflad, D.A. Colpo and Y.L. deReynier, 1995. Bycatch, utilization, and discards in the commercial groundfish fisheries of the Gulf of Alaska, Eastern Bering Sea and Aleutian Islands. NOAA Tech. Mem. NMFS-AFSC- 58. 148p.
- ^Radchenko,V.I. and I.I. Glebov, 1998. Incidental by-catch of Pacific salmon during Russian bottom trawl surveys in the Bering Sea and some remarks on its ecology. North Pacific Anadromous Fish Commission Bulletin, 1:367–374.
- ^Lowry, L.F. and K. J. Frost, 1985. Biological interactions between marine mammals and commercial fisheries in the Bering Sea. In: J.R. Beddington, R.J.H. Beverton and D.M. Lavigne (eds.).
- ^Lowry, L.F., K.J. Frost, D.G. Calkins, G.L. Swartzman and S. Hills, 1982. Feeding habits, food requirements, and status of Bering Sea marine mammals. North Pacific Fishery Management Council, Anchorage, Alaska. Document Nos. 19 and 19A. 574p.
- ^Langer, R.H., 1980. Summary of Northern Fur Seal data and collection procedures. NOAA Tech. Mem. NMFS F/NWC-3.
- ^Boltnev, A.I., 1996. Status of the northern fur seal (Callorhinus ursinus) population on the Commander Islands. In: O.A. Mathisen and K.O. Coyle (eds.). Ecology of the Bering Sea: A Review of Russian Literature. Alaska Sea Grant College Program Report No. 96–01, pp. 277–288.
- ^NMFS, 1999. Our Living Oceans. Report on the Status of US Living Marine Resources, 1999. NOAA Tech. Memo. NMFS-F/SPO-41, 301p. National Marine Fisheries Service,Washington, D.C.
- ^Kenyon, K.W., 1962. History of the Steller sea lion at the Pribilof Islands, Alaska. Journal of Mammalogy, 43:68–75.
- ^Angliss, R.P., D.P. Demaster and A.L. Lopez, 2001. Alaska marine mammal stock assessments, 2001. NOAA Tech. Mem. NMFS-AFSC-124. 203p.
- ^Schumacher, J.D., 2000. Regime shift theory: A review of changing environmental conditions in the Bering Sea and the Eastern North Pacific. In: S. Connover (ed.). Proceedings of the Fifth North Pacific Rim Fisheries Conference, pp. 127–142. Cooperation, coordination and communication, AK: Pacific Rim Fisheries Program, Institute of the North, Alaska Pacific University.
- ^Davydov, I.V., 1972. On oceanological fundamentals of yield formation of the separate herring generations in the western Bering Sea. TINRO Transactions, 82:281–307. (In Russian)-- Van Loon, H. and D.J. Shea, 1999. A probable signal of the 11-year solar cycle in the troposphere of the northern hemisphere. Geophysical Research Letters, 26:2893–2896.
- ^Beamish, R.J. and D.R. Bouillon, 1993. Pacific salmon production trends in relation to climate. Canadian Journal of Fisheries and Aquatic Sciences, 50(5):1002–1016.-- Francis, R.C., S.R. Hare, A.B. Hollowed and W.S.Wooster, 1998. Effects of interdecadal variability on the oceanic ecosystems of the NE pacific. Fisheries Oceanography, 7:1–21.-- Hollowed, A.B. and W.S.Wooster, 1992.Variability of winter ocean conditions and strong year classes of Northeast Pacific groundfish. ICES Marine Science Symposia, 195:433–444.-- Latif, M. and T.Barnett, 1994. Causes of decadal climate variability over the North Pacific and North America. Science, 266:634–637.-- Luchin,V.A., I.P. Semiletov and G.E.Weller, 2002. Changes in the Bering Sea region: atmosphere-ice-water system in the second half of the twentieth century. Progress in Oceanography, 55(1–2):23–44.--Wooster,W.S. and A.B. Hollowed, 1995. Decadal-scale variations in the eastern subarctic Pacific: I.Winter ocean conditions. In: R.J. Beamish (ed.). Climate Change and Northern Fish Populations, pp. 81–85. Canadian Special Publication in Fisheries and Aquatic Science 121.
- ^Stabeno, P.J., N.A. Bond, N.B. Kachel, S.A. Salo and J.D. Schumacher, 2001. On the temporal variability of the physical environment over the south-eastern Bering Sea. Fisheries Oceanography, 10(1):81–98.
- ^Hollowed, A.B. and W.S.Wooster, 1995. Decadal-scale variations in the eastern subarctic Pacific: II. Response of Northeast Pacific fish stocks. In: R.J. Beamish (ed.). Climate Change and Northern Fish Populations, pp. 373–385. Canadian Journal of Fisheries and Aquatic Sciences 121.
- ^Overland, J.E., J.M. Adams and N.A. Bond, 1999. Decadal variability and the Aleutian Low and its relation to high-latitude circulation. Journal of Climate, 12:1542–1548.
- ^Trenberth, K.E., 1990. Recent observed interdecadal climate changes in the Northern Hemisphere. Bulletin of the American Meteorological Society, 71:988–993.-- Hare, S.R. and N. Mantua, 2000. Empirical evidence for North Pacific (climatic) regime shifts in 1977 and 1989. Progress in Oceanography, 47(2–4):103–145.
- ^Shuntov,V.P. and V.I. Radchenko, 1999. Summary of TINRO Ecosystem Investigations in the Bering Sea. In:T.R. Loughlin and K. Otani (eds.). Dynamics of the Bering Sea. Alaska Sea Grant Program. AK-SG-99-03. pp. 771–776.
- ^Sapozhnikov,V.V., N.V. Arzhanova and V.V. Zubarevitch, 1993. Estimation of primary production in the ecosystem of western Bering Sea. Russian Journal of Aquatic Ecology, 2(1):23–34.
- ^Radchenko,V.I., G.V. Khen and A.M. Slabinsky, 2001. Cooling in the western Bering Sea in 1999: quick propagation of La Niña signal or compensatory processes effect? Progress in Oceanography, 49(1–4):407–422.
- ^Francis, R.C., S.R. Hare, A.B. Hollowed and W.S.Wooster, 1998. Effects of interdecadal variability on the oceanic ecosystems of the NE pacific. Fisheries Oceanography, 7:1–21.
- ^Niebauer, H.J., N.A. Bond, L.P.Yakunin and V.V. Plotnikov, 1999. An update on the climatology and sea ice of the Bering Sea. In:T.R. Loughlin and K. Ohtani (eds.). Dynamics of the Bering Sea, pp. 29–59. Alaska Sea Grant College Program. AK-SG-99-03.-- Stabeno, P.J., N.A. Bond, N.B. Kachel, S.A. Salo and J.D. Schumacher, 2001. On the temporal variability of the physical environment over the south-eastern Bering Sea. Fisheries Oceanography, 10(1):81–98.
- ^Brodeur, R.D. and D.M.Ware, 1992. Long term variability in zooplankton biomass in the subarctic Pacific Ocean. Fisheries Oceanography, 1(1):32–38.-- Hollowed, A.B., S.R. Hare and W.S.Wooster, 2001. Pacific Basin climate variability and patterns of Northeast Pacific marine fish production. Progress in Oceanography, 49:257–282.-- Luchin,V.A., I.P. Semiletov and G.E.Weller, 2002. Changes in the Bering Sea region: atmosphere-ice-water system in the second half of the twentieth century. Progress in Oceanography, 55(1–2):23–44.-- Minobe, S, 1999. Resonance in bidecadal and pentadecadal climate oscillations over the North Pacific: Role in climate regime shifts. Geophysical Research Letters, 26(7):853–858.-- Polovina, J.J., G.T. Mitchum and G.T. Evans, 1995. Decadal and basinscale variation in mixed layer depth and the impact on biological production in the Central and North Pacific, 1960–88. Deep-Sea Research, 42(10):1701–1716.-- Sugimoto,T. and K.Tadokoro, 1997. Interannual-interdecadal variations in zooplankton biomass, chlorophyll concentration and physical environment in the subarctic Pacific and Bering Sea. Fisheries Oceanography, 6(2):74–93.
- ^Shuntov,V.P.,V.I. Radchenko, E.P. Dulepova and O.S.Temnykh, 1997. Biological resources of the Far Eastern Russian economic zone: structure of pelagic and bottom communities, up-to-date status,tendencies of long-term dynamics. TINRO Transactions, 122:3–15. (In Russian)
- ^Radchenko,V.I., G.V. Khen and A.M. Slabinsky, 2001. Cooling in the western Bering Sea in 1999: quick propagation of La Niña signal or compensatory processes effect? Progress in Oceanography, 49(1–4):407–422.
- ^Vinogradov, M.E. and E.A. Shushkina, 1987. Functioning of pelagic communities in the oceanic epipelagic layer. Nauka Publishers, 240p. (In Russian)-- Zaika,V.E., 1983. Comparative hydrobiont productivity. Naukova Dumka Publishers, 203p. (In Russian)
- ^Huntley, M.E. and M.D.G. Lopez, 1992. Temperature-dependent production of marine copepods: a global analysis. American Naturalist, 140:201–242.
- ^Smith, S.L., and J.Vidal, 1986.Variations in the distribution, abundance, and development of copepods in the southeastern Bering Sea in 1980 and 1981. Continental Shelf Research, 5:215–239.
- ^Luchin,V.A., A.V. Saveliyev and V.I. Radchenko, 1998. Long-period climatic waves in the western Bering Sea ecosystem. In:V.F. Kozlov (ed.). Climate and Interannual Variability in the Atmosphere-Land-Sea system in the American-Asian sector of the Arctic, pp. 31–42. Proceedings of the Arctic regional center.V.1.Vladivostok: Far- Eastern State University Press. (In Russian)
- ^Shuntov,V.P. and V.P.Vasilkov, 1982. Epochs of atmospheric circulation and cyclic reoccurrence of abundance dynamics of Far- Eastern and Californian sardine. Journal of Ichthyology, 22(1):187–199. (In Russian)
- ^Girs, 1974
- ^Glebova, S.Yu., 2001. Coordination of types of atmospheric processes above the far-eastern seas.TINRO Transactions, 128:58–74. (In Russian)-- Overland, J.E., 2004. Ocean and climate changes. In:V. Alexander, R.I. Perry (eds.). PICES Report on Marine Ecosystems of the North Pacific. Special Publication of the North Pacific Marine Science Organization, 1:39–57.
- -- Wyllie-Echeverria,T. and K. Ohtani, 1999. Seasonal sea ice variability and the Bering Sea ecosystem. In:T.R. Loughlin and K. Ohtani (eds.). Dynamics of the Bering Sea. Alaska Sea Grant College Program. AK-SG-99-03. pp. 435–451.
- ^Wyllie-Echeverria,T., 1995. Sea-ice conditions and the distribution of walleye pollock (Theragra chalcogramma) on the Bering and Chukchi Shelf. In: R.J. Beamish (ed.). Climate Change and Northern Fish Populations, pp. 131–136. Canadian Special Publication in Fisheries and Aquatic Science 121.
- ^Hunt, G.L., P. Stabeno, G.Walters, E. Sinclair, R.D. Brodeur, J.M. Napp and N.A. Bond, 2002. Climate change and control of the southeastern Bering Sea pelagic ecosystem. Deep Sea Research II, 49(26):5821–5853.
- ^Hunt, G.L., P. Stabeno, G.Walters, E. Sinclair, R.D. Brodeur, J.M. Napp and N.A. Bond, 2002. Climate change and control of the southeastern Bering Sea pelagic ecosystem. Deep Sea Research II, 49(26):5821–5853.
- ^Brodeur, R.D., M.T.Wilson, G.E.Walters and I.V. Melnikov, 1999. Forage fishes in the Bering Sea: distribution, species associations, and biomass trends. In:T. Loughlin and K. Ohtani (eds.). Dynamics of the Bering Sea, pp. 509–536. University of Alaska Fairbanks.-- Wyllie-Echeverria,T. and K. Ohtani, 1999. Seasonal sea ice variability and the Bering Sea ecosystem. In:T.R. Loughlin and K. Ohtani (eds.). Dynamics of the Bering Sea. Alaska Sea Grant College Program. AK-SG-99-03. pp. 435–451.
- ^Naumenko, N.I., P.A. Balykin, E.A. Naumenko and E.R. Shaginyan, 1990. Long-term changes in pelagic fish community in the western Bering Sea.TINRO Transactions, 111:49–57. (In Russian)
- ^Williams, E.H. and T.J. Quinn II, 2000. Pacific herring, Clupea pallasi, recruitment in the Bering Sea and north-east Pacific Ocean, II: relationships to environmental variables and implications for forecasting. Fisheries Oceanography, 9(4):300–315.
- ^Zebdi, A. and J.S. Collie, 1995. Effect of climate on herring (Clupea pallasi) population dynamics in the Northeast Pacific Ocean. In: R.J. Beamish (ed.). Climate Change and Northern Fish Populations. Canadian Special Publication of Fisheries and Aquatic Sciences 121: 277–290.
- ^Naumenko, N.I., 2001. Biology and fisheries on marine herring of the far-eastern seas. Kamchatsky Publishers. 330p. (In Russian)
- ^Naumenko, N.I., 2001. Biology and fisheries on marine herring of the far-eastern seas. Kamchatsky Publishers. 330p. (In Russian)
- ^Brodeur, R.D., M.T.Wilson, G.E.Walters and I.V. Melnikov, 1999. Forage fishes in the Bering Sea: distribution, species associations, and biomass trends. In:T. Loughlin and K. Ohtani (eds.). Dynamics of the Bering Sea, pp. 509–536. University of Alaska Fairbanks.
- ^Nishiyama,T., K. Hirano and T. Haryu, 1986.The early life history and feeding habits of larval walleye pollock in the southeast Bering Sea. Bulletin of the International North Pacific Fisheries Commission, 45:177–227.
- ^Bailey, K.M., R.C. Francis and J.D. Schumacher, 1986. Recent information on the causes of variability in recruitment of Alaska pollock in the eastern Bering Sea: physical conditions and biological interactions. Bulletin of the International North Pacific Fisheries Commission, 47:155–165.-- Nishiyama,T., K. Hirano and T. Haryu, 1986.The early life history and feeding habits of larval walleye pollock in the southeast Bering Sea. Bulletin of the International North Pacific Fisheries Commission, 45:177–227.-- Shuntov,V.P., A.F.Volkov, O.S.Temnykh and E.P. Dulepova, 1993. Walleye pollock in the far-eastern seas ecosystems.TINRO, 426p. (In Russian)
- ^ Wyllie-Echeverria,T. and K. Ohtani, 1999. Seasonal sea ice variability and the Bering Sea ecosystem. In:T.R. Loughlin and K. Ohtani (eds.). Dynamics of the Bering Sea. Alaska Sea Grant College Program. AK-SG-99-03. pp. 435–451.
- ^Aydin, K.Y.,V.V. Lapko,V.I. Radchenko and P.A. Livingston, 2002. A comparison of the eastern Bering and western Bering Sea shelf and slope ecosystems through the use of mass-balance food web models. NOAA Technical Memorandum, NMFS-AFSC-130. 78p.
- ^Bulatov, O.A., 1995. Biomass variation of walleye pollock of the Bering Sea in relation to oceanological conditions. In: R.J. Beamish (ed.). Climate Change and Northern Fish Populations, pp. 631–640. Canadian Special Publication of Fisheries and Aquatic Sciences, 121.
- ^ Decker, M.B., G.L. Hunt Jr. and G.V. Byrd Jr., 1995.The relationships among sea surface temperature, the abundance of juvenile walleye pollock, and the reproductive performance and diets of seabirds at the Pribilof Islands, southeastern Bering Sea. In: R.J. Beamish (ed.). Climate Change and Northern Fish Populations, pp. 425–437. Canadian Special Publication of Fisheries and Aquatic Sciences 121-- Quinn,T.J. II and H.J. Niebauer, 1995. Relation of eastern Bering Sea walleye pollock (Theragra chalcogramma) recruitment to environmental and oceanographic variables. In: R.J. Beamish (ed.). Climate Change and Northern Fish Populations, pp. 497–507. Canadian Special Publication of Fisheries and Aquatic Sciences 121.
- ^Ohtani, K. and T. Azumaya, 1995. Influence of interannual changes in ocean conditions on the abundance of walleye pollock in the eastern Bering Sea. In: R.J. Beamish (ed.). Climate Change and Northern Fish Populations, pp. 87–95. Canadian Special Publication of Fisheries and Aquatic Sciences 121.
- ^Wespestad,V.G., L.W. Fritz,W. Ingraham and B.A. Megrey, 2000. On relationships between cannibalism, climate variability, physical transport, and recruitment success of Bering Sea walleye pollock (Theragra chalcogramma). ICES Journal of Marine Science, 57(2):272–278.
- ^Haynes, E.G. and G. Ingell, 1983. Effect of temperature on rate of embryonic development of walleye pollock (Theragra chalcogramma). Fishery Bulletin, 81:890–894.
- ^Stepanenko, M.A., 2001.The state of stock, interannual variability of recruitment, and fisheries of the eastern Bering Sea pollock in 1980s – 1990s.TINRO Transactions, 128:145–152. (In Russian)
- ^Hollowed, A.B., S.R. Hare and W.S.Wooster, 2001. Pacific Basin climate variability and patterns of Northeast Pacific marine fish production. Progress in Oceanography, 49:257–282.
- ^Hollowed, A.B. and W.S.Wooster, 1995. Decadal-scale variations in the eastern subarctic Pacific: II. Response of Northeast Pacific fish stocks. In: R.J. Beamish (ed.). Climate Change and Northern Fish Populations, pp. 373–385. Canadian Journal of Fisheries and Aquatic Sciences 121.-- Hollowed, A.B., S.R. Hare and W.S.Wooster, 2001. Pacific Basin climate variability and patterns of Northeast Pacific marine fish production. Progress in Oceanography, 49:257–282.
- ^Conners, M.E., A.B. Hollowed and E. Brown, 2002. Retrospective analysis of Bering Sea bottom trawl surveys: regime shift and ecosystem reorganization. Progress in Oceanography, 55:209–222.
- ^Gavrilov, G.M. and I.I. Glebov, 2002.The composition of demersal ichthyocenosis in the western part of Bering Sea in November, 2002. TINROTransactions, 130:1027–1037. (In Russian)
- ^Wilderbuer,T.K., A.B. Hollowed,W.J. Ingraham, P.D. Spencer, M.W. Conners, N.A. Bond and G.E.Walters, 2002. Flatfish recruitment response to decadal climate variability and ocean conditions in the eastern Bering Sea. Progress in Oceanography, 55(1–2):235–248.
- ^Wilderbuer,T.K. and D.G. Nichol, 2001.Yellowfin sole. In: Stock Assessment and Fishery Evaluation Report for the Groundfish Resources of the Bering Sea/Aleutian Islands. Chapter 3. North Pacific Fisheries Management Council.
- ^Somerton, D.A. and P. Munro, 2001. Bridle efficiency of a survey trawl for flatfish. Fishery Bulletin, 99:641–652.
- ^Sogard, S.M. and B.L. Olla, 1998. Contrasting behavioral responses to cold temperatures by two marine fish species during their pelagic juvenile interval. Environmental Biology of Fishes, 53:405–412.
- ^Hare, S.R. and R.C. Francis, 1995. Climate change and salmon production in the northeast Pacific Ocean. In: R.J. Beamish (ed.). Climate Change and Northern Fish Populations, pp. 357–372. Canadian Special Publication of Fisheries and Aquatic Sciences 121.
- ^Welch, D.W., A.I. Chigirinsky and Y. Ishida, 1995. Upper thermal limits on the oceanic distribution of Pacific salmon in the spring. Canadian Journal of Fisheries and Aquatic Sciences, 52:489–503.
- ^Rosenkranz, G.E., A.V.Tyler and G.H. Kruse, 2001. Effects of water temperature and wind on year-class success of Tanner crabs in Bristol Bay, Alaska. Fisheries Oceanography, 10(1):1–12.
- ^Incze L.E., D.A. Armstrong and S.L. Smith, 1987. Abundance of larval Tanner crabs (Chionoecetes spp.) in relation to adult females and regional oceanography of the southeastern Bering Sea. Canadian Journal of Fisheries and Aquatic Sciences, 44:1143–1156.
- ^Zheng, J. and G.H. Kruse, 2000. Recruitment patterns of Alaska crabs in relation to decadal shifts in climate and physical oceanography. ICES Journal of Marine Science, 57:438–451.
- ^Schumacher, J.D., 2000. Regime shift theory: A review of changing environmental conditions in the Bering Sea and the Eastern North Pacific. In: S. Connover (ed.). Proceedings of the Fifth North Pacific Rim Fisheries Conference, pp. 127–142. Cooperation, coordination and communication, AK: Pacific Rim Fisheries Program, Institute of the North, Alaska Pacific University.
- ^Ikeda, M., 1990. Decadal oscillations of the air–ice–sea system in the northern hemisphere. Atmosphere-Ocean, 28:106–139.
- ^Van Loon, H. and D.J. Shea, 1999. A probable signal of the 11-year solar cycle in the troposphere of the northern hemisphere. Geophysical Research Letters, 26:2893–2896.
- ^Minobe, S, 1999. Resonance in bidecadal and pentadecadal climate oscillations over the North Pacific: Role in climate regime shifts. Geophysical Research Letters, 26(7):853–858.
- ^Shuntov,V.P., 2001. Biology of far-eastern seas of Russia.TINROCenter. V.1. 580p. (In Russian)
- ^Hunt, G.L., P. Stabeno, G.Walters, E. Sinclair, R.D. Brodeur, J.M. Napp and N.A. Bond, 2002. Climate change and control of the southeastern Bering Sea pelagic ecosystem. Deep Sea Research II, 49(26):5821–5853.
- ^Huisman, J. and B. Sommeijer, 2002. Maximal sustainable sinking velocity of phytoplankton. Marine Ecology Progress Series, 244:39–48.
- ^Plotnikov,V.V., 1996.Variability of ice conditions of the far-eastern (the Bering, Okhotsk and Japan) seas and their forecast. Ph.D. thesis. Vladivostok: POI DVO of Russian Academy of Sciences. In Russian-- Plotnikov,V.V. and G.I.Yurasov, 1994. Seasonal and interannual variability of ice cover in the North Pacific marginal seas, pp. 13–24. PICES-STA workshop on monitoring subarct. Pacific Ocean, Nemuro, Japan.-- Ustinova, E.I. and Yu.I. Sorokin, 1999. Some regularities of climate variability of the far-eastern seas, pp. 50–51. Proc. of 11th all Russian conference on fish. Oceanogr. Moscow:VNIRO. In Russian
- ^Niebauer, H.J., N.A. Bond, L.P.Yakunin and V.V. Plotnikov, 1999. An update on the climatology and sea ice of the Bering Sea. In:T.R. Loughlin and K. Ohtani (eds.). Dynamics of the Bering Sea, pp. 29–59. Alaska Sea Grant College Program. AK-SG-99-03.
- ^Shuntov,V.P., E.P. Dulepova and I.V.Volvenko, 2002. Up-to-date status and long-term dynamics of biological resources in the Far Eastern economic zone of Russia.TINRO Transactions, 130:3–11. In Russian-- Shuntov,V.P., L.N. Bocharov, E.P. Dulepova, A.F.Volkov, O.S. Temnykh, I.V.Volvenko, I.V. Melnikov and V.A. Nadtochy, 2003. Results of monitoring and ecosystem research of biological resources of the Far East seas of Russia.TINRO Transactions, 132:3–26. In Russian-- Ustinova, E.I. and Yu.I. Sorokin, 1999. Some regularities of climate variability of the far-eastern seas, pp. 50–51. Proc. of 11th all Russian conference on fish. Oceanogr. Moscow:VNIRO. In Russian
- ^Cushing, D.H., 1969. The fluctuation of year-classes and the regulation of fisheries. Fiskeridirektoratets skrifter, 15:368–379.
- ^Clark,W.G. and S.R. Hare, 2002. Effects of climate and stock size on recruitment and growth of Pacific halibut. North American Journal of Fisheries Management, 22:852–862.
- ^Strickland, R.M. and T. Sibley, 1984. Projected Effects of CO2 Induced Climate Change on the Alaska Walleye Pollock (Theragra chalcogramma) Fishery in the Eastern Bering Sea and the Gulf of Alaska. University of Washington, FRI-UW-8411. 112p.
- ^Shuntov,V.P., A.F.Volkov, O.S.Temnykh and E.P. Dulepova, 1993. Walleye pollock in the far-eastern seas ecosystems.TINRO, 426p. (In Russian)
- ^Nishiyama,T., K. Hirano and T. Haryu, 1986.The early life history and feeding habits of larval walleye pollock in the southeast Bering Sea. Bulletin of the International North Pacific Fisheries Commission, 45:177–227.
- ^Bakkala, R.G., 1993. Structure and Historical changes in the groundfish complex of the eastern Bering Sea. NOAA Tech. Rep NMFS 114. 91p.
- ^Naumenko, N.I., 2001. Biology and fisheries on marine herring of the far-eastern seas. Kamchatsky Publishers. 330p. (In Russian)
- ^Wespestad,V.G., 1987. Population dynamics of Pacific herring (Clupea pallasii), capelin (Mallotus villosus) and other coastal pelagic fishes in the eastern Bering Sea. In: Forage fishes of the Southeastern Bering Sea. US Dep. Int., Min. Mgt. Serv., Alaska OCS Region, MMS87- 0017:55–60.
- ^Hollowed, A.B., S.R. Hare and W.S.Wooster, 2001. Pacific Basin climate variability and patterns of Northeast Pacific marine fish production. Progress in Oceanography, 49:257–282.
- ^ Sinclair E.H., A.A. Balanov,T. Kubodera,V.I. Radchenko and Yu. A. Fedorets, 1999. Distribution and ecology of mesopelagic fishes and cephalopods. In:T.R. Loughlin and K. Ohtani (eds.). Dynamics of the Bering Sea, pp. 485–508. Fairbanks: Alaska Sea Grant College Program.
- ^Wespestad,V.G., 1987. Population dynamics of Pacific herring (Clupea pallasii), capelin (Mallotus villosus) and other coastal pelagic fishes in the eastern Bering Sea. In: Forage fishes of the Southeastern Bering Sea. US Dep. Int., Min. Mgt. Serv., Alaska OCS Region, MMS87- 0017:55–60.
- ^Wyllie-Echeverria,T., 1995. Sea-ice conditions and the distribution of walleye pollock (Theragra chalcogramma) on the Bering and Chukchi Shelf. In: R.J. Beamish (ed.). Climate Change and Northern Fish Populations, pp. 131–136. Canadian Special Publication in Fisheries and Aquatic Science 121.
- ^Clark,W.G., S.R. Hare, A.M. Parma, P.J. Sullivan and R.J.Trumble, 1999. Decadal changes in growth and recruitment of Pacific halibut (Hippoglossus stenolepis). Canadian Journal of Fisheries and Aquatic Sciences, 56:242–252.
- ^Livingston, P.A., L-L. Low and R.J. Marasco, 1999. Eastern Bering Sea ecosystem trends. In:Tang, Q. and K. Sherman (eds.). Large Marine Ecosystems of the Pacific Rim – Assessment, Sustainability, and Management, pp. 140–162. Blackwell Science.
- ^Wilderbuer,T.K., A.B. Hollowed,W.J. Ingraham, P.D. Spencer, M.W. Conners, N.A. Bond and G.E.Walters, 2002. Flatfish recruitment response to decadal climate variability and ocean conditions in the eastern Bering Sea. Progress in Oceanography, 55(1–2):235–248.
- ^Wilderbuer,T.K., A.B. Hollowed,W.J. Ingraham, P.D. Spencer, M.W. Conners, N.A. Bond and G.E.Walters, 2002. Flatfish recruitment response to decadal climate variability and ocean conditions in the eastern Bering Sea. Progress in Oceanography, 55(1–2):235–248.
- ^Borets, L.A., 1997. Bottom ichthyocoenoses of the Russian shelf of the far-eastern seas: composition, structure, functioning elements, and commercial significance.TINRO-Center. 217 p. (In Russian)
- ^Borets, L.A., 1997. Bottom ichthyocoenoses of the Russian shelf of the far-eastern seas: composition, structure, functioning elements, and commercial significance.TINRO-Center. 217 p. (In Russian)
- ^Shuntov,V.P.,V.V. Lapko,V.V. Nadtochiy and E.V. Samko, 1994. Interannual changes in fish communities in upper epipelagic layer in the western Bering Sea and Pacific waters off Kamchatka. Journal of Ichthyology, 34(5):642–648. (In Russian)
- ^Radchenko V.I., 1994. Composition, structure and dynamics of the epipelagic nekton communities. MSc. Thesis. Vladivostok. 24p. (in Russian)
- ^Rosenkranz, G.E., A.V.Tyler and G.H. Kruse, 2001. Effects of water temperature and wind on year-class success of Tanner crabs in Bristol Bay, Alaska. Fisheries Oceanography, 10(1):1–12.
- ^Haflinger, K.E. and C.P. McRoy, 1983. Final Report:Yellowfin sole (Limanda aspera) predation on three commercial crab species (Chionoecetes opilio, C. Bairdi, and Paralithodes camtschatica) in the southeastern Bering Sea. National Marine Fisheries Service Final Report, Contract #82-ABC-00202.
- ^Ivanov, B.G., 2001. Studies and fisheries of pandalid shrimps (Crustacea, Decapoda, Pandalidae) in the Northern Hemisphere: A review in the XXI century eve (with special reference to Russia), pp. 9–31. In: Ivanov, B.G. (ed.). Study of biology of commercial crustaceans and algae of Russian seas. (In Russian)
- ^Conners, M.E., A.B. Hollowed and E. Brown, 2002. Retrospective analysis of Bering Sea bottom trawl surveys: regime shift and ecosystem reorganization. Progress in Oceanography, 55:209–222.
- ^Livingston, P.A., L-L. Low and R.J. Marasco, 1999. Eastern Bering Sea ecosystem trends. In:Tang, Q. and K. Sherman (eds.). Large Marine Ecosystems of the Pacific Rim – Assessment, Sustainability, and Management, pp. 140–162. Blackwell Science.
- ^Brodeur, R.D., M.T.Wilson, G.E.Walters and I.V. Melnikov, 1999. Forage fishes in the Bering Sea: distribution, species associations, and biomass trends. In:T. Loughlin and K. Ohtani (eds.). Dynamics of the Bering Sea, pp. 509–536. University of Alaska Fairbanks.
- ^Shuntov,V.P., 2001. Biology of far-eastern seas of Russia.TINROCenter. V.1. 580p. (In Russian)
- ^Shuntov,V.P., 2001. Biology of far-eastern seas of Russia.TINROCenter. V.1. 580p. (In Russian)
- ^Shuntov,V.P., 2001. Biology of far-eastern seas of Russia.TINROCenter. V.1. 580p. (In Russian)
- ^Livingston, P.A., L-L. Low and R.J. Marasco, 1999. Eastern Bering Sea ecosystem trends. In:Tang, Q. and K. Sherman (eds.). Large Marine Ecosystems of the Pacific Rim – Assessment, Sustainability, and Management, pp. 140–162. Blackwell Science.
- ^Radchenko,V.I., 1992.The role of squids in the Bering Sea pelagic ecosystem. Oceanology, 32(6): 1093–1101. (In Russian)
- ^Naumenko, N.I., 2001. Biology and fisheries on marine herring of the far-eastern seas. Kamchatsky Publishers. 330p. (In Russian)
- ^Fadeev, N.S. and V.Wespestad, 2001. Review of walleye pollock fishery. TINRO Transactions, 128:75–91. (In Russian)
- ^Shuntov,V.P.,V.I. Radchenko, E.P. Dulepova and O.S.Temnykh, 1997. Biological resources of the Far Eastern Russian economic zone: structure of pelagic and bottom communities, up-to-date status, tendencies of long-term dynamics.TINRO Transactions, 122:3–15. (In Russian)
- ^Stepanenko, M.A., 2001.The state of stock, interannual variability of recruitment, and fisheries of the eastern Bering Sea pollock in 1980s – 1990s.TINRO Transactions, 128:145–152. (In Russian)
- ^Wespestad,V.G., 1993.The status of the Bering Sea pollock and the effect of ‘donut hole’ fishery. Fisheries, 18(3):18–24.
- ^Chuchukalo,V.I.,V.I. Radchenko,V.A. Nadtochii,V.N. Koblikov, A.M. Slabinskii and D.A.Terent’ev, 1999. Feeding and some features of ecology of Gadidae of the western Kamchatka shelf in summer 1996. Journal of Ichthyology, 39(4):309–321. (Translated from Voprosy Ikhthiologii, 1999, 39(3):362–374)
- ^National Research Council, 1996.The Bering Sea Ecosystem. Committee on the Bering Sea Ecosystem, Polar Research Board, Commission on Geosciences, Environment and Resources. National Academy Press.
- ^Chigirinsky, A.I., 1994. Commercial fishing of Pacific salmon in the Bering Sea.TINRO Transactions, 116:142–151. (In Russian)
- ^Frost, O., 2003. Bering:The Russian Discovery of America.Yale University Press, 330p.-- Ray, G.C. and J. McCormick-Ray, 2004. Coastal Marine Conservation: Science and Policy. Blackwell.
- ^Cobb, J.N., 1927. Pacific cod fisheries. US Bureau of Fisheries, Document 1014, Appendix VII to the Report of the US Commissioner of Fisheries for 1926. US Government Printing Office.
- ^Ray, G.C. and J. McCormick-Ray, 2004. Coastal Marine Conservation: Science and Policy. Blackwell.
- ^Netboy, A., 1974. The salmon: their fight for survival. Houghton Mifflin, Boston.
- ^Miles, E., S. Gibbs, D. Fluharty, C. Dawson and D.Teeter, 1982a. The Management of Marine Regions:The North Pacific. California University Press, 656p.-- Miles, E., J.Sherman, D. Fluharty and S. Gibbs, 1982b. Atlas of Marine Use:The North Pacific. California University Press, 121p.
- ^Pereyra,W.T., J.E. Reeves and R.A. Bakala, 1976. Demersal Fish and Shellfish Resources of the Eastern Bering Sea in the Baseline Year 1975. Northwest Fisheries Center, National Marine Fisheries Service. Seattle.
- ^Dunlop, H.A., Bell, F.H., Myhre, R.J., Hardman,W.H., and Southward, G.M. 1964. Investigation, Utilization and Regulation of Halibut in Southeastern Bering Sea. International Pacific Halibut Commission Report 35. Seattle,Washington: International Pacific Halibut Commission.
- ^National Research Council, 1996.The Bering Sea Ecosystem. Committee on the Bering Sea Ecosystem, Polar Research Board, Commission on Geosciences, Environment and Resources. National Academy Press.
- ^Zilanov,V.K., L.I. Shepel, A.N.Vylegjanin, M.A. Stepanenko,T.I. Spivakova and N.V.Yanovskaya, 1989. International problems of conservation and exploitation of Bering sea living resources.World Fisheries, 1:1–102. (In Russian)
- ^Alverson, D.L., A.T. Pruter and L.L. Ronholt, 1964. A study of demersal fishes and fisheries of the northeastern Pacific Ocean. H.R. MacMillan Lectures in Fisheries. Institute of Fisheries, University of British Columbia.
- ^Alverson, D.L., A.T. Pruter and L.L. Ronholt, 1964. A study of demersal fishes and fisheries of the northeastern Pacific Ocean. H.R. MacMillan Lectures in Fisheries. Institute of Fisheries, University of British Columbia.
- ^Fadeev, N.S. and V.Wespestad, 2001. Review of walleye pollock fishery. TINRO Transactions, 128:75–91. (In Russian)
- ^NMFS, 2003a. Fisheries of the United States, 2002. National Marine Fisheries Service,Washington, D.C.
- ^Hiatt,T., R. Felthoven and J.Terry, 2002. Stock assessment and fishery evaluation report for the groundfish fisheries of the Gulf of Alaska and Bering Sea/Aleutian Island Areas. Appendix D economic status of the groundfish fisheries of Alaska, 2001. Alaska Fisheries Science Center, National Marine Fisheries Service, National Oceanic and Atmospheric Administration, Seattle, 119p.
- ^Conover, S., 1999.The 1997/98 Directory of Russian Far East Fishing Companies. Alaska Center for International Business, Anchorage, 99p.-- Zilanov,V.K., 1999. Marine living resources of the Russian Far East in the time of change: impacts of population, markets, reforms, and climate. In: V.M. Kaczynski and D.L. Fluharty (eds.). Impacts of Populations and Markets on the Sustainability of Ocean and Coastal Resources: Perspectives of Developing and Transition Economies of the North Pacific, pp. 97–111. Collection of Papers from the International Conference June 3–4, 1999. School of Marine Affairs. University of Washington. 277p.
- ^Hiatt,T., R. Felthoven and J.Terry, 2002. Stock assessment and fishery evaluation report for the groundfish fisheries of the Gulf of Alaska and Bering Sea/Aleutian Island Areas. Appendix D economic status of the groundfish fisheries of Alaska, 2001. Alaska Fisheries Science Center, National Marine Fisheries Service, National Oceanic and Atmospheric Administration, Seattle, 119p.
- ^Link, M.R., M.L. Hartley, S.A. Miller, B.Waldrop, J.Wilen and J. Barnett. 2003. An analysis of options to restructure the Bristol Bay salmon fishery. Prepared for Bristol Bay Economic Development Corporation and the Joint Legislative Salmon Industry Task Force, Anchorage. 104p.
- ^NPFMC, 2003a. Discussion paper on Western Alaska Community Development Quota (CDQ) Program. North Pacific Fishery Management Council, Alaska.
- ^Pautzke, C., 1997. Russian Far East Fisheries Management – North Pacific Fishery Management Council Report to Congress. Anchorage, 68p.
- ^Pacific Rim Fisheries Update, May 2002
- ^Velegjanin, A.N., 1999. International legal aspects of the Russian Far East seafood trade with the North Pacific Rim Countries. In: V.M. Kaczynski and D.L. Fluharty (eds.). Impacts of Populations and Markets on the Sustainability of Ocean and Coastal Resources: Perspectives of Developing and Transition Economies of the North Pacific, pp 189–198. Collection of papers from the International Conference June 3–4, 1999. School of Marine Affairs, University of Washington.
- ^Hiatt,T., R. Felthoven and J.Terry, 2002. Stock assessment and fishery evaluation report for the groundfish fisheries of the Gulf of Alaska and Bering Sea/Aleutian Island Areas. Appendix D economic status of the groundfish fisheries of Alaska, 2001. Alaska Fisheries Science Center, National Marine Fisheries Service, National Oceanic and Atmospheric Administration, Seattle, 119p.
- ^Natural Resources Consultants, 1999. Status of Washington-based commercial fisheries and the fleets’ future utilization of Fishermen’s Terminal. Port of Seattle, Seattle. 195p.
- ^NMFS, 2003b. Alaska Groundfish Fisheries: Draft Programmatic Supplemental Environmental Impact Statement.Vol.V. App. A, 484p. National Marine Fisheries Service.
- ^Natural Resources Consultants, 1999. Status of Washington-based commercial fisheries and the fleets’ future utilization of Fishermen’s Terminal. Port of Seattle, Seattle. 195p.
- ^Zilanov, V.K., 1999. Marine living resources of the Russian Far East in the time of change: impacts of population, markets, reforms, and climate. In: V.M. Kaczynski and D.L. Fluharty (eds.). Impacts of Populations and Markets on the Sustainability of Ocean and Coastal Resources: Perspectives of Developing and Transition Economies of the North Pacific, pp. 97–111. Collection of Papers from the International Conference June 3–4, 1999. School of Marine Affairs. University of Washington. 277p.
- ^Zilanov, V.K., 1999. Marine living resources of the Russian Far East in the time of change: impacts of population, markets, reforms, and climate. In: V.M. Kaczynski and D.L. Fluharty (eds.). Impacts of Populations and Markets on the Sustainability of Ocean and Coastal Resources: Perspectives of Developing and Transition Economies of the North Pacific, pp. 97–111. Collection of Papers from the International Conference June 3–4, 1999. School of Marine Affairs. University of Washington. 277p.
- ^ NMFS, 2003b. Alaska Groundfish Fisheries: Draft Programmatic Supplemental Environmental Impact Statement.Vol.V. App. A, 484p. National Marine Fisheries Service.
- ^ NMFS, 2003b. Alaska Groundfish Fisheries: Draft Programmatic Supplemental Environmental Impact Statement.Vol.V. App. A, 484p. National Marine Fisheries Service.
- ^Velegjanin, A.N., 1999. International legal aspects of the Russian Far East seafood trade with the North Pacific Rim Countries. In: V.M. Kaczynski and D.L. Fluharty (eds.). Impacts of Populations and Markets on the Sustainability of Ocean and Coastal Resources: Perspectives of Developing and Transition Economies of the North Pacific, pp 189–198. Collection of papers from the International Conference June 3–4, 1999. School of Marine Affairs, University of Washington.
- ^NPFMC, 2003a. Discussion paper on Western Alaska Community Development Quota (CDQ) Program. North Pacific Fishery Management Council, Alaska.
- ^Natural Resources Consultants, 1999. Status of Washington-based commercial fisheries and the fleets’ future utilization of Fishermen’s Terminal. Port of Seattle, Seattle. 195p.
- ^Zilanov, V.K., 1999. Marine living resources of the Russian Far East in the time of change: impacts of population, markets, reforms, and climate. In: V.M. Kaczynski and D.L. Fluharty (eds.). Impacts of Populations and Markets on the Sustainability of Ocean and Coastal Resources: Perspectives of Developing and Transition Economies of the North Pacific, pp. 97–111. Collection of Papers from the International Conference June 3–4, 1999. School of Marine Affairs. University of Washington. 277p.
- ^Zilanov, V.K., 1999. Marine living resources of the Russian Far East in the time of change: impacts of population, markets, reforms, and climate. In: V.M. Kaczynski and D.L. Fluharty (eds.). Impacts of Populations and Markets on the Sustainability of Ocean and Coastal Resources: Perspectives of Developing and Transition Economies of the North Pacific, pp. 97–111. Collection of Papers from the International Conference June 3–4, 1999. School of Marine Affairs. University of Washington. 277p.
- ^Link, M.R., M.L. Hartley, S.A. Miller, B.Waldrop, J.Wilen and J. Barnett. 2003. An analysis of options to restructure the Bristol Bay salmon fishery. Prepared for Bristol Bay Economic Development Corporation and the Joint Legislative Salmon Industry Task Force, Anchorage. 104p.
- ^Miles, E., S. Gibbs, D. Fluharty, C. Dawson and D.Teeter, 1982a. The Management of Marine Regions:The North Pacific. California University Press, 656p.
- ^NMFS, 2003b. Alaska Groundfish Fisheries: Draft Programmatic Supplemental Environmental Impact Statement.Vol.V. App. A, 484p. National Marine Fisheries Service.
- ^e.g.: NPFMC, 2002. Stock Assessment Fishery Evaluation. North Pacific Fishery Management Council, Anchorage.
- ^Witherell, D., C. Pautzke and D. Fluharty, 2000. An ecosystem-based approach for Alaska groundfish management. ICES Journal of Marine Science, 57:771–777.
- ^NPFMC, 2003b. Preliminary draft Environmental Impact Statement for Essential Fish Habitat identification and conservation in Alaska. North Pacific Fishery Management Council Anchorage.Vol. I,II.
- ^Velegjanin, A.N., 1999. International legal aspects of the Russian Far East seafood trade with the North Pacific Rim Countries. In: V.M. Kaczynski and D.L. Fluharty (eds.). Impacts of Populations and Markets on the Sustainability of Ocean and Coastal Resources: Perspectives of Developing and Transition Economies of the North Pacific, pp 189–198. Collection of papers from the International Conference June 3–4, 1999. School of Marine Affairs, University of Washington.
- ^ Miles, E., S. Gibbs, D. Fluharty, C. Dawson and D.Teeter, 1982a. The Management of Marine Regions: The North Pacific. California University Press, 656p.
- ^National Research Council, 1996.The Bering Sea Ecosystem. Committee on the Bering Sea Ecosystem, Polar Research Board, Commission on Geosciences, Environment and Resources. National Academy Press.
- ^National Research Council, 2003. Decline of the Steller Sea Lion in Alaskan Waters: Untangling Food Webs and Fishing Nets. National Academies Press.
- ^NMFS, 2003b. Alaska Groundfish Fisheries: Draft Programmatic Supplemental Environmental Impact Statement.Vol.V. App. A, 484p. National Marine Fisheries Service.
- ^National Research Council, 2003. Decline of the Steller Sea Lion in Alaskan Waters: Untangling Food Webs and Fishing Nets. National Academies Press.
- ^Beamish, R.J. and D.R. Bouillon, 1993. Pacific salmon production trends in relation to climate. Canadian Journal of Fisheries and Aquatic Sciences, 50(5):1002–1016.-- Hare, S.R. and R.C. Francis, 1995. Climate change and salmon production in the northeast Pacific Ocean. In: R.J. Beamish (ed.). Climate Change and Northern Fish Populations, pp. 357–372. Canadian Special Publication of Fisheries and Aquatic Sciences 121.-- Mantua, N.J., S.R. Hare,Y. Zhang, J.M.Wallace and R.C. Francis, 1997. A Pacific interdecadal climate oscillation with impacts on salmon production. Bulletin of the American Meteorological Society, 78(6):1069–1080.
- ^Kocan, R., P. Hershberger and J.Winton, 2001. Effects of Ichthyophonus on survival and reproductive success of Yukon River Chinook salmon: Final Report for Study 01-200 for the US Fish and Wildlife Service, Subsistence Management, Fisheries Resource Monitoring Program. University of Washington, Seattle.
- ^Link, M.R., M.L. Hartley, S.A. Miller, B.Waldrop, J.Wilen and J. Barnett. 2003. An analysis of options to restructure the Bristol Bay salmon fishery. Prepared for Bristol Bay Economic Development Corporation and the Joint Legislative Salmon Industry Task Force, Anchorage. 104p.
Citation
Committee, I. (2012). Fisheries and aquaculture in the North Pacific (Bering Sea). Retrieved from http://editors.eol.org/eoearth/wiki/Fisheries_and_aquaculture_in_the_North_Pacific_(Bering_Sea)- ↑ Ikeda, M., 1990. Decadal oscillations of the air–ice–sea system in the northern hemisphere. Atmosphere-Ocean, 28:106–139.-- Khen, G.V., 1997. Main regularities of multi-year changes in ice cover of the Bering Sea and Sea of Okhotsk. Complex investigations of the Sea of Okhotsk Ecosystem. Moscow:VNIRO. pp. 64–67. (In Russian)-- Luchin,V.A., I.P. Semiletov and G.E.Weller, 2002. Changes in the Bering Sea region: atmosphere-ice-water system in the second half of the twentieth century. Progress in Oceanography, 55(1–2):23–44.-- Niebauer, H.J., N.A. Bond, L.P.Yakunin and V.V. Plotnikov, 1999. An update on the climatology and sea ice of the Bering Sea. In:T.R. Loughlin and K. Ohtani (eds.). Dynamics of the Bering Sea, pp. 29–59. Alaska Sea Grant College Program. AK-SG-99-03.-- Overland, J.E., 1990: Prediction of vessel icing at near-freezing sea temperatures. Weather and Forecasting, 5:62–77.