Ecosystems and Human Well-Being: Volume 1: Current State and Trends: Nutrient Cycling

This is Chapter 12 of the Millenium Ecosystem Assessment report Ecosystems and Human Well-Being: Volume 1: Current State and Trends
Coordinating Lead Authors: Patrick Lavelle, Richard Dugdale, Robert Scholes
Lead Authors: Asmeret Asefaw Berhe, Edward Carpenter, Lou Codispoti, Anne-Marie Izac, Jacques Lemoalle, Flavio Luizao, Mary Scholes, Paul Tréguer, Bess Ward
Review Editors: Jorge Etchevers, Holm Tiessen
Main Messages
An adequate and balanced supply of elements necessary for life, provided through the ecological processes of nutrient cycling, underpins all other ecosystem services. The cycles of several key elements—phosphorus, nitrogen, sulfur, carbon, and possibly iron and silicon—have been substantially altered by human activities over the past two centuries, with important positive and negative consequences for a range of other ecosystem services and for human well-being.
In preindustrial times, the annual flux of nitrogen from the atmosphere to the land and aquatic ecosystems was 90–130 teragrams (million tons) per year. This was more or less balanced by a reverse ‘‘denitrification’’ flux. Production and use of synthetic nitrogen fertilizer, expanded planting of nitrogen-fixing crops, and the deposition of nitrogen-containing air pollutants have together created an additional flux of about 200 teragrams a year, only part of which is denitrified. The resultant N accumulation on land and in waters has permitted a large increase in food production, but at the cost of increased emissions of greenhouse gases and a frequent deterioration in freshwater and coastal ecosystem services, including water quality, fisheries (Fisheries and aquaculture), and amenity value.
Phosphorus is also accumulating in ecosystems at a rate of 10.5–15.5 teragrams per year, which compares with the preindustrial rate of 1–6 teragrams of phosphorus a year, mainly as a result of the use of mined P in agriculture. Most of this accumulation is occurring in soils, which may then be eroded into freshwater systems, causing deterioration of ecosystem services. This tendency is likely to spread and worsen over the next decades, since large amounts of P have accumulated on land and their transport to water systems is slow and difficult to prevent.
Sulfur emissions have been progressively reduced in Europe and North America but not yet in the emerging industrial areas of the world: China, India, South Africa, and the southern parts of South America. A global assessment of acid deposition threats suggests that tropical ecosystems are at high risk. Human-induced alteration of the iron and silicon cycles is less well understood, but it is believed, with medium certainty, to be a significant factor in altering the productivity of the ocean. This may be a significant benefit to the service of carbon sequestration.
Human actions, many associated with agriculture, have increased the ‘‘leakiness’’ of ecosystems with respect to nutrients. Tillage often damages soil structure, and pesticides may decrease useful nontarget organisms, increasing nutrient leaching. Simplification of the landscape and destruction of riparian forests, wetlands, and estuaries allow unbuffered flows of nutrients between terrestrial and aquatic ecosystems. Specific forms of biodiversity are critical to the performance of the buffering mechanisms that ensure the efficient use and cycling of nutrients in ecosystems.
In contrast to the issues associated with nutrient oversupply, there remain large parts of Earth, notably in Africa and Latin America, where harvesting without nutrient replacement has led to a depletion of soil fertility, with serious consequences for human nutrition and the environment.
12.1 Introduction
Nutrients comprise the 22 or so chemical elements known to be essential for the growth of living organisms. (See Table 12.1.) The list varies somewhat because some elements are only needed in very specific groups of organisms or specific circumstances. This chapter deals mainly with nitrogen, sulfur, phosphorus, and carbon—all elements needed in relatively large quantities (the so-called macronutrients), and with cycles that have been substantially altered by human activities. Emerging issues related to iron and silicon will also be addressed.
|
Table 12.1. Major Elements Needed for Plant Growth and Their Concentrations in Plants, the Upper Meter of Soil, and Ocean Water (Fortescue 1980; Bohn et al. 1979) Content in Elemental Form (μg/g) Element Plant Soil Ocean Major Forms Biological Function/Source Macronutrients (>0.1% of dry mass) C 454,000 20,000 28 CO2 in organic molecules; photosynthesis/atm.CO2; OM O 410,000 490,000 857,000 O2 in organic molecules; cellular respiration/water; OM H 55,000 650 108,000 H2O in organic molecules/water; OM N 30,000 1,000 0.5 NO3– or NH4+ in proteins, nucleic acids, and chlorophyll/biol. fix of N2; OM mineralization; atm. deposition K 14,000 10,000 380 K+ principal positive ion inside cells; control of stomatal aperture; enzyme activity/OM mineralization; weathering P 2,300 800 0.07 H2PO4– or HPO42– in nucleic acids, phospholipids, and electron carriers in chloroplasts and mitochondria/OM mineralization; weathering Ca 18,000 10,000 400 Ca2+ in adhesive compounds in cell walls; control of membrane permeability; enzyme activation/weathering; OM mineralization Mg 3,200 6,000 1,350 Mg2+ component of chlorophyll; enzyme activation; ribosome stability/weathering; OM mineralization S 3,400 500 885 SO42- component of proteins and many coenzymes/OM mineralization; atm. deposition Cl 2,000 100 19,000 Cl- in photosynthesis/OM mineralization; atm. deposition Micronutrients (<0.2% of dry mass) Fe 140 40,000 0.01 Fe2+ or Fe3+ needed for synthesis of chlorophyll; component of many electron carriers Mn 630 800 0.002 Mn2+ in photosynthesis; enzyme activation Mo 0.05 3 3 MoO4-- in nitrogen metabolism, required for nitrogen fixation Cu 14 20 0.003 Cu2+ enzyme activation; component of electron carriers in chloroplasts Zn 100 50 0.01 Zn2+ enzyme activation; protein synthesis; hormone synthesis Bo 50 10 4.6 H2Bo3– involved in sugar transport Ni Ni2+ nitrogen metabolism cofactor Si 1,000 330,000 3 Si(OH)4 support tissues Co 0.5 8 0.0003 Co2+ required by N-fixing plants Na 1,200 7,000 10,500 Na+ beneficial to higher plants Se 0.05 0.01 H2Se03– beneficial to higher plants I 0.005 5 I- beneficial to higher plants Note: OM = Dead organic matter Broadly speaking, nutrients can occur in gaseous form (such as N2, CO2), mineral form (such as apatite, the main P-containing mineral), inorganic ionic form (NH4+, NO3-, SO42-, H2PO4-), and organic form (bound into various C-based compounds in living or dead organisms or their products). Nutrients are mostly taken up by plants in the ionic form and by animals in organic forms through consumption of living or dead tissues; microorganisms in general may use nutrients in any mineral or organic form, with sometimes high degrees of specialization at the guild or species level. The interconversion between forms is mediated by the ecosystem. Nutrient cycling describes the movement within and between the various biotic or abiotic entities in which nutrients occur in the global environment. These elements can be extracted from their mineral or atmospheric sources or recycled from their organic forms by converting them to the ionic form, enabling uptake to occur and ultimately returning them to the atmosphere or soil. Nutrient cycling is enabled by a great diversity of organisms and leads to creation of a number of physical structures and mechanisms that regulate the fluxes of nutrients among compartments. These structures and processes act as buffers to limit losses and transfers to other ecosystems (Ecosystems and Human Well-Being: Volume 1: Current State and Trends: Nutrient Cycling) , as described later. Nutrients are distributed among a large number of living or dead compartments, and their relative abundance among these compartments is typical of certain ecosystems. For example, this is the case in terrestrial ecosystems, where nutrients may be greatly concentrated in living biomass (such as tropical rainforests) or in humus and soil organic matter (such as tundra ecosystems) (Lavelle and Spain 2001). |
Fertility is the potential of the soil, sediment, or water system to supply nutrient elements in the quantity, form, and proportion required to support optimum plant growth (implicitly, in the context of ecosystem services, for human benefit). The largest flux of nutrients is their release from organic materials, as a result of decomposition by microbial communities. This flux may not be measurable, as part of it may be immediately reincorporated in microbial biomass. Microbial activity depends primarily on the availability of a food source and on regional and local climatic, edaphic, or hydrological factors. Locally, biological parameters such as the chemical composition of the organic material (which depends in turn on the plant community that produced it) and the soil invertebrates present act as proximate determinants.
The maintenance of fertility is a supporting service for the production of food, timber, fiber, and fuel. It is also necessary for ecological processes such as succession and for the persistence and stability of ecosystems. In systems intensively managed by humans, such as cultivated systems, the inherent fertility of ecosystems is supplemented through fertilization and management practices, such as the use of N-fixing plants, the acceleration of microbial processes by tillage, the addition of suitable organic inputs to the soil, and, in many parts of the world, biomass burning.
Fertilization is the input of nutrients to a system by humans, deliberately or as an unintended consequence of other activities. It includes supplements of N, P, S, potassium, calcium, Magnesium, and micronutrients for agriculture; atmospheric N and S deposition; and the effects of elevated CO2 in the atmosphere. Iron fertilization in the ocean has been performed experimentally (Coale et al. 1996; Moore et al. 2001).
It is possible to have an excessive supply of nutrients. In aquatic systems, this condition is known as eutrophication. Eutrophication, usually resulting from leaching of nutrients from soils managed for agriculture, is a form of nonvoluntary fertilization of inland and coastal waters. Increase in nutrients in sewage effluent is another form of cultural eutrophication related to increases in human population.
|
Table 12.2. Total Nutrient Balance in Africa (Henao 2002) Year (Average) Country 1981–85 1986–90 1991–95 1996–99 (NPK–kg/ha) Algeria 9.2 2.9 34.7 45.3 Angola -33.9 -27.9 -36.5 -50.1 Benin -55.7 -63.9 -57.9 -53.3 Botswana -6.8 -15.8 -11.8 1.9 Burkina Faso -46.6 -51.1 -56.2 -55.6 Burundi -65.4 -62.7 -93.0 -87.4 Cameroon -34.5 -44.5 -51.5 -54.2 Cape Verde -91.5 -52.8 -42.0 -41.7 Central Africa -54.3 -64.5 -62.3 -66.9 Chad -56.7 -59.0 -58.8 -62.6 Comoros -92.6 -87.5 -86.7 -89.3 Congo DR -61.3 -64.4 -63.8 -63.2 Congo PR -78.0 -80.5 -85.6 -76.5 Djibuti -104.6 -79.1 -99.5 -101.8 Egypt 19.0 7.9 -49.7 -54.0 Equatorial Guinea -63.9 -65.6 -68.8 -61.4 Eritrea -48.1 -51.3 Ethiopia -74.4 69.8 -62.7 -63.6 Gabon -47.0 -54.7 -64.4 -67.9 Kenya -72.7 -72.6 -74.3 -60.5 Lesotho -31.5 -41.4 -25.1 -52.1 Libya 71.6 69.2 101.8 29.6 Madagascar -65.4 -72.2 -73.2 -75.1 Malawi -71.5 -64.6 -62.3 -83.8 Morocco -36.9 -63.6 -49.5 -59.4 Mozambique -44.5 -43.1 -43.3 -61.6 Namibia -60.5 -69.8 -47.4 -52.0 Reunion 208.1 199.6 149.1 23.9 Rwanda -151.5 -136.3 -128.4 -123.8 Seychelles -98.7 -107.0 -68.1 -55.4 Somalia -78.7 -87.9 -61.9 -58.8 South Africa 27.0 -12.0 3.1 -18.6 Sudan -61.5 -57.7 -59.2 -58.3 Swaziland -78.4 -85.0 -89.2 -86.1 Tanzania -64.5 -55.6 -63.4 -66.2 Tunisia -13.6 -6.7 -23.2 -28.0 Uganda -70.8 -74.5 -76.9 -74.9 Zambia -16.0 -41.2 -21.7 -47.3 Zimbabwe -35.6 -51.4 -27.1 -45.8 |
Fertility can also be decreased by human activities, through soil erosion (Ecosystems and Human Well-Being: Volume 1: Current State and Trends: Nutrient Cycling) , nutrient mining (harvesting of nutrients at a rate in excess of their rate of replenishment), alteration of the soil biota or structure, salinization through poorly managed irrigation, acidification through inappropriate fertilization, deposition of acidifying pollutants, or excessive use of N-fixing crops.
Life on Earth is closely regulated by the efficient cycling and availability of nutrients. Human manipulation of this service has greatly affected all ecosystems. Climate regulation is affected by decomposition and nutrient cycling at regional or continental scales through the release of greenhouse gases and carbon sequestration in ecosystems. When nutrient cycling is impaired, the aesthetic and recreational value of freshwater (Freshwater biomes) and marine ecosystems may decrease significantly.
Nutrient cycling requires a large number of different organisms from diverse functional groups. It is a prime example of ‘‘functional biodiversity’’ in action. Conversely, dysfunctions in nutrient cycling, leading, for example, to eutrophication, have severe negative effects on biodiversity.
Nutrient cycling occurs everywhere, being a necessary part of the function of all ecosystems, but at widely varying rates. The specific ecosystem service of fertility is unevenly distributed around the land and oceans of the world. The most fertile soils— for instance, the deep, dark, loamy soils of the Eurasian steppes, the North American prairies and the South American pampas— have mostly been converted from grasslands to intensive agroecosystems over the past two centuries. Agriculture is currently expanding into areas with soils of inherently lower fertility, such as the old, red soils of tropical Africa, South America, and Southeast Asia (Wood et al. 2000).
The world’s oceans contain vast reservoirs of nutrients. However, these are found primarily at depths below about 200 meters, where there is insufficient light for (net) photosynthesis (Dugdale 1976). As a consequence, high levels of marine primary production require the uplifting of nutrients from deeper water into the euphotic zone (Summerhayes et al. 1995). Along the west coast of the continents, equator-ward trade winds drive surface water away from the coast to be replaced by water rich in nutrients from the sub-euphotic zone. These coastal upwelling systems constitute only about 1% of the ocean surface but contribute about 50% of the world’s fisheries (Fisheries and aquaculture) (Ryther 1969), due to not only high new production rates but also to a short food chain in which much of the phytoplankton production is eaten directly by fish. The central oceans and seas, especially in tropical regions, are generally low in nutrients and productivity.
Human activities have resulted in large-scale changes in nutrient cycles over the last two centuries, which have occurred at an accelerated rate since about 1950. Specifically, shifts in land use patterns, increased fertilization associated with high-yield crops, and lateral transfer of nutrients across ecosystem boundaries have dramatically changed the rate, pathways, and efficiency of nutrient cycling. Traditional small-scale, low-input cultivation practices generally lead to nutrient depletion when fallow periods are shortened. On the other hand, the sustainability of soil fertility under large-scale, high-input intensive agriculture is still in question, given that this form of agriculture is only a few decades old.
The increase in demand for food, fuel, and fiber during the last 50 years has led to supplementation of the natural nutrient supply in agroecosystems by artificial sources, and the global annual nitrogen and phosphorus input to ecosystems has more than doubled in this period (Vitousek et al. 1997; Smil 2000; Falkowski et al. 2000).
All over the world, the complex regulation mechanisms in natural systems and biological controls operated by plants and invertebrates across many scales have been severely impaired, wherever food production has increased through the input of additional nutrients and use of tillage. Large-scale additions of nutrients in agroecosystems can no longer be retained and recycled locally. Undesired transfers from terrestrial to aquatic ecosystems have become a serious and growing problem worldwide (Howarth et al. 2000). At the same time, deposition from the atmosphere of nutrients, originating from industry, agriculture, biomass fires, and wind erosion, is spreading unprecedented quantities of N, P, and possibly Fe and Si to downwind ecosystems over large regions (Brasseur et al. 2003).
In contrast, severe nutrient depletion is observed in soils in some regions, notably in sub-Saharan Africa (Sanchez 2002). In these areas, particularly where the inherent soil fertility is low for geological and ecological reasons and fertilizer inputs are limited by economic constraints, the nutrient stock in croplands is decreasing. (See Tables 12.2 and 12.3.) This is having a serious impact on human food security in the region.
|
Table 12.3. Total Nutrient Balance in Latin America and in Central America and the Caribbean (Henao 2002) Year (Average) Country 1981–85 1986–90 1991–95 1996–99 (NPK–kg/ha) Argentina -109.1 -108.8 -105.4 -98.9 Belize -189.6 -106.3 -125.5 -143.7 Bolivia -97.4 -105.1 -132.7 -142.9 Brazil -67.7 -72.3 -79.7 -79.5 Chile -54.7 -21.1 24.5 101.7 Colombia -87.7 -55.3 -68.3 -66.0 Costa Rica -50.4 -22.7 -18.8 63.2 Dominican Rep -133.6 -85.8 -83.6 -70.0 Ecuador -68.5 -76.4 -85.4 -63.1 El Salvador -80.5 -63.9 -83.5 -78.6 French Guiana 109.6 -24.8 -86.6 -69.4 Guatemala -91.7 -77.8 -88.5 -96.1 Guyana -150.0 -108.4 -137.9 -132.0 Honduras -133.7 -132.1 -136.8 -72.9 Jamaica -120.2 -76.5 -91.2 -90.7 Mexico -33.2 -27.2 -47.1 -47.4 Nicaragua -105.5 -76.8 -93.9 -92.8 Panama -118.6 -74.1 -89.1 -67.5 Paraguay -88.7 -98.9 -116.2 -117.1 Peru -97.3 -59.2 -80.2 -63.8 Suriname -97.2 -121.7 -151.9 -83.5 Trinidad & Tobago -110.9 -163.0 -131.8 -98.5 Uruguay -35.9 -33.9 -35.8 -2.6 Venezuela 12.1 113.3 6.3 -29.2 |
Some of the important questions addressed in this chapter include: What will be the consequences for ecosystems and human well-being of the expected 30% increase in the human contribution to fixed N and other nutrients over the next 30 years? (See also Chapter 9 of the Policy Responses volume). Is the increasing frequency and extent of eutrophication observed in fresh and marine waters likely to be stopped or reversed? How will these changes in the natural nutrient cycling system affect other ecosystem services? (Ecosystems and Human Well-Being: Volume 1: Current State and Trends: Nutrient Cycling)
12.2 Important Issues Common to All Nutrient Cycles
12.2.1 Ecosystem Stoichiometry: The Balance between Nutrients
Living organisms tend to contain a relatively constant proportion of elements, especially carbon, nitrogen, and phosphorus. In freshwater microalgae, the elemental contents expressed as molar stoichiometric ratios are C (125), N (19), and P (1) (Reynolds 1990), the same order of magnitude as the Redfield ratio (106:16:1) proposed for suspended particulate matter in oceans (Redfield 1958). The average proportions for land plants are about 200:13:1 (although these can be much wider for woody plants) because the need for structural tissue drives up the C content. Since the proportions of various functional groups of plants are also relatively fixed, ecosystems too have broad proportionality in their nutrient content. This has major implications: for instance, it means that the cycles are inextricably linked through shared organic molecules produced by living organisms. A perturbation to one cycle is a perturbation to all.
In response to an unbalanced composition of nutrients in their food, organisms tend to either eliminate excess nutrients or develop strategies to better capture nutrients that limit their growth. For example, in large water bodies, the efficiency of remineralization is higher for P than for N. This causes a shift in the N/P ratio of the available nutrients. This shift may be corrected by natural nutrient inputs, or further modified by inputs from human activities in the watershed. The result may be twofold: first, a new phytoplankton community may develop, with species more aligned to the new N/P nutrient ratio and concentration, and, second, the C/N/P composition of the phytoplankton may change, affecting its nutritional value for the primary consumers and energy transfer efficiency in the food chain.
Up to the 1980s, N was considered the nutrient that limits primary production of the world oceans. The ‘‘North Atlantic paradigm’’—the view that oceanic primary production is under control of dissolved inorganic N—was established on the basis of studies mostly conducted in the North Atlantic Ocean, where most of the marine stations were situated. However, this view of the world oceans’ biogeochemistry has proved to be incorrect. Multidisciplinary studies in a wider range of locations and situations have revealed the important role of other nutrients (Dugdale et al. 1995). (See Boxes 12.1 and 12.2.) For instance, silicon is essential for diatoms, the workhorses of the marine ecosystem, and may be quickly depleted as an excess of N and P becomes available. Phosphorus is required for all phytoplankton, including for N fixation (described later), and so does not have a fixed stoichiometric ratio. Interaction of the biota with the great nutrient cycles in the oceans makes it necessary to consider each situation with regard to potential nutrient limitation.
|
|
|
A number of trace metals are required for plant growth. Most appear to be present in sufficient quantities. However, iron is a special case for ocean organisms as it is required in many enzyme systems, including those in photosynthesis and in the processing of inorganic and gaseous nitrogen. A shortage of Fe has been shown to influence the uptake kinetics of Si(OH)4—reducing, for example, the maximal uptake rate (Leynaert et al. 2001). Open ocean Fe enrichment experiments found Fe to affect the initial slope of the light versus carbon uptake curve in primary production (Barber et al. 1996). The distribution of Fe in the oceans is poorly known due in part to the difficulty of obtaining uncontaminated samples, as the techniques for obtaining clean samples were developed only recently. However, the vertical profiles of Fe often follow the same pattern as NO3 (Martin 1992). Since the NO3 profiles are the result of biological production and regeneration, it appears that biological processes to a large extent control the distribution of Fe also. Input of Fe from the atmosphere is an important source of Fe, and some regions of the open ocean may experience enhanced productivity from the occurrence of remote dust events. |
|
|
|
Silicon, like iron, has its major sources on land but is a critical element in marine ecosystems. Dust atmospheric deposits allow transport from land to oceans and other continents, with significant effects on transfers of carbon to the deep ocean and neoformation of clay minerals that regulate nutrient cycling in terrestrial ecosystems. Sustained C storage in the ocean requires a mechanism known as the ‘‘biological pump’’—the export of particulate organic C to the deep ocean (Buesseler 1998). Si(OH)4 is required for building the frustule of diatoms, the most productive and fastest growing of the phytoplankton (Smetacek 2000). Diatoms contribute as much as 75% of the annual primary production in coastal upwellings and Antarctic waters and about 40% of the global marine annual primary production (Nelson et al. 1995) Where Si is in short supply, the plankton community is dominated by small-bodied algae, whose primary production simply cycles within the surface waters. To sink into the deep ocean waters, and thus be sequestered for useful periods of time, C must be in larger, heavier bodies, such as diatoms (Dugdale et al. 1995). Large areas on the fringe of the Southern Ocean are apparently Si-limited at certain times of the year. If we are to better understand and model the marine cycle of C, Si has to be taken into consideration by marine biogeochemists (Tre´guer and Pondaven 2000; Ridgwell et al. 2002). During the last decade, the Si budget of the world ocean and of key marine regions has been revised (Tréguer et al. 1995; Nelson et al. 1995; Tréguer and Pondaven 2000; De Master 2002). Our present best estimate for the annual production of the biogenic Si deposited in diatom frustules is 240 ( 40 Tmol per year for the world ocean (Nelson et al. 1995). The estimates of the net export of biogenic Si range between 120 and 129 teramoles (1012 moles) per year (Tréguer et al. 1995; Ridgwell et al. 2002). In Amazonia, recycling of Si by plants allows neosynthesis of soil clay minerals that accumulate at the soil surface forming thick microporous horizons of microcrystalline aolinite where aluminum oxide horizon should have normally formed (Lucas et al. 1993). A similar mechanism has been observed in Mexican paramo with a perennial grass cover (Dubroeucq et al. 2002). In that case, allophane is formed instead of imogolite, an aluminium-rich colloid that is toxic at high concentrations. Soil fauna then redistribute these minerals in the upper part of the soil profile. |
12.2.2 The Role of Organic Matter
Organic matter (that is, C-based compounds of biological origin) plays several pivotal roles in determining nutrient availability to plants. The largest labile stock of nutrients in soils, sediments, and waters is typically contained in organic compounds. Since uptake by plants is almost exclusively in the inorganic form, the biologically mediated process of organic matter decomposition is crucial to nutrient availability (Parton et al. 1988).
Soil and sediment organic matter is a heterogeneous mix of particles of partly decayed plant and animal tissues; the living biomass of microbes (principally fungi and bacteria); amorphous, decomposition-resistant high molecular weight C polymers known as humic substances; and a small quantity of simpler, less recalcitrant organic molecules, such as carbohydrates, amino acids, and lipids.
Organic matter provides energy for all microbial and faunal activities and thus allows them to build the microaggregate structures that control soil hydraulic properties and serve to further conserve organic matter. For example, deposition of straw on the soil surface of degraded soils of the Sahelian region attracts termites that feed on this resource and significantly improve water infiltration and storage in the galleries and porous constructions (Mando et al. 1997). The amorphous polymers act as reserves of nutrients, which are sequestered in their chemical structures for periods of centuries to millennia. Since its surface bears a significant electrical charge, organic matter (along with clay) is the main location on which the cationic and anionic forms of plant nutrients are retained prior to uptake, without being leached out of the soil (Jenkinson and Rayner 1977; Schlesinger 1997; Lavelle and Spain 2001).
Agricultural practices and the policies that accompany their evolution may have a significant impact on the role and dynamics of organic matter in the provision of soil ecosystem services. For example, the prohibition against burning sugarcane crop residues in some tropical countries will probably have an impact on the storage of C in soils. Pasture rotation practiced in some areas aims to reconstitute organic stocks by the annual crops by inserting perennial grass lays that will increase organic matter stocks (Franzluebbers et al. 2000).
12.2.3 Nutrient Retention in Ecosystems: Buffers and Safety Nets at All Scales
In natural ecosystems, regulation of nutrient cycling operates at different scales of time and space, allowing the flow of nutrients released by microbial activities to adjust to plant demand, thus limiting losses to other parts of the ecosystems or to different ecosystems. In natural ecosystems, this ‘‘synchrony’’ between release of nutrients and their use by microorganisms and plants is determined by complex interactions among physical, chemical, and biological processes. It is rarely achieved to a comparable degree in agroecosystems, which as a result lose nutrients to aquatic ecosystems or to the atmosphere (Cadisch and Giller 1997).
Regulation of nutrient fluxes occurs in biological structures (‘‘self-organizing systems,’’ according to Perry 1995), which can be observed at seven different scales, ranging from microbial aggregates (Scales 1 and 2), through ecosystems (Scales 3 and 4) to landscapes (Scales 5 and 6) and the entire biosphere (Scale 7) (Lavelle and Spain 2001; Lavelle et al. 2004), as follows.
Scale 1, microbial communities in microbial aggregates and biofilms— At this scale, highly diverse microbial populations may control some transformations, whereas others that rely on a low number of species are vulnerable. For example, this is the case for microorganisms that control nitrification (the transformation of ammonia into nitrate, a form usable by plants), a critical step in N cycling. The functionality of these communities is rarely impaired by ecosystem degradations in spite of decreases in microbial diversity reported in some cases. The most sensitive function may be nitrification, since it is operated by a relatively small, diverse group of microbes. The risk to this function seems to be very limited, although it is speculated that threshold effects might be observed in some conditions.
Scale 2, microbial loops involving microbes and their micro-predators in soil and sediment aggregates, leaf packs, and [[freshwater (Freshwater biomes)] systems] or water columns—These are rarely severely impaired, although changes in soil nematode communities, and in microbial abundance and composition, have been observed in response to aggressive land use practices such as agricultural intensification (Bongers 1990; Yeates 1994). When larger-scale regulating systems are impaired, the diversity and abundance of the micropredator food web (protozoa, nematodes, and acari in soils; specific invertebrate microplancton in fresh water and seas) may affect parameters of nutrient cycling, such as C and N mineralization (DeRuiter et al. 1993), through changes in their regulation of microbial activities. An index of soil ‘‘maturity’’ has been proposed to evaluate the functionality of this compartment (Bongers 1990). Clear changes in its communities have been observed, although effects on nutrient cycling have been reported only in laboratory experiments.
Scale 3, physical structures of animals and roots that have an impact on sediments and soils by their bioturbation effects—Mutually beneficial interactions with microflora and indirect effects of organisms that create the soil architecture by producing solid bricks of associated soil particles (called aggregates) and pores of different sizes and shapes (such as galleries, burrows, and interaggregate voids) allow regulations of nutrient cycling at different nested scales of time and space (Lavelle and Spain 2001).
For example, digestion of soil organic matter in earthworm guts is largely performed by the microflora that was ingested with the soil and further stimulated during the gut transit. In the case of the tropical geophagous earthworm Millsonia anomala, 90% of the energy thus assimilated by the worm is further spent on mechanical activities—the transit of huge amounts of soil (up to 20 times the weight of the worm daily; 1,000 milligrams of dry soil per hectare per year for an earthworm community). Soil that has transited through the earthworm guts is deposited in the soil and at the surface in the form of globular casts that are the stable aggregates that constitute most of the soil in the upper horizon. These aggregates are microsites where C-sequestration and nutrient conservation are active. Porosity created by these biological activities participates in water infiltration and storage and in soil aeration (Lavelle and Spain 2001).
Diversity of plants and soil invertebrates may influence nutrient cycling and prevent nutrient losses at the ecosystem scale, although the generality of this process has not yet been demonstrated nor have underlying mechanisms been clearly identified (Chauvel et al. 1999; Tilman and Downing 1994). The functionality of the nutrient buffer provided by biodiversity can be evaluated through indicators of soil and sediment quality based on invertebrate communities (Velasquez 2004; Ruiz 2004). Direct and indirect effects of soil bioturbators on nutrient cycling are reasonably well understood, and their use as indicators of soil quality is now well established.
Scale 4, ecosystems as mosaics of physical domains of different species of plants and animals—Excess nutrients released in a patch may diffuse away and be absorbed in adjacent nutrient-depleted patches. This feature is deliberately manipulated in most agroforestry and agricultural systems with plants that are associated with high nutrient needs (such as an annual crop of cereals) planted in patches or bands to capture excess nutrients (such as legume shrubs). Secondary successions in forests may also rely on different timing and rates of accumulation of nutrients in adjacent patches (Bernier and Ponge 1994). Research has proved the value of having a mosaic of patches at different stages of the succession (that is, a combination of patches with young, mature, and senescent groups of trees), although models suggesting optimal combinations of these patches do not exist.
Scale 5, landscapes or seascapes—At this scale, nutrients released in excess from nutrient-rich ecosystem patches may be absorbed by adjacent nutrient-poor patches. For instance, riparian forests may absorb nutrients leaking from crop areas and thus prevent them from entering a river system. On the River Seine in France, 25–55% of the N coming from below the root zone of agricultural land or from aquifers is retained or eliminated by riparian forest or wetlands before reaching surface waters (Billen and Garnier 1999). More generally, it is estimated that wetlands on average intercept 80% of N flowing from terrestrial systems (although figures vary due to temperature and size of the area; see Chapter 7 (Ecosystems and Human Well-Being: Volume 1: Current State and Trends: Nutrient Cycling)). Again, there is ample empirical evidence of the efficiency of these buffers, although predictive models do not exist (Krug 1993; Haycock et al. 1993).
Scale 6, river basins, oceanic biogeochemical provinces, [[terrestrial] biomes]— At this scale, climatic factors (such as ambient temperature or the level of water in terrestrial systems) regulate the overall rates of biological activities and chemical transformations. Organic matter produced in warm surface layers of aquatic bodies descends to cold, deep strata, where consumers are not active due the lack of light. Specific mechanisms of thermal convection and deep ocean currents driven by temperature-, salinity-, and density-induced gradients move nutrient-rich deep ocean water to the surface, where potential consumers are active.
Scale 7, the biosphere—Global atmospheric and oceanic circulation created by the redistribution of energy at the Earth’s surface determines distribution of nutrients through various mechanisms, including deposition of atmospheric dust and nutrient conveyer belts associated with major currents in the oceans. The variation in nutrient concentrations in different basins of the world’s oceans has its origin in the circulation of the water between the ocean basins, driven by changes in heat input at the ocean surface and changes in salinity from variations in river inputs to the different basins. The macro-circulation of the oceans has been described as a ‘‘conveyer belt’’ (Broecker and Peng 1982), wherein deep water formed in the north sinks and makes its way through the Antarctic and then north into the Pacific and Indian Oceans. As it flows, it receives organic particles formed by primary production and fecal pellets formed by grazing by zooplankton that are traveling in the opposite direction. This counter-current exchange mechanism results in increasing nutrient concentrations in the deep water as it travels westward from the Atlantic Ocean.
The scale structure is hierarchical, with each scale comprising the sum of the elements present in smaller scales. Effects at small scales are accumulative, and their effects are additive at larger scales. Impairment of services at one scale is likely to be caused, at least in part, by changes at a smaller scale, and it is at these smaller scales that interventions are most effectively targeted in order to tackle the causes of large-scale trends. Interventions at larger scales generally are only able to mitigate the effects of change in the short term.
The existence of different levels of buffers at nested scales also has the potential to reduce the vulnerability of nutrient cycling services, since different options exist to support the services. Damage occurring at lower scales, such as accidental loss of soil fauna that aerate soil (earthworms, for instance), may not have immediate or lasting effects, since soil structures created by these invertebrates may last long enough to enable populations to be restored if the disturbance is not too severe.
However, sometimes disturbances have multiple effects that accumulate over time and space, causing the system to collapse. Highly intensive land management for crop production, for example, can have detrimental effects at Scales 2–5, reducing soil fauna and root diversity (Scales 2 and 3) through use of pesticides and tillage (Lavelle and Spain 2001), homogenizing the ecosystem at plot scale (Scale 4) through use of monocultures, and simplifying the landscape composition through the use of fewer crop varieties (Scale 5). Precise data on the degree and duration of impacts that will lead to irreversible effects, such as soil and sediment erosion or replacement of native by invasive species of invertebrates, and other severe consequences for biodiversity and the vulnerability of the system are currently lacking. At present, only indicators of soil quality allow us to compare different sites and states and to evaluate trends.
12.2.4 Soil Erosion
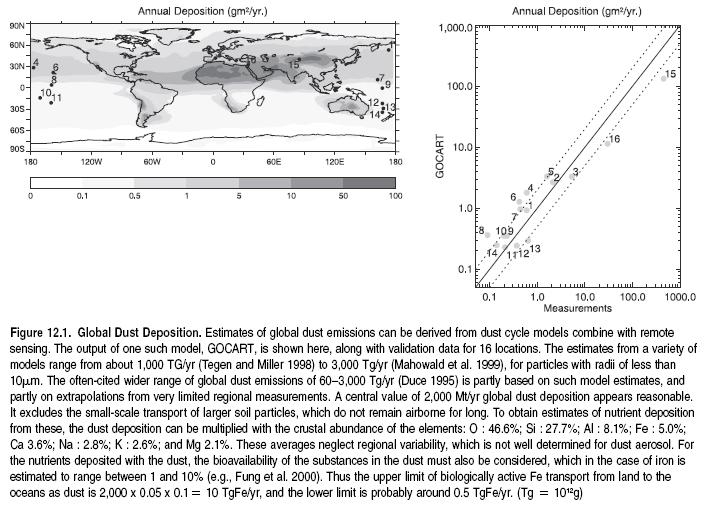
Soil erosion is one of the key processes underlying land degradation and desertification. Erosion affects nutrient cycling and reduces the fertility of the soil through a reduction in the pool of available nutrients. Soil erosion results in drastic modifications to the structure as well as the biological and chemical properties of the soil matrix. The resulting dust and sediments have off-site impacts that may be as large, or larger, than the loss of production sustained on the eroded site. Persistently high rates of erosion affect more than 1.1 billion hectares of land worldwide (Berc et al. 2003; Jacinthe and Lal 2001), redistributing 75 billion tons of soil (Pimente et al. 1995) with 1.5 to 5.0% C-content (Lal 2001). When nutrient-rich topsoil is transported from one place to another, nutrients are redistributed over the landscape. In the process, some is lost to riverine systems and eventually to the ocean, with major off-site economic and human well-being consequences, such as silting of reservoirs and eutrophication of lakes. On the other hand, dust deposits transported in the high atmosphere from Africa to North America are likely to stimulate the formation of new clay minerals in highly weathered soils and contribute (in other regions) to fertilization of nutrient-deficient marine areas. (See Figure 12.1.)
Erosion reduces the potential to sequester atmospheric CO2 in soils by reducing the primary productivity. Exposure of subsurface layers to near-surface environments results in acidification of carbon-containing layers in most soils (Lal 2003). Soil erosion is the main way in which stable, mineral-associated soil organic C is translocated in large quantities into aquatic systems (Starr et al. 2000). The organic matter can end up in anoxic environments, where it is better protected than on land, and the accompanying nutrient fluxes may increase aquatic primary productivity. Thus not all C in eroded soil is returned to the atmosphere immediately, but the net effect is likely to be carbon emissions.
12.2.5 Input and Output Processes
Ecosystem nutrient balance is the net result of inputs minus outputs. Negative and positive balances are ultimately unsustainable. The magnitude and duration of nutrient imbalance that can be tolerated is determined by an ecosystem’s buffering capacity. This is roughly indexed to the size of the nutrient stocks, divided by the normal net flux, which gives the turnover time.
Input of nutrients to ecosystems occurs through five processes. First, weathering from geological sources generally produces relatively small quantities of nutrients over long periods of time but is nevertheless an important input mechanism that sustains the levels of P, potassium, iron, aluminum, sodium, and silicon in natural ecosystems. The nature and composition of bedrock, in interaction with the climate, largely determines the flux. In all cases, this flux decreases with the age of the weathering surface. The rate at which anions are liberated through weathering determines the long-term capacity of ecosystems to absorb acid deposition, an ecosystem service of major importance in regions downwind of anthropogenic sources of NOx and SO2.
Second, atmospheric input of nutrients can occur through wet or dry deposition of elements previously released to the atmosphere by fires (biomass or combustion of fossil fuels), intensive farming practices (such as pig farms or cattle feedlots), and wind erosion. Atmospheric inputs have been substantially increased by human activities.
Third, biological processes include the fixation of atmospheric C (CO2) through photosynthesis, and atmospheric N (N2) through biological N fixation.
Fourth, nutrients can be released from the biomass of mobile organisms that enter an ecosystem and suffer mortality. This also occurs through the lateral transfer of nutrients, primarily in water flows. The burgeoning human trade in agricultural and forest products is now a significant pathway of nutrient transfer globally—some of it from the nutrient-depleted developing world to the nutrient-saturated industrial world and, on a smaller scale, between rural and urban ecosystems.
Fifth, direct anthropogenic inputs occur through fertilization practices used in intensive agriculture and through the release of human sewage and livestock wastes.
The output of nutrients from ecosystems also involves five processes. Soil erosion is the main mechanism whereby nutrients are transported in large quantities from terrestrial to aquatic ecosystems. Although a natural process of soil rejuvenation, erosion is typically accelerated to many times above the long-term ‘‘natural’’ rate in systems where cultivation, overgrazing, and vegetation clearance are practiced. The essential nutrients that are most affected by erosion are C, P, K, and N.
Second, leaching is the vertical flow of water in the soil profile that transports significant amounts of nutrients in solution from the soil system into groundwater and thence laterally to rivers, lakes, and oceans. Leaching losses of nutrients are highest in cultivated or disturbed systems.
Third, gaseous emissions of CO2, CH4, and CO (among other gases) to the atmosphere result from the decomposition of organic matter, including digestion by animals, and the vastly accelerated decomposition that occurs in fires. Processes related to the conversion between inorganic forms of N lead to emissions of N2, N2O, NO, and NH3. Phosphorus has no significant gaseous forms in most ecosystems. Anthropogenic activities, such as ploughing, fertilization, fossil fuel burning, flooding, drainage, deforestation, and changes to fire regimes, have altered the amounts and proportions of emissions of nutrients to the atmosphere. This is the ultimate underlying cause of contemporary climate change and air quality deterioration.
The fourth output source is the emigration of fauna or the harvest of crop, forest, fish, or livestock. As noted earlier, export from one ecosystem generally means import to another.
Fifth, the effective permanent removal of nutrients from the biosphere only occurs at a slow rate and through a small number of processes. For instance, for the atmospheric concentration of CO2 to stabilize at levels that will not cause dangerous climate changes, anthropogenic carbon emissions must drop, within the next few centuries, to a level determined by the long-term sequestration sinks to a few teragrams (million tons) of carbon per year (Prentice et al. 2001).
12.3 Global Nutrient Cycles
12.3.1 The Global Nitrogen Cycle
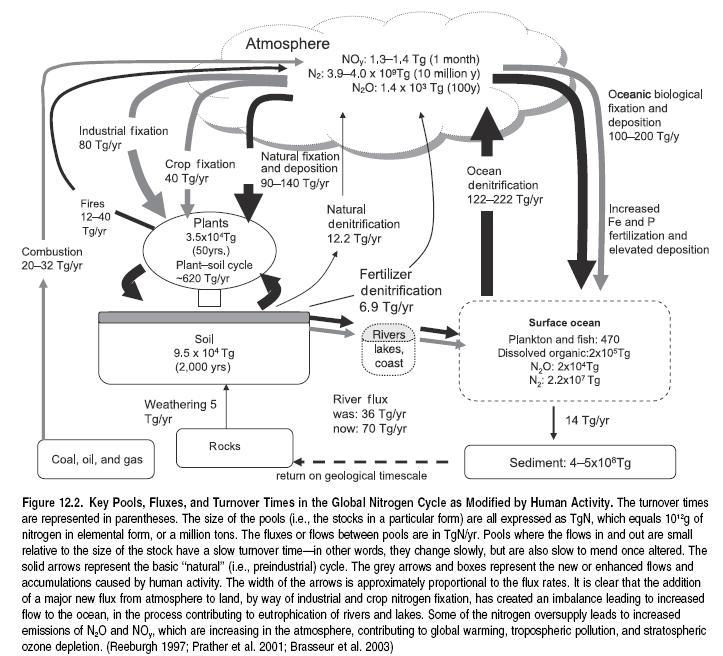
There have been extremely significant changes in the global nitrogen cycle in the last two centuries, and N inputs to the global cycle have approximately doubled in this time. (See Figures 12.2 here and 12.3 in Appendix A (Ecosystems and Human Well-Being: Volume 1: Current State and Trends: Nutrient Cycling).) Although most aspects of this balance have been assessed with a high level of accuracy (fertilizer inputs, atmospheric deposition, inland N fixation), a large uncertainty remains regarding the extent of N fixation in oceans, as explained later. Three processes are primarily responsible for the increased flows of N in the global cycle.
First, industrial-era combustion, especially of fossil fuels, has increased the emission of reactive N gases (NOy) to the atmosphere, where they participate in the production of tropospheric ozone (the main harmful component of air pollution) before depositing, as a gas, as nitric acid dissolved in precipitation, or as dry aerosols on land or sea. Because of the reactivity of the gases, the impact is restricted to a region of up to about 1,000 kilometers downwind of the source. Worldwide deposition of N as wet or dry deposits, in the form of NO3- or NH4+ ions, is especially concentrated in regions with farm cattle production. Highest deposition rates reach 50 kilograms per hectare per year, with local maximums of up to 100 kilograms in Europe, North America, China, and India, as well as Southwest America, Colombia, and a few regions in Africa (see Chapter 9). In other places, the recent rise in deposition (compared with the beginning of the twentieth century) has remained limited.
Initially, N deposition stimulates net primary productivity, since N is the most widely limiting nutrient in terrestrial ecosystems (largely because it is so readily lost by gaseous emission or leaching). Once the capacity of the recipient ecosystem for N inputs is reached (a point known as N saturation, indicated by a sudden increase in nitrates in water draining from the system), the excess is leached into adjacent rivers, lakes, and [[coast]al zones], causing eutrophication. This can lead to biodiversity loss in both terrestrial and aquatic ecosystems, and, in severe cases, net primary production may decline (Schulze et al. 1989). However, given the moderate rise in N use predicted, the minor contribution to plant growth that Nadelhoffer et al. (1999) have calculated should remain limited. According to Frink et al. (2001), this should pose little hazard to biodiversity.
Second, the invention of the Haber-Bosch process for converting atmospheric N2 to ammonia laid the foundation for the exponential growth in N fertilizer use in the second half of the twentieth century. It enabled the high-yielding crops of the Green Revolution, which brought about a large increase in the production of relatively cheap food and improved the well-being of millions of people. However, less than half of the applied N fertilizer finds its way into the crop plant. The remainder leaches into water bodies or returns to the atmosphere, most benignly as N2, but some as the powerful and long-lived greenhouse gas N2O, which is also involved in stratospheric ozone depletion. The atmospheric concentration of N2O has been rising by roughly 0.8 parts per trillion per year (0.25%) during the industrial era, largely through this mechanism. In 1998, it averaged 314 ppt, up from a preindustrial level of 270 ppt (Prather et al. 2001). (See also Policy Responses volume, Chapter 9.) The present trend indicates a plateau may have been reached, although some models predict future increases. Whichever model is correct, no decrease is expected, since human population seems to have already exceeded the maximum number that can be supported without chemical fertilizers.
Third, the natural process of biological N fixation has been harnessed for agricultural purposes. Worldwide plantings of N-fixing crops, such as soybeans, now capture about 40 teragrams of nitrogen a year, an ecosystem service worth several billion dollars annually in avoided fertilizer costs and contributing substantially to human nutrition. The negative consequences are ultimately similar to those resulting from industrial N fixation: increased emissions of N2O and leaching of N from the land into water bodies once organic N has been mineralized. In addition, severe acidification of soils following repeated harvests of N-fixing crops can occur, unless balancing quantities of cations are added (Pate 1968). Increase in N fixation is still considered important for sustained agricultural production, and is set to continue.
In [[marine] ecosystems], estimates of N fixation by organisms vary by more than tenfold, ranging from less than 30 to more than 300 teragrams per year (Vitousek et al. 1997). There is speculation, supported by some evidence, that biological N fixation through the cyanobacterium Trichodesmium has increased during the modern era as a result of increased iron fertilization by wind-borne dust (Moore et al. 2001).
Part of the accumulated N is eliminated in gaseous forms through the denitrification process. Although it resembles a natural mitigation of eutrophication, nitrous oxides produced from fertilizer denitrification account for 6.9 teragrams of N per year, representing a flux of 56% increase in total denitrification from terrestrial ecosystems. Furthermore, 20–32 teragrams in gaseous forms are released to the air each year through combustion, creating atmospheric pollution. (See Chapter 13.)
The overall N budget on Earth has thus been significantly modified. In preindustrial times, the annual flux of nitrogen from the atmosphere to the land and aquatic ecosystems was estimated at 90–140 teragrams of N per year. This was more-or-less balanced by a reverse ‘‘denitrification’’ flux. Production and use of synthetic nitrogen fertilizer, expanded planting of nitrogen-fixing crops, and deposition of nitrogen-containing air pollutants together create an additional flux of about 210 teragrams a year, only part of which is denitrified (Vitousek et al. 1997). This 210- teragram increase can be attributed to chemical fertilizers (80), biomass burning (40), N-fixation in legume crops (40), fossil fuel combustion (20), land clearing (20), and wetland drainage (10).
12.3.2 The Global Phosphorus Cycle
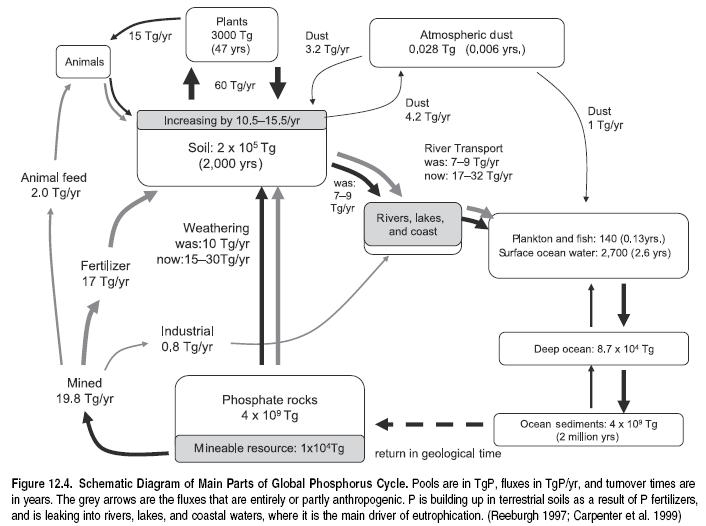
The lithosphere is the ultimate source of all phosphorus in the biosphere. (See Figure 12.4.) Paradoxically, while apatite (the naturally occurring phosphate rock) is one of the most easily weathered primary minerals, P is amongst the least biologically available major nutrients. This is because the forms of phosphorus in the biosphere are poorly soluble, immobile, or otherwise inaccessible.
As a result, P occurs in sufficient supply in young, arid, and neutral soils, although with some exceptions, depending on the nature of the parent material. On the other hand, P often co-limits (with N) plant and animal production on old, highly weathered soils, such as those that dominate tropical Africa, South America, and Australia. Since NH4+ and NO3- are both more readily leached out of soils than phosphate, freshwater and some coastal ecosystems are typically more responsive to increases of P than of N, making P the principal driver of eutrophication in lakes and estuaries. Phosphorus is transported principally adsorbed onto or absorbed into soil particles rather than in solution. In addition, where intensive animal husbandry is practiced, P can be lost in large quantities in surface runoff (Surface runoff). As such, phosphorus in fact does not strictly cycle (other than in very long geological time frames) but follows a one-way path from terrestrial to aquatic systems. Return from marine systems to land in the form of bird guano, although sometimes locally important, is a very minor flux in total.
The availability of P in landscapes where it is scarce is greatly enhanced by biological processes. Specialized symbiotic fungi, known as mycorrhizae, transfer P from inaccessible forms to the plant and help to reduce leakage of P from the system. There is widespread empirical evidence that low P availability constrains biological N fixation (Smith 1992) contributing to the co-limitation just mentioned. However, the mechanism resulting in this constraint remains poorly understood (Vitousek et al. 2002).
Figure 12.4 shows the contemporary and preindustrial global P cycles. The contemporary cycle is not in balance. As a result of the large P inputs from the lithosphere, mainly through phosphate mining, and accelerated weathering as deep soil is exposed as a result of surface erosion, P is accumulating in terrestrial ecosystems in both the industrial and developing world (with some conspicuous exceptions, such as most of sub-Saharan Africa). The main mechanism by which the P leaves the land and enters freshwater (Freshwater biomes) ecosystems is soil erosion. Agricultural P is the principal driver of eutrophication. P concentrated in sewage effluents and animal and industrial wastes, including P-containing detergents, makes a relatively small global contribution (Bennett et al. 2001), although it may be important locally. For example in the United States 36% of sewage sludge is applied to the land, with the rest going to landfills, incineration, or other ‘‘surface disposal’’ methods.
Because the amount of P accumulated on land is large, and the processes of release are relatively slow but hard to prevent, this problem is highly likely to grow substantially in the coming decades. However, the rapid increase in no-till agricultural systems in several parts of the world and an increasing trend to incorporate buffer strips or hedgerows in agricultural landscapes may help to mitigate the problem significantly in some areas. For example, in the United States in 1989, 3% of cropland was no-till; in 1998 it was 16.3% (20 million hectares). In Brazil, 3% of cropland was no-till in 1990 and in 1998 it was 25% (10 million hectares). In Argentina, the figure was 2% in 1990 and 28% (6 million hectares) in 1998. And in Australia, the no-till area jumped from 0.1% in 1990 to 50% (10 million hectares) in 1998. (Eutrophication is dealt with extensively later in this chapter.)
12.3.3 The Global Sulfur Cycle
In many respects the sulfur cycle parallels the nitrogen cycle, except for a significant input from the lithosphere via volcanic activity and the absence of a biological process of S fixation from the atmosphere to the land or water. (See Figure 12.5.) The main human perturbation to the global S cycle is the release of SOx (SO2 plus a small amount of SO3) to the atmosphere as a result of burning S-containing coal and oil and the smelting of sulfite ores.
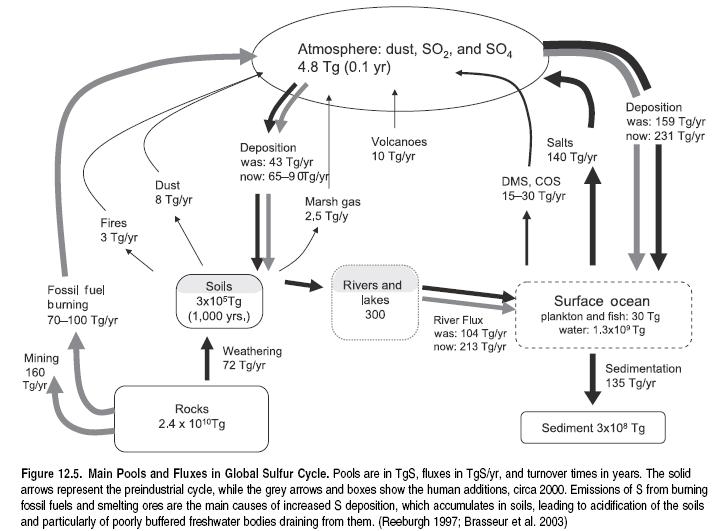
SOx gas impairs respiration in humans at high concentrations and is moderately toxic to plants. Other S gases, such as H2S and mercaptans (sulfur-containing organic chemical substances), are not very toxic but are highly offensive to human olfaction even at low concentrations. Consequently, S-containing gases are usually vented from tall smokestacks in order to be widely diluted at ground level. Coupled with the simultaneous removal of ash particles from the smoke, this contributed greatly to the emergence of the ‘‘acid rain’’ deposition problem in the twentieth century (Smil 1997). Sulfuric acid is one of the major components of acid deposition, along with nitric acid, carbonic acid, and various organic acids. In preindustrial times it was largely neutralized by the simultaneous deposition of alkaline ash. High increase in S deposition (22–47 teragrams per year) has led to a situation where this compensation is no longer operating.
In the atmosphere SOx forms SO42-, a crystalline aerosol that acts as a powerful nucleus for cloud condensation and helps to retard climate change. The sulfate dissolves in rainwater, forming dilute sulfuric acid, and is deposited on Earth’s surface in wet or dry form, the proportions of which depend on the prevailing climate.
Damage to ecosystems results not so much from the direct effects of acid, SOx, or SO42- on plants (S, in small doses, is a fertilizer), but from the direct effect of leaching of SO42- from soil in drainage. To maintain electrical neutrality of drainage, cations, principally Ca2+, are lost; the resulting acidification brings Al3- and H+ into solution (Galloway 2003). The Al3+ ion impairs nutrient absorption, especially phosphorus uptake, by the roots of all but a very specialized group of plants. It is also highly detrimental to aquatic organisms and ecosystems. Soil, river, and lake acidification is extremely difficult and expensive to remedy. The buffering capacity of the ecosystem, which is related to soil depth, soil chemistry, and weathering rate, provides an ecosystem service worth billions of dollars, both in avoided damage and mitigation actions. The capacity of this service is, however, finite and easily exceeded.
As a result of severe human health problems associated with SO2 in urban smog and concerns regarding ecosystem health in areas exposed to high loadings of acid deposition, sulfur has been progressively reduced or eliminated from industrial, domestic, and transport sector emissions in Europe and North America. This has been achieved by switching from high-S coal and oil to lower-S fuels and by installing flue-gas desulfurization equipment. This has been so successful that S deposition has declined to such an extent that sulfur is now becoming a limiting nutrient in many parts of Europe. The result is that N deposition, resulting from vehicular, industrial, and agricultural emissions, has now become the major component of acid deposition in these regions. A perverse consequence of this is that global warming will increase by about 0.3 watts per square meter (about 10%) as the anti-greenhouse effects of sulfate aerosols diminish (Ramaswamy et al. 2001).
However, sulfur emission reduction is not widely practiced in the emerging industrial areas of the world: China, India, South Africa, and the southern parts of South America. A global assessment of acid deposition threats (Kuylenstierna et al. 2001), based on a combination of emission locations, wind transport patterns, and the buffering capacity of soils in the receiving regions, suggests that tropical ecosystems in the developing world are at high risk of acidification. (See Figure 12.6 in [[Appendix A (Ecosystems and Human Well-Being: Volume 1: Current State and Trends: Nutrient Cycling)]2].)
12.3.4 The Global Carbon Cycle
The global carbon cycle has been assessed recently and comprehensively by the Intergovernmental Panel on Climate Change (Intergovernmental Panel on Climate Change (IPCC)) (Prentice et al. 2001) because of its centrality to the issue of global climate change. This chapter will not repeat that work nor the discussion of C-climate interactions covered in Chapter 13 (Ecosystems and Human Well-Being: Volume 1: Current State and Trends: Nutrient Cycling) on air quality and climate. Suffice to say here that the global C cycle is currently out of balance (see Table 12.4), principally as a result of the burning of fossil fuels, but also due to the conversion of high C-density natural ecosystems, such as forests and grasslands, to lower C-density agroecosystems. It should be noted that the C cycle has been perturbed by about 13% relative to its preindustrial state, compared with figures of 100% or more for the N, P, and S cycles (Falkowski et al. 2000).
|
Table 12.4. Stocks of Carbon in Major Compartments of the Earth System and Their Residence Times. The Table indicates change in carbon stocks per year in the 1990s as a result of imbalances in the cycle caused by human emissions of 6.4±.6 PgC from the burning of fossil fuels, and 1.4–3.0 PgC from land use change. (Reeburgh 1997; Prentice et al. 2001) Components Stock Residence Time Accumulation Rate (PgC) (years) (Pg/year) Atmosphere CO2 750 3–5 3.2 ± 0.2 Land biota plants 550–680 50 land net uptake Soil peat 360 >105 1.4 ± 0.7 inorganic carbonates 1220 microbial biomass 15–30 <10 POC 250–500 <102 amorphous polymers 600–800 102–105 Lakes and rivers sediments 150 10-1–103 ? Lithosphere kerogen 15 x 106 >>106 methane clathrates 11 x 103 – limestone 60 x 106 – Ocean: surface DOC 40 – oceanic net uptake 1.7 ± 0.5 POC 5 – living biomass 2 10-1–101 Ocean: deep DIC 38,000 ~2 x 10³ DOC 700 5 x 10³ POC 20–30 101–102 sediments 150 |
Notes: 1 Pg = 1015g = 1 billion tons Kerogen consists of coal, oil, gas, and other lower-grade fossil carbons such as lignite and oil shales. Clathrates are a solid form of methane hydrates found at depth in ocean sediments. DIC: dissolved inorganic C; DOC: dissolved organic C; POC: particulate organic C. There is an important interconnectivity between the cycles of N, P, S, Fe, and Si and the C cycle (Mackenzie et al. 2002). Human actions have significantly perturbed those cycles, and this has knock-on effects on the C cycle due to considerations of stoichiometry and the co-limitation or regulation of key processes. Mechanisms such as N fertilization and the sequestration of C in deep oceans through the ‘‘biological pump’’ contribute an uncertain but large proportion of the ~ 4 billion tons per year carbon storage (Ecosystems and Human Well-Being: Volume 1: Current State and Trends: Nutrient Cycling) (Ecosystems and Human Well-Being: Volume 1: Current State and Trends: Nutrient Cycling) service that the biosphere currently provides (Prentice et al. 2001). Some key processes, such as N and CO2 fertilization of terrestrial ecosystems, are highly likely to reach saturation, possibly during this century (Scholes et al. 2000).
The global fixation of carbon through photosynthesis has been suggested as a general index of the health of both terrestrial and aquatic ecosystems, all other conditions of temperature, moisture, and nutrient supply being equal (Schlesinger 1997). Global indices of this type (such as the Normalized Differential Vegetation Index) are now available and show an increase in biomass in the high northern hemisphere latitudes, consistent with climate change, and no overall trend (but high interannual variability) in the sub-tropical deserts. They also reveal large areas of algal blooms in coastal areas, especially those that are semi-enclosed, such as the China Sea, indicating eutrophication.
12.4 Consequences of Changes to Nutrient Cycles
Alterations of nutrient cycling include situations of nutrient excess, leading to eutrophication of soils and water bodies, and nutrient deficiency linked to soil exhaustion and some specific natural situations in oceans.
12.4.1 Nutrient Excess in Fresh and Marine Waters
As noted earlier, a major consequence of fertilizer inputs and atmospheric deposits, and of impairment of buffers and regulatory mechanisms at all scales, is eutrophication of aquatic systems— both fresh and saline waters. (See Chapters 19 and 20 for more on coastal and inland water systems.)
Contents
12.4.1.1 Eutrophication of Aquatic Ecosystems
Eutrophication is the fertilization of surface waters by nutrients that were previously scarce (Carpenter et al. 1999). In the 1960s it became obvious that a change was occurring in many lakes and reservoirs, especially in industrial countries, resulting from an increase in their nutrient load. This was a consequence of human activity, with increased inputs of urban and industrial wastewater and agricultural runoff containing mainly C, N, and P. The problem is now apparent in many coastal areas as well. Eutrophication is regarded as the most widespread water quality problem in many countries (OECD 1982; NRC 1992; Nixon 1995; Carpenter et al. 1998; Howarth et al. 2000). (See also Box 12.3.)
|
|
|
Observations in 1990–91 in the center of Lake Victoria have been compared with data from 1960–61 (Hecky et al. 1994). The results indicated a stronger stratification, with less oxygen in a greater part of the deep zone of the lake. This eutrophication process results mainly from an increase of human activities in the watershed, with increased inputs of nutrients linked with urbanization, deforestation, and cultivation. Some shift in the phytoplankton population has also occurred. The increase in nutrients first led to an increase in diatoms. The resulting depletion in dissolved silicon promoted a shift in the diatom species and finally the establishment of blue-green alga (Cyanophycea) (Verschuren et al. 1998). Introduction of alien fish species such as Lates niloticus (Nile perch) and four species of Oreochromis (tilapia) also contributed to a strong modification of the trophic food web, with probable feedback on the phytoplankton community, as well as the fish community, with a strong decrease in the number of the endemic cichlids species (Lévêque and Paugy 1999). |
Eutrophication leads to many changes in the structure and function of aquatic ecosystems and thus the services they provide. The symptoms of eutrophication are well known: increase in phytoplankton, benthic, and epiphytic algae and bacterial biomass; shifts in composition to bloom-forming algae, which may be toxic or inedible; development of rooted macrophytes and macroalgae along the shores; anoxia (oxygen depletion) in deep waters; increased incidence of fish and shellfish mortality; decreases in water transparency; taste, odor, and water treatment problems; and in coastal areas, coral mortality. Such characteristics are detrimental to many water uses, including for drinking, fisheries, and recreation. Although possible, remediation measures are costly, and mostly consist of reducing the inputs of nutrients to tolerable levels.
Most attention has focused on P inputs rather that on N or C, because P is often the element limiting the growth of aquatic biota in temperate freshwater environments. Phosphorus is less abundant than N in fresh waters relative to plant needs, and its concentrations are reduced to very low levels by uptake during the growing season. It is therefore P that often regulates the extent of algal and other plant development in the aquatic environment.
A debate took place during the 1970s on the possible reduction or ban of P in detergents as a means of reducing the eutrophication of lakes. The pro-P argument relied on the small fraction of P load resulting from the detergents as compared with other urban or agricultural sources (Lee and Jones 1986). While phosphorus use has been totally banned in some countries (in Switzerland and some states of the United States), and partial restrictions occur in others, the use of high-P detergents is unrestricted in a number of other countries.
Agricultural production in some countries is not keeping pace with the increase in food demand. (See Chapter 8 for more on food production). Although in sub-Saharan Africa and Latin America a significant part of the required increase in cereal production could result from an increase in the cultivated area, the increase would transform land that is currently supplying other ecosystem services. Increase in food production is also possible from higher yields in existing agricultural areas (Pinstrup-Anderson 1999). This will require the development of more-sustainable practices making a better use of natural biological processes (Swift and Woomer 1994) and an increased use of fertilizers, which could be mitigated by an improvement in the efficiency of their use.
In Western Europe or North America, the quantity of fertilizer applied today is the same as it was in 1970, whereas the average yield of wheat, for example, has more than doubled. Assuming a slowdown in the growth of world population and crop production and an improvement in fertilizer use efficiency, it is forecast that total fertilizer use will have to increase from the present level of 140 million tons N+P2O5+K2O to 167–199 million tons per year by 2030, meaning annual growth rates of 0.7–1.3%. This compares with an annual rate of increase over the past 30 years of 2.4% (FAO 2000). A significant part of the increase in P fertilizers may enter the aquatic reservoir if conservation practices and erosion control are not implemented on a very large scale.
12.4.1.2 Eutrophication and Carbon Sequestration
Elevated net primary production associated with eutrophication would seem to favor carbon sequestration. However, when recycling of C through decomposer chains prevails on sedimentation in rivers and lakes, these systems behave as sources of CO2 since their CO2 partial pressure (pCO2) is higher than that of the atmosphere. In a survey of pCO2 in the surface water of 1,835 lakes around the world, 87% of the samples were supersaturated (mean pCO2: 1,034 (atm) (Cole et al. 1994). In highly polluted aquatic systems, the pCO2 may reach higher values, such as 5,700 (atm in the upper estuary of the Scheldt River, which receives industrial and urban wastes from France, Belgium, and the Netherlands (Frankignoulle et al. 1996).
The net global C budget of inland waters has been approached from a different point of view. From their measurements on lakes, Cole et al. (1994) have estimated the potential release of CO2 from lakes at about 0.14 billion tons of carbon per year, which is about half as large as riverine transport of organic and inorganic C to the ocean. This indicates that terrestrial systems, among which forests are usually considered as C sinks, export some organic matter that later contributes to CO2 emission. From considerations of primary production, Dean and Gorham (1998) estimated that lakes are currently accumulating organic C at an annual rate of about 42 teragrams a year. Most of the C in all but the most oligotrophic of these lakes is primary production in the lakes themselves. The sediments of reservoirs accumulate an additional 160 teragrams annually, and peatlands contribute 96 tera- grams annually. These three C pools collectively cover less than 2% of Earth’s surface and constitute a C sink of about 300 teragrams a year.
12.4.1.3 Marine Dead Zones
Low oxygen conditions in coastal marine waters are primarily the result of enrichment in nitrogen with consequent enhanced growth of phytoplankton. These nitrogen-fed phytoplankton sink to the sea floor when they die, and the organic matter is regenerated by bacterial activity, consuming oxygen. At low oxygen concentrations, most marine life is unable to survive, leading to the designation of ‘‘marine dead zones.’’ The size of these reaches up to 70,000 square kilometers (Brian et al. 2004), and they have been reported off South America, Japan, China, Australia, New Zealand, and the west coast of North America. The number of such areas has doubled every decade as more and more artificially produced nitrogen fertilizers are used in agriculture and as human population increases result in increased nitrogen containing sewage effluent.
The hypoxic conditions are seasonal in some regions, such as the Gulf of Mexico (fed by nutrients from the Mississippi River) and off the coast of Oregon, where low oxygen conditions have appeared in recent years. The Oregon events are related to upwelling conditions when north winds displace surface waters and deep waters rise as replacements. These deep waters have high nutrients, but in recent years have also had low oxygen content. Benthic populations, such as crabs, are quickly affected by such conditions and can provide useful indicators for early warning of low oxygen.
The occurrence of dead zones and their size appears to be a function of nitrogen inputs, which continue to grow in most parts of the world. Denitrification (which returns nitrate to the atmosphere as N2 and N oxides) takes effect only when oxygen concentrations are already low and so becomes effective only after the dead zone phenomenon has occurred. In the future, this phenomenon may be as important as overfishing in the decline of fisheries. (See Chapter 18 for more on marine fisheries.)
12.4.2 Nutrient Deficiencies
A significant proportion of agricultural soils, mainly located in developing countries, are suffering nutrient deficiencies. Similar situations may occur in coastal and marine systems as a result of shortage of water flow from terrestrial systems, or naturally in the high nutrient, low chlorophyll zones, where deficiencies in Si and Fe limit primary production.
12.4.2.1 Agricultural Soils
The fertility of any soil will decline if the nutrient content of the harvest removed from the system (as grain, timber, livestock, and so on) exceeds the nutrient input from natural and anthropogenic sources. In general, the nutrient balances in the industrial world are positive, especially for N, as crops use less than half of the applied fertilizer, leading to the eutrophication problem just described. In large areas of South America (Wood et al. 2000) and Africa (Smaling et al. 1997; Sanchez 2002), on the other hand, the nutrient balance is negative, leading to declining soil fertility. In the case of South America, the magnitude of the imbalance appears to be decreasing as incomes rise and farmers can afford more fertilizer. In Africa, the cost of fertilizer to low-income farmers is usually prohibitive.
The situation is exacerbated by two factors: ecological features and farmers’ perception of risk in many of the poorest developing regions. First, much of the agricultural population in nutrient- deficient areas lives on soils derived from basement rocks, on very old, stable land surfaces. The P and base cation content of these soils is inherently low; as a result, natural biological N fixation is also low. Because the soils are sandy and low in organic C, they lose N through leaching. Their low N status leads them to be burned frequently (since the grass that grows on them is too low in N for cattle to digest in the wintertime), causing further N loss. Nitrogen is the key component of protein, and it is precisely these areas that show a steady decline in per capita protein consumption, to levels well below the recommended daily intake. The same areas also show high levels of stunted growth associated with malnutrition (Scholes and Biggs, in press).
Where farmers perceive that there is a risk of not achieving an acceptable level of yield at harvest (perhaps because of drought) to cover their input costs, they are often unwilling to invest in fertilizers to replace nutrients like P and K removed in the harvested produce.
12.4.2.2 High Nutrient, Low Chlorophyll Regions of the Ocean
Large parts of the ocean are characterized by the presence of adequate N and P in the euphotic zone but low phytoplankton biomass and low primary and new production (Minas et al. 1986). The best known of these regions are between the coast of Ecuador out to the Galapagos Islands, the equatorial Pacific out to the dateline, the northeast Pacific, and portions of the Southern Ocean.
Open ocean fertilization experiments have shown the first of these to be limited by Fe (Coale et al. 1996). Responses to Fe additions have been observed in the Southern Ocean as well, but with limited effects on phytoplankton productivity and growth rates. The equatorial Pacific is chronically low in Si(OH)4 with some secondary effects due to the relatively low Fe concentrations (Ku et al. 1995). The Southern Ocean north of the polar front has been identified as a low Si(OH)4 region (Dugdale et al. 1995). The origin of this condition is now understood as the result of a seasonal drawdown of Si(OH)4 by diatoms, which proceeds southward over the course of the austral summer. Drawdown of NO3 is small compared to the uptake of Si(OH)4, a condition that may be related to low Fe (Takeda 1998). However, unusually high Si(OH)4 uptake by diatoms can result from other processes that slow their growth (Claquin et al. 2002).
The interest in high nutrient, low chlorophyll regions has been sparked by the possibility of increasing their productivity through fertilization, with relatively small quantities of Fe and/or Si. This has been suggested as an option for slowing the increase in atmospheric CO2. However, the scientific understanding of the consequences of full-scale implementation of such an action remains insufficient for adequate assessment.
12.4.3 Threats to the Global Marine Nutrient Cycling System
Global marine nutrient cycling is beginning to be understood in spite of the complex interactions among physical, chemical, and biological processes that occur across the moving boundaries of water masses. Several processes require examination, as each may be a significant source of increased or decreased services in the future.
First, N fixation seems to be enhanced when Fe and P are added (Beherenfeld and Kolber 1999; Bidigare and Ondrusek 1996; Sanudo Wilhelmy et al. 2001; Karl et al. 1997, 2002). Since the expansion of the Sahara in the early 1970s, the dust load has increased nearly fourfold (Prospero and Nees 1986). Furthermore, Tegen and Fung (1995) have shown that about half the dust reaching the Equatorial Atlantic is due to disturbed soil conditions, and this dust contains more Fe than undisturbed desert dust. Increased N availability is likely to increase C fixation and its further sequestration in sediments and would therefore constitute a positive contribution to mitigation of climate change.
Second, denitrification is considered a useful process in the elimination of part of the N burden in estuaries and coastal areas, whereas it may limit production in N-limited areas, as N fixation is severely limited by Fe and Si availability (Naqvi et al. 2000; Codispoti and Christensen 1985). This is thought to be the current state of the world’s oceans. If so, this would imply that oceanic biological processes (as distinguished from the physical dissolution of CO2 into water due to increased partial pressures of CO2 in the atmosphere) are actually adding C to the atmosphere instead of removing it (e.g., Falkowski 1997).
Third, increased NH4+ from terrestrial effluents inhibits the ability of diatoms to use NO3-. In San Francisco Bay, a longterm decline in productivity has been ascribed to increased NH4 concentrations of anthropogenic origin (Karl et al. 2001). However, the Anamnox process (oxidization of NH4 into free N by reaction with nitrite) is likely to mitigate the problem in anoxic areas (Devol 2003).
Fourth, decreased productivity is linked to reduced inputs of Si and Fe from terrestrial sources. Changes in the input of Si(OH)4 from rivers as a result of damming and changes in farm practices may also have an impact on the productivity of marine diatoms (Leynaert et al. 2001). When Si(OH)4 concentrations fall below about 2 μM, other algal groups are able to outcompete diatoms, potentially leading to the dominance of less desirable or even toxic bloom species.
12.5 Monitoring and Assessment
Given the large diversity of mechanisms, pools, and fluxes involved in nutrient cycling, decision-makers face a large number of different, although closely related issues. (See Table 12.5.) For example, eutrophication of fresh water, which is mainly a consequence of excessive nutrient inputs and mismanagement of wastes at the landscape scale, is aggravated by atmospheric N deposits and by the reduction of plant cover and biodiversity at the plot and landscape scales. Once the pools, fluxes, or mechanisms relevant to the particular issue have been identified, adequate indicators or descriptors of their sizes or intensity can be identified and monitored. (See Table 12.6.)
|
Table 12.5. Problems in Ecosystem Functioning Linked to Nutrient Cycling Dysfunctions and Indicators to Assist Diagnostic. Numbers of scales in the first column relate to classification of scales made in section 12.2.3. Scales Dysfunction Observed Possible Diagnostic Indicators Terrestrial 1–2: Micro plant growth limited by unexpected nutrient deficiencies microbial diversity modified diversity in microfoodwebs communities (micro- and meso-fauna) beneficial or key microorganisms (N-fixers; mycorrhizae; white rot fungi) absent nodulation in legumes fungal or bacterial diseases impairment of soil structure preventing optimal function of foodweb controls Maturity Index (Bongers 1990) 3–4 Ecosystem soil compaction and erosion abundance and functional diversity of plants and soil natural tillers (earthworms, termites, ants) insufficient to allow adequate regulation of microbial communities and soil structure synthetic indices of soil quality (Vélasquez 2004; Ruiz-Camacho 2004) deficient water infiltration C losses 5: Landscape groundwater and adjacent freshwater systems loaded with nitrates and phosphates leakage due to dysfunction of regulations at scales 1—4 not mitigated by the presence of suitable buffer zones for nutrient absorption and refugia for useful soil fauna landscape metrics given by analysis of composition and structure of landscape erosion insufficient C supply for faunal activities 6: Global soil nutrient depletion at large scales unbalanced nutrient budgets for terrestrial biomes inadequate management options erosion, indices of soil quality crop production lack of formation and financial support indicators of human development Fresh Water 1–2: Micro algal blooms eutrophication (nutrient excess loading) OECD trophic levels (based on total P, chlorophyll, transparency in lake water) 3–4: Ecosystem changes in fish communities aquatic habitat destruction; increased input of suspended solids from land erosion in rivers, changes in water regime; natural habitat diversity; invertebrates and fish communities structure fish kills eutrophication; excess nutrient and organic matter load, pollution by pesticides or other humanmade substances low oxygen in rivers and anoxia in deep layers of lakes 5: Landscape decrease in inland fisheries decrease in water quality and in self-epuration capacity; increased control on river flows (dam construction, canals, regulated river, etc.) decrease in aquatic biodiversity and in habitat diversity changes in riparian vegetation pollution (nutrients and chemicals) total N and P in water 6: Global decrease in availability of fresh water (drinking water) alteration of the self-epuration capacity total N and P in water Marine and Coastal 1–2: Micro algal blooms fish kills changes in N-cycling microbial communities due to sewage effluents (nutrients and heavy metals) changes in microbial communities 3–4: Ecosystem algal blooms fish kills organic matter loading producing hypoxia low oxygen concentration decreases in productivity; decreased fish catches reduced water and nutrient flows from terrestrial ecosystems (damming, irrigation, industrial use of water) low chlorophyll concentration 5: Landscape eutrophication (algal blooms fish kills) habitat disturbance (landfill, mangrove/seagrasses clearing/disruption of estuaries) habitat structure in coastal environments impaired regulation of populations of primary producers by fishes due to overfishing decreasing trend in fish catches 6: Global eutrophication in non-directly affected areas nutrient overloading of major current systems nutrient load in water Although alterations in nutrient cycling are generally observed at scales from plot to landscape and region, the mechanisms involved are generally operating at much smaller scales. Efforts to improve the general quality of nutrient cycling could improve from fine-tuning the inputs to the needs of cultivated plants as much as possible, in order to limit the risk of leakage from terrestrial ecosystems to groundwater and to freshwater and marine systems, and through greater attention to the state of the various buffering systems described earlier. In practice, the best indicators of nutrient cycling efficiency will be measured at the plot level (diversity and cover of plants and indicators of quality based on soil fauna communities) and at the landscape level (density and distribution of buffering zones such as riparian forests, diversity of land use types in mosaics). Links between diversity at these two scales and adequate nutrient cycling have been observed in a number of studies (Wardle et al. 1999; Niklaus et al. 2001; Reich et al. 2001; Tilman et al. 2001). Cover crops, diversification of land use types in time (rotations) and space, no-tillage practices at the plot scale, and the use of hedgerows, riparian forests, and wetlands have all been shown to improve the tight cycling of nutrients (Nair 1993; Palm 1995; Entry and Emmingham 1996; Inamdar et al. 1999; Fassbender et al. 2000). |
Table 12.6. Biophysical Structures That Allow Regulation of Nutrient Cycling at Different Scales, Processes Involved, and Indicators of Their Functionality Scale Biophysical Structures (self-organizing systems) Process Indicators of Service Human Alterations Indicator of Alteration Micro soil + sediments: microaggregates waters: water column microfoodweb effects soils: maturity index (Bongers 1990) all: diversity in microfoodwebs communities (microand meso fauna) organic and chemical contamination fertilizer and pesticide application Ecosystem biogenic structures created by roots and bioturbators habitat creation modified access to resources regulation of hydraulic properties and organic matter dynamics physical structure of soils and sediments bioindicators of soil quality (Ruiz-Camacho 2004, Vélasquez 2004) bioindicators of fresh water quality (AFNOR 1992) organic and chemical contamination physical disruption (tillage) fertilizer and pesticide application description of tillage and other practices herbivory, foodweb effects acceleration of nutrient release from living plant biomass CH4 production in cattle guts nutrient balances at plot level monitoring at plot level conversion of natural and crop systems to pastures grazing pressure saprophagy, comminution changes in decomposition rates monitoring decomposition rates organic and chemical contamination land use practices incorporation in stable aggregates organic matter sequestered invertebrate communities (bioindicators of soil quality) distribution of organic matter in particle size fractions quality of organic matter produced by primary producers influence rates and pathways of nutrient cycling and release chemical analysis of plant material: C: nutrient ratios, phenolic compounds change in plant cover N—fixing primary producers; ligneous vs. herbaceous texture and structure of soils and sediments; variations in ecosystem and landscape regulation of nutrient storage and release texture, nature of clay minerals, effective calcium carbonate porosity, aggregation fertilization sedimentation and dust deposits physical disruption, compaction of soils and sediments external inputs (fertilizers, deposits, importation) texture, formation of dunes (desert ecosystems) tillage, grazing pressure Landscape vertical distribution in soils and water columns transfers and losses monitoring concentrations along soil profiles and water columns and sediments intensification of agriculture and forestry changes in landscape composition and structure (remote sensing mosaic of ecosystems (patches, ecotones, and buffering zones) buffering zones regulating transfer of nutrient between domains (terrestrial to aquatic) transfer from continent to rivers and oceans composition of landscape/seascape as assessed by remote sensing techniques (fragmentation, homogeneity, shape etc. indices) eutrophication erosion rates, stream discharge urbanization pollution fertilizer application detergent use N–-fixation in agriculture and forestry population density socioeconomic indicators (education, wealth Global homeostatic interactions among atmosphere, lithosphere, and biosphere on Earth transport across oceans (conveyer belts) and continents (dust depositions) remote sensing measurement of dust clouds ocean stream monitoring climate change global climatic parameters However, with a few exceptions, the mechanisms that link measurements of landscape features and plant and invertebrate diversities and so on to nutrient cycles have not been established satisfactorily, nor have thresholds for degradation of their diversity been established. This is in part due to a lack of extensive datasets that would allow statistical relationships to be established. However, the apparently large time lag between the loss of biological diversity and the impairment of soil functions might obscure significant statistical relationships (Lavelle et al. 2004). (Ecosystems and Human Well-Being: Volume 1: Current State and Trends: Nutrient Cycling)
12.6 Implications of Altered Nutrient Cycles for Human Well-being
Nutrient cycling and soil or water fertility play key roles in terrestrial and aquatic systems, and these roles benefit many segments of society. Substantial human benefits are derived directly and indirectly from nutrient cycling and fertility services.
Principally, millions of people earn their living from the production of commodities, such as food and other products, yielded by terrestrial and aquatic systems. The livelihoods of many rural households in developing countries in particular are highly dependent on direct harvesting of wild foods and non-food products. (See Chapters 18 and 26 for more on livelihoods based on food production.) More generally, benefits are derived directly from the use of noncommercialized ecosystem products generated by the fertility service of terrestrial and aquatic systems, such as biodiversity and its services. Thus nutrient cycling and fertility are essential for supporting the supply of farmed and wild products and the benefits people derive from their consumption and use.
Various approaches and methods have been developed to value nutrient cycling and fertility services. These methods can be grouped into two broad categories: benefit-based and cost-based approaches. (See Chapter 2.) The most commonly used benefitbased method is the production function approach that measures the marginal contribution of fertility to the total value of generated products after accounting for the marginal contribution of all other inputs and factors used in the production process. Examples of studies that have used such an approach to quantify relationships include yield reduction (productivity loss) versus land degradation (Aune and Lal 1995; Lal 1995). The most researched land degradation factors are soil erosion and nutrient mining in the United States (Hertzler et al. 1985; Burt 1981; Pierce et al. 1984), Mali (Bishop and Allen 1989), Zimbabwe (Grohs 1994), and Ethiopia (Sutcliffe 1993).
In principle, this method is applicable to both commercialized and noncommercial products of terrestrial and aquatic systems. However, it is relatively easier to apply to situations where products are commercially exploited and marketed and where the value of products directly harvested from the wild for noncommercial use is usually calculated using prices and values of similar products exchanged in the market. But the accuracy and realism of figures derived from the production function approach is questionable. A fundamental assumption of this method is that the market prices of agricultural outputs reflect their marginal costs of production; in most economies, market distortions (such as U.S. and European farming subsidies) ensure that market prices are not equal to marginal costs.
Among the most commonly used cost-based approaches is the replacement cost method. This uses the value of commercial fer- tilizers needed to maintain stable levels of productivity (or natural fertility) as a proxy for the value of this ecosystem service. However, the replacement cost method generally underestimates the marginal contribution of natural fertility to production, as it assumes perfect substitutability between natural and manufactured fertility. It is known that this is not the case, although economic theory struggles to suggest the replacement value of natural processes for which no human-made process is a full substitute (see Freeman 1993 for a further discussion of this issue).
As an illustrative approximation, the nitrogen made available through cycling and nonagricultural biological nitrogen fixation on land totals around 5,000 teragrams a year. Hence, at a global average price of nitrogen fertilizer ($1,100 per ton of nitrogen), its annual replacement value is $5.5 trillion. Even if only the cy- cling on agricultural fields is considered, the total annual replacement value is around $1.1 trillion. Similarly, the estimate for phosphorus is 60 teragrams a year on land, with a annual replacement value of $240 billion, and of $48 billion for agricultural lands only. As marine systems are not deliberately fertilized, such an approach does not apply, but nutrient cycling is essential in support of coastal and ocean fisheries.
More-recent approaches to the valuation of the nutrient cycling service, such as the Habitat Equivalent Analysis, although they have not yet been applied in a comprehensive manner, would certainly provide much lower figures (Huguenin et al. in press). Other measures of the value of soil nutrients stocks include user cost or resource rent estimated as the dynamic price or production value lost to future generations from a unit of the nutri- ents’ stock depleted today (Hertzler et al. 1985; Brekke et al. 1999; Nakhumwa 2004).
Nutrient cycling and fertility also generate noncommercial but nevertheless important benefits for various groups in society. They increase the risk-buffering capacity of agroecosystems—that is, the capacity of these systems to respond to environmental, climatic, and economic risks by adapting to these stresses without decreasing their productive capacities. The specific ecological mechanisms through which this occurs have not been fully documented, but it appears that belowground biodiversity plays an important role in this regard (Lavelle et al. 2004). Small-scale farmers in developing countries are particularly exposed and vulnerable to these forms of risk (Izac 2003). It is particularly difficult, both conceptually and empirically, to calculate the economic value of this enhanced capacity to manage risks. This enhanced capacity can also be thought of as a contribution to the long-term maintenance of the productive capacity of a system or to its sustainable use, so future generations will also benefit from this.
There are other issues related to the negative effects of service impairment that occur outside the immediate area where fertility is declining. For instance, soil erosion is particularly important and creates on-site and off-site (externality) effects, and economic evaluation of soil erosion is therefore not complete without the inclusion of costs and benefits for both on- and off-site effects. These may include the cost of dredging silted dams and of restoring impaired inland and coastal aquatic systems, in addition to the direct cost of fertilizer applications. Generally only anecdotal evidence is available concerning the costs of impaired aquatic systems, although estimates of the benefits and costs of nutrient loading for specific fisheries have been provided (UNEP 2002)
The historical changes in nutrient cycling and fertility analyzed in this chapter affect human well-being in two different ways. The first is directly, through changes in the perceived benefits or values of these ecosystem services from an anthropogenic perspective. Some of these changes in well-being are relatively easy to quantify in monetary terms; others are much more difficult to assess in this way, but nevertheless affect extremely important dimensions of human livelihoods. The second way in which human well-being is affected by these changes is through specific benefits that are currently not explicitly valued by society but that may have significant future ecological and welfare implications, such as the capacity of organisms involved in the marine nitrogen cycle to respond to global environmental changes.
In the case of terrestrial systems, negative trends in fertility and nutrient cycling have historically been remedied by greater and greater applications of fertilizers (inorganic and organic). However, such remedies can mask the effects of these trends only to a degree and can also result in increased costs of production. World fertilizer consumption increased rapidly in the 1970s and 1980s but slowed down in the 1990s, partly due to environmental legislation in industrial countries. (See Chapter 26.)
In the case of coastal and marine systems, high anthropogenic nutrient loads have resulted in anoxia and loss of fisheries, changes in the composition of inorganic nitrogen, declining productivity in some estuaries, and changes in species composition of the phytoplankton. (See Chapter 19.) These undesirable effects are directly related to agricultural fertilization and animal husbandry practices and to human population increases. Although many industrial countries are able to mitigate some of these effects through sewage treatment practices and in some cases control of agricultural practices, such mitigation is not universal.
Many countries have coped with the decreasing profitability of agriculture, caused in part by the necessity to supplement the natural nutrient cycle with fertilizers, by providing direct public subsidies to primary producers. Although low crop productivity across sub-Saharan Africa cannot be attributed entirely to increased costs of production, it is clear that deterioration in ecosystem services related to fertility has had a direct impact on productivity and subsequent rural livelihoods. Claims that fertility depletion is the single most important cause of poverty in sub- Saharan Africa have not been supported by empirical evidence and failed to consider the myriad of other factors that also contribute to the highest rural poverty in the world. It is, however, undeniable that a net loss in nutrient cycling services that are essential for primary production has a negative effect on the financial situation of the rural poor.
One consequence of the changes documented in this chapter is the loss of sustainability, or resilience, in production systems. This is mainly, but not uniquely, through a loss of nutrient stocks, sequestered carbon, and biodiversity. This consequence is particularly important for future generations of farmers and particularly so in cases where threshold levels of irreversibility seem to have been reached. In these cases, this generation’s running down of natural capital is either increasing costs of production for future generations of farmers or, in some cases, is closing off future production options altogether.
References
- AFNOR (Association Franç aise de Normalisation), 1992: Détermination de l’indice biologique global normalisé (IBGN). NF T 90–350, Paris.
- Aune, J.B. and Lal, R., 1995: The Tropical Soil Productivity Calculator. A model for assessing effects of soil management on productivity’, in R. Lal and B.A. Stewart, eds., Soil Management: Experimental Basis for Sustainability and Environmental Quality. Advances in Soil Science, Boca Raton: CRC Press, Lewis Publishers, pp. 499–520.
- Barber, R.T., M.P. Sanderson, S.T. Lindley, F. Chai, J. Newton, et al., 1996: ‘‘Primary productivity and its regulation in the equatorial Pacific during and following the 1991–1992 El Nino.’’ Deep Sea Res II 43: 933–969.
- Behrenfeld, M.J., and Z.S. Kobler, 1999: Widespread iron limitation of phytoplankton in the South Pacific Ocean. Science, 283:840–843.
- Bennet, E.M., S.R. Carpenter and N.F. Caracao, 2001: Human impact on erodable phosphorus and eutrophication: a global perspective. Bioscience 51 227–234.
- Berc, J., R. Lawford, J. Bruce, L. Mearns, D. Easterling, et al., 2003: Conservation Implications of Climate Change: Soil Erosion And Runoff From Cropland: A Report from the Soil and Water Conservation Society. Soil and Water Conservation Society, Ankeny, Iowa.
- Bernier, N., and J.F. Ponge, 1994: Humus form dynamics during the sylvogenetic cycle in a mountain spruce forest. Soil Biol. Biochem. 26:183–220.
- Bidigare, R.R. and M.E. Ondrusek, 1996: ‘‘Spatial and temporal variability of phytoplankton pigment distributions in the central equatorial Pacific Ocean.’’ Deep Sea Res Part 2 43(4–6): 809–834.
- Billen, G. and J. Garnier, 1999: Nitrogen transfers through the Seine drainage network: a budget based on the application of the ‘Riverstrahler’ model. Hydrobiologia 410: 139–150.
- Bishop, J. and J. Allen, 1989:The On-Site Costs of Soil Erosion in Mali, Working Paper No.21. The World Bank, Environmental Department, Washington, DC.
- Bohn, H.L., B.L. McNeal, and G.A. O’Connor, 1979: Soil Chemistry. John Wiley & Sons.
- Bongers, T., 1990: The maturity index: an ecological measure of environmental disturbance based on nematode species compostion. Oecologia 83:14–19.
- Brasseur, G.P., P. Artaxo, L.A. Barrie, R.J. Delmas, I. Galbally, et al., 2003: An integrated view of the causes and impacts of atmospheric changes. In: Brasseur, G.P., R.G. Prinn, A.A.P. Pszenny (eds.) Atmospheric Chemistry in a changing world. IGBP Series, Springer: Berlin pp. 207–230.
- Brekke, K.R., Iversen, V., and Aune, J.B., 1999: Tanzania’s Soil Wealth. Environment and Development Economics 4(1999), pp 333–356.
- Broecker, W.S. and T.-H. Peng, 1982: Tracers in the Sea. Eldigeo Press, Palisades, New York.
- Buesseler, K.O., 1998: The decoupling of production and particulate export in the surface ocean Global Biogeochem. Cycles. 12: 297–310.
- Burt, O.R., 1981: ‘Farm Level Economics of Soil Conservation in the Palouse Area of the Northwest.’ American Journal of Agricultural Economics 63(1): 83–92.
- Casciotti, K.L., D.M. Sigman, and B.B. Ward, 2003: Linking diversity and stable isotope fractionation in ammonia-oxidizing bacteria. Geomicrobiology Journal 20:4.
- Cadisch, G., and K. E. Giller, eds. 1997: Driven by Nature. CAB International, Wallingford, U.K.
- Carpenter, E.J., J. Montoya, J. Burns, M. Mulholland, A. Subramanian, and D.G. Capone, 1999: Extensive bloom of N2 fixing symbiotic association in the tropical Atlantic Ocean. Marine Ecology Progress Series. 185:273–283.
- Chauvel, A., M. Grimaldi, E. Barros, E. Blanchart, T. Desjardins, M. Sarrazin, and P. Lavelle 1999: Pasture degradation by an Amazonian earthworm. Nature 389:32–33.
- Cinderby, S. H.M. Cambridge, R. Herrera, W.K. Hicks, J.C.I. Kuylenstierna, F. Murrary, and K. Olbrich, 1998: Global Assessment of Ecosystem Sensitivity to Acidic Deposition. Stockholm Environment Institute, Sweden.
- Claquin, P., V. Martin-Jezequel, J.C. Kromkamp, M.J. Veldhuis, and G.W. Kraay, 2002: ‘‘Uncoupling of silicon compared with carbon and nitrogen metabolisms and the role of the cell cycle in continuous cultures of Thalasiosira pseudonana (Bacillariophyceae) under light, nitrogen and phosphorus control.’’ J.Phycol. 38: 922–930.
- Coale, K., K.H. Coale, K.S. Johnson, S.E. Fitzwater, R.M. Gordon, et al., 1996: ‘‘The IronEx-II experiment produces massive phytoplankton blooms in the Equatorial Pacific.’’ Nature 383: 495–501.
- Codispoti, L. A., and J. P. Christensen, 1985: Nitrification, denitrification and nitrous oxide cycling in the eastern tropical South Pacific Ocean. Mar. Chem. 16: 277–300.
- Cole, J.J., N.F. Caraco, G.W. Kling, and T.K. Kratz, 1994: C dioxide supersaturation in the surface waters of lakes. Science 265: 1568–1570.
- Dean, W.E. and Gorham, E., 1998: Magnitude and significance of carbon burial in lakes, reservoirs, and peatlands. Geology, Vol. 26, no. 6, pp. 535–538.
- De Master D.J., 2002: The accumulation and cycling of biogenic silicon in the Southern Ocean: revisiting the marine silicon budget. Deep-Sea Research Part II, 49: 3155–3168.
- DeRuiter, P. C., J. A. Vanveen, J. C. Moore, L. Brussaard, and H. W. Hunt. 1993: Calculation of nitrogen mineralization in soil food webs. Plant and Soil157:263–273.
- Devol, A. H. 2003: Solution to a marine mystery. Nature 422: 575–576.
- Dubroeucq, D., D. Geissert, I. Barois, and M-P. Ledru, 2002: Biological and mineral features of Andisols in the Mexican volcanic highlands. Catena 49, 183–202.
- Duce, R.A., 1995: Sources, distributions, and fluxes of mineral aerosols and their relationship to climate. In: Charlson, R., Heintzenberg, J. (Eds.), Aerosol Forcing of Climate. Wiley, New York, pp. 43–72.
- Dugdale, R.C., 1976: Nutrient Cycles, p. 467,In J. J. Walsh, ed. The Ecology of the Seas. W.B.Saunders, Philadelphia.
- Dugdale, R.C., F.P. Wilkerson, and H.J. Minas, 1995: The role of a siliconte pump in driving new production. Deep-Sea Res. (I Oceanogr. Res. Pap.) 42:697–719.
- Entry, J. A., and W. H. Emmingham, 1996: Nutrient content and extractability in riparian soils supporting forests and grasslands. Applied Soil Ecology 4:119– 124.
- Falkowski, P.G., 1997: Evolution of the nitrogen cycle and its influence on the biological sequestration of CO2 in the ocean. Nature 387: 272–275.
- Falkowski, P., R.J. Scholes, E. Boyle, J. Canadell, D. Canfield, et al., 2000: The global C cycle: A test of our knowledge of Earth as a system. Science 290, 291–296.
- FAO (Food and Agriculture Organization), 2000: Fertilizer Requirements in 2015 and 2030. Rome.
- Fassbender H.W., L. Alpizar, J. Heuveldop, H. Fölster, and G. Enrique, in press: Modeling agroforestry systems of cacao (Theobroma cacao) with laurel (Cordia alliodora) and poro (Erythrina poeppigiana) in Costa Rica. III. Cycles of organic matter and nutrients. Agroforestry Systems: 49–62.
- Fortescue, J.A.C., 1980: Environmental Geochemistry: a Holistic Approach. Springer-Verlag,, New York, NY.
- Frankignoulle, M., I. Bourge, and R. Wollast, 1996: Atmospheric CO2 fluxes in a highly polluted estuary (the Scheldt). Limnol. Oceanogr. 41: 365–369.
- Franzluebbers, A.J., J.A. Stuedemann, H.H. Schomberg, and S.R. Wilkinson, 2000: Soil organic C and N pools under long-term pasture management in the Southern Piedmont USA. Soil Biology and Biochemistry 32:469–478.
- Frink, C.R., P.E. Waggoner, and J.H. Ausubel, 2001: Nitrogen on the Land: Overcoming the Worries. Lifting fertilizer efficiency and preserving land for non farming. Pollution Prevention review, 11(3): 77–82
- Freeman, A.M. III, 1993: The Measurement of Environmental and Resource Values (1st and 2nd eds.). Resources for the Future.
- Fung, I.Y., S. Meyn, and I. Tegen, 2000: Iron supply and demand in the upper ocean. Global Biogeochemical Cycles 14, 281–295.
- Galloway, J.N. 2003: Acid deposition: S and N cascades and elemental interactions. In Interactions in the major Biogeochemical Cycles. (eds.) Melillo, J.M., Field, C.B. and Moldan, B. SCOPE 61, Island Press, Washington. pp 259– 272.
- Garnier, J., J. Némery, G. Billen, and S. Théry, 2004: Nutrient dynamics and control of eutrophication in the Marne River system: modelling the role of exchangeable phosphorus. Journal of Hydrology.
- Grantham, B.A. F. Chan, K.J. Nielsen, D.S. Fox, J.A. Barth, et al., 2004: Upwelling-driven nearshore hypoxia signals ecosystem and oceanographic changes in the northeast Pacific. Nature 429, 749–754
- Green, P., C.J. Vörösmarty, M. Meybeck, J. Galloway, and B.J. Peterson, 2004: Pre-industrial and contemporary fluxes of nitrogen through rivers: A global assessment based on typology. Biogeochemistry, 68(1), 71–105.
- Grohs, F., 1994: Economics of Soil Degradation, Erosion and Conservation: A Case Study of Zimbabwe. Wissenschaftsverlag Vauk Kiel KG, Kiel, Germany.
- Haycock N.E., G. Pinay, C. Walker, 1993: Nitrogen retention in river corridors: European perspective. Ambio 22:340–346.
- Hecky, R.E., F.W.B. Bugenyi, P. Ochumba, J.F. Talling, R. Mugidde, et al., 1994: Deoxygenation of the deep water of Lake Victoria, East Africa. Limnol. Oceanogr. 39: 1476–1481.
- Hertzler G., C.A. Ibanez-Meier, and R.W. Jolly, 1985: User Costs of Soil Erosion and their Effect on Land Agricultural Prices. Costate Variables and Capitalised Hamiltonian. American Journal of Agricultural Economics, 67(5) December: 948–1009.
- Howarth, R.W., D. Anderson, J. Cloern, C. Efring, C. Hopkinson, et al., 2000 Nutrient pollution of coastal rivers, bays and seas. Issues in Ecology 7: 15.
- Huguenin, M.T., C.G. Legett, and R.W. Paterson, in press: Economic valuation of soil fauna. European Journal of Soil Biology.
- Hutchinson, G.E., 1957: A treatise on limnology. 1. Geography, Physics and Chemistry. John Wiley and Sons, New York, 1015 p.
- Inamdar, S.P., R.R. Lowrance, L.S. Altier, R.G. Williams, and R.K. Hubbard, 1999: Riparian Ecosystem Management Model (REMM): II. Testing of the water quality and nutrient cycling component for a Coastal Plain riparian system. Transactions of the Asae 42:1691–1707.
- Izac, A-M.N., 2003: Economic aspects of soil fertility management and agroforestry practices. In, Trees, Crops and Soil Fertility. Concepts and Research Methods, eds. G. Schroth and F. L. Sinclair, pp. 13–38. CABI, Wallingford, UK.
- Jacinthe, P.A., and R. Lal, 2001: A Mass Balance Approach to Asssess CO2 Evolution During Erosional Events. Land Degradation & Development 12:329– 339.
- Jenkinson D S., and Rayner J. H., 1977: The turnover of soil organic matter in some of the Rothamsted classical experiments. Soil Science 123:298–305.
- Karl, D.M., R. Letelier, L. Tupas, J. Dore, J. Christian, and D. Hebel, 1997: The role of nitrogen fixation in biogeochemical cycling in the subtropical North Pacific Ocean. Nature 388: 533–538
- Karl. D.M., R R. Bidigare, and R.M. Letelier, 2001: Long-term changes in plankton community structure and productivity in the North Pacific Subtropical Gyre: The domain shift hypothesis. Deep-Sea Research II 48: 1449– 1470.
- Karl, D., A. Michaels, B. Bergman, D. Capone, E. Carpenter, et al., 2002: Dinitrogen fixation in the world’s oceans. Biogeochemistry 57/58: 47–98.
- Krug, A., 1993: Drainage history and land use patterns of a Swedish river system. Their importance for understanding N and P load. Hydrobiologia 251:285–296
- Ku, T.L., S. Luo, M. Kusakabe, and J.K.B. Bishop, 1995: 228Ra-derived nutrient budgets in the upper equatorial Pacific and the role of ‘‘new’’ silicate in limiting productivity. Deep Sea Res II 42: 479–497.
- Kuylenstierna, J.C.I., H. Rodhe, S. Cinderby, and K. Hicks, 2001: Acidification in developing countries: ecosystem sensitivity and the critical load approach on a global scale. Ambio 30, 20–28.
- Lal, R., 1995: Erosion-Crop Productivity Relationship for Soils of Africa. Soil Sci. Soc. Am. J. 59: 661–667.
- Lal, R., 2001: Soil Conservation for C-sequestration, In D. E. Stott, et al., eds. Sustaining the Global Farm. Selected Papers from the 10th International Soil Conservation Organization Meeting held May 24–29, 1999 at Purdue University and the USDA-ARS National Soil Erosion Research Laboratory.
- Lal, R., 2003: Soil Erosion and the global C budget. Environment International 29:437–450.
- Lavelle, P. and A.V. Spain, 2001: Soil Ecology. Kluwer Scientific Publications, Amsterdam, 691p.
- Lavelle, P., D. Bignell, M. Austen, P. Giller, G. Brown, et al., 2004: Vulnerability of ecosystem services at different scales: role of biodiversity and implications for management. In D.H. Wall (ed.), Sustaining Biodiversity and Functioning in Soils and Sediments. Island Press, Washington, DC.
- Lee, G.F. and R.A. Jones, 1986: Detergent bans and eutrophication. Environmental Science and Technology, 20,330–331.
- Leynaert, A., P. Treguer, C. Lancelot, and M. Rodier, 2001: Silicon limitation of biogenic silica production in the Equatorial Pacific. Deep Sea Res I 48: 639–660.
- Lévêque, C. and Paugy, D., 1999: Les poissons des eaux continentales africaines. Diversité, écologie, utilisation par l’homme. Paris, IRD Editions, 521 p.
- Lucas, Y., F.J. Luizâo, A. Chauvel, J. Rouiller, and D. Nahon, 1993: The relation between biological activity of the rain forest and mineral composition of the soils. Science 260, 521–523.
- Mackenzie, F.T., L.M. Ver, and A. Lerman, 2002: Century-scale nitrogen and phosphorus controls of the C cycle. Chemical Geology, 190: 13–32.
- Mahowald, N., K.E. Kohfeld, M. Hansson, Y. Balkanski, S. Harrison, et al., 1999. Dust sources and deposition during the Last Glacial Maximum and current climate: a comparison of model results with paleodata from ice cores and marine sediments. Journal of Geophysical Research 104, 15895–16436.
- Mando, A., and R. Miedema, 1997: Termite-induced change in soil structure after mulching degraded (crusted) soil in the Sahel. Appl Soil Ecol 6:241–249.
- Martin, J., 1992: Iron as a limiting factor in oceanic productivity, in Falkowski and Woodhead (eds), Primary Productivity and Biogeochemical Cycles in the Sea. Plenum Press, New York.
- Minas, H.J., M. Minas, and T.T. Packard, 1986: Productivity in upwelling areas deduced from hydrographic and chemical fields. Limnology and Oceanography 31:1182–1206.
- Moore, J.K., S.C. Downey, D.M. Glover, and I.Y. Fung, 2001: Iron cycling, and nutrient-limitation patterns in surface waters of the World Ocean. Deep- Sea Res. II 49:463–507.
- Nadelhoffer, K.J., et al., 1999: Nitrogen Deposition Makes a Minor Contribution to C Sequestration in Temperate Forests. Nature 398:145–148.
- Nair, P. K. R. 1993: An Introduction to Agroforestry. Kluwer Academic Publishers/ ICRAF, Dordrecht.
- Nakhumwa, T. 2004: Dynamic costs of soil degradation and determinants of adoption of soil conservation technologies by smallholder farmers in Malawi. Unpublished PhD Thesis, University of Pretoria, Pretoria.
- Naqvi, S.W.A., D.A. Jayakumar, P.V. Narvekar, H. Nalk, V.S. Sarma, et al., 2000: Increased marine production of N2O due to intensifying anoxia on the Indian continental shelf. Nature 408: 346–349.
- Nelson D.M., P. Tregeur, M.A. Brzezinski, A. Leynaert, and B. Queguiner, 1995: Production and dissolution of biogenic silicon in the ocean: revised global estimates,comparison with regional data and relationship with biogenic sedimentation. Global Biogeochemical Cycles, 9: 359–372.
- Niklaus, P.A., P.W. Leadley, B. Schmid, and C. Korner, 2001: A long-term field study on biodiversity x elevated CO2 interactions in grassland. Ecological Monographs 71:341–356.
- Nixon, S.W. 1995: Coastal marine eutrophification: A definition, causes and future concerns. Ophelia 41, 199–219.
- NRC (National Research Council), 1992: Soil and water quality: An agenda for agriculture. National Academic Press, Washington DC.
- OECD (Organisation for Economic Co-operation and Development), 1982: Eutrophisation des eaux. Me´thodes de surveillance, d’e´valuation et de lutte. Paris, 164 pp.
- Palm, C.A., 1995:Contribution of agroforestry trees of nutrient requirements of intercropped plants. Agroforestry systems 30:105–124.
- Parton W. J., J.W.B. Stewart, and C.V. Cole, 1988: Dynamics of C, N, P and S in grasslands soils: a model. Biogeochemistry 5:109–131.
- Pate, J.S., 1968: Physiological Aspects of Inorganic and Intermediate Nitrogen Metabolism (with special reference to the legume, Pisum arvense L.). In Recent Aspects of Nitrogen Metabolism in Plants E.J. Hewitt and C.V. Cutting, (eds.) Academic Press, London, pp 219–240.
- Perry, D. A., 1995: Self-organizing systems across scales. TREE 10:241–245.
- Pierce F.J., W.E. Larson, R.H. Dowdy, and W.A.P. Graham, 1984: Soil Productivity in the Corn Belt: An assessment of erosion’s long-term effects. Journal of Soil and Water Conservation 39:131–136.
- Pimente, D., C. Harvey, P. Resosudarmo, K. Sinclair, D. Kurz, et al., 1995: Environmental and Economic Costs of Soil Erosion and Conservation Benefits. Science 267:1117–1123.
- Pinstrup-Anderson, P., R. Panya-Lorch, and M.W. Rosegrant, 1999: World food prospects: critical issues for the early twenty-first century. International policy Research Institute. Washington DC.
- Prather, M., D. Ehhalt, F. Dentener, R. Derwent, E. Dlugokencky, et al., 2001: Atmospheric chemistry and greenhouse gases. In: Climate change 2001: The scientific basis. Volume 1 of the Third Assessment Report of the Intergovernmental Panel on Climate Change. Cambridge University Press. Pp 239–288.
- Prentice, I.C., G.D. Farquhar, M.J.R. Fasham, G.L. Goulden, M. Heimann, et al., 2001: The C cycle and atmospheric CO2. In: Climate change 2001: The scientific basis. Volume 1 of the Third Assessment Report of the Intergovernmental Panel on Climate Change. Intergovernmental Panel on Climate Change Cambridge University Press. Pp 183–237 .
- Prospero, J.M. and R.T. Nees, 1986: Impact of the North African Drought and El Nino on mineral dust in the Barbados trade winds. Nature 320:735–738.
- Ramaswamy, V., O. Boucher, J. Haigh, D. Hauglustaine, J. Haywood, et al., 2001: Radiative forcing of climate change. In: Climate change 2001: The scientific basis. Volume 1 of the Third Assessment Report of the Intergovernmental Panel on Climate Change. Cambridge University Press. Pp 349–416.
- Redfield A.C., 1958: The biological control of chemical factors in the environment. American Scientist, 46: 205–221.
- Reeburgh, W.S., 1997: Figures Summarizing the Global cycles of biogeochemically important elements. Bull. Ecol. Society of America 78(4):260–267.
- Reich, P.B., J. Knops, D. Tilman, J. Craine, D. Ellsworth, et al., 2001: Plant diversity enhances ecosystem responses to elevated CO2 and nitrogen deposition (vol 410, pg 809, 2001). Nature 411:824–826.
- Reynolds, C.S., 1990: The Ecology of Freshwater Phytoplankton. Cambridge University Press, Cambridge, UK, 384 p.
- Ridgwell A., A. Watson, and D. Archer, 2002: Modeling the oceanic Si inventory to perturbation, and consequences for atmospheric CO2. Global Biogeochemical Cycles. 16:4.
- Ruiz-Camacho, N., 2004: Mise au point d’un système de bioindication de la qualité du sol base sur l’étude des peuplements de macro-invertébrés. 270p. Université Paris VI. Doctorate. Université Paris VI, Paris.
- Ryther, J.H., 1969: Photosynthesis and fish production in the sea. Science 166:72.
- Sanchez, P., 2002: Soil fertility and hunger in Africa. Science 295(5562): 2019– 2020.
- Sanudo-Wilhelmy, S.A., A. Kustka, D.G. Capone, D. Hutchins, C. Gobler, et al., 2001: Phosphorus limitation of N2 fixation in the central Atlantic Ocean. Nature 411:66–69.
- Scholes, R.J., E.D. Schulze, L.F. Pitelka, and D.O. Hall, 2000: Biogeochemistry of terrestrial ecosystems. In: The Terrestrial Biosphere and Global Change: Implications for Natural and Managed Ecosystems. B.H. Walker, W. Steffen, J. Canadell, and J. Ingram (eds). IGBP Book Series 4, Cambridge University Press. Pp 271–303.
- Scholes, R.J. and R. Biggs (in press): Report of the southern African regional scale Millennium Ecosystem Assessment. CSIR, Pretoria
- Schlesinger, W.H., 1997: Biogeochemistry: Analysis of Global Change. Second ed. Academic Press.
- Schulze E,D., 1989: Air pollution and forest decline in a spruce (Picea abies) forest. Science 244:776–783
- Smaling E.M.A., M.S. Nandwa, and B.H. Janssen, 1997: Soil Fertility in Africa Is at Stake. In: Replenishing Soil Fertility in Africa. Am. Soc. of Agr. and Soil Sci. Soc. of Am. Special Publ 51: 48–61.
- Smetacek, V., 2000: The giant diatom dump. Nature 406:574–575
- Smil, V., 1997: Cycles of Life: Civilisation and the Biosphere. Scientific American Library, New York. 221 pp.
- Smil, V., 2000: Phosphorous in the Environment: Natural Flows and Human Interferences. Annual Reviews of Energy and Environment 25:53–88.
- Smith, V.H., 1992: Effects of nitrogen:phosphorus supply ratios on nitrogen fixation in agricultural and pastoral systems Biogeochemistry 18: 19–35.
- Starr, G.C., R. Lal, R. Malone, D. Hothem, L. Owens, and J. Kimble, 2000: Modeling soil C transported by water erosion processes. Land Degradation & Development 11:83–91.
- Summerhayes, C.P., K.-C. Emeis, M.V. Angel, R.L. Smith, and B. Zeitzschel, 1995: Upwelling in the Ocean: Modern Processes and Ancient Records, p. 422, In B. Zeitzschel, ed. Upwelling in the Ocean: Modern Processes and Ancient Records. John Wiley and Sons, Chichester.
- Sutcliffe, J.P. 1993: Economic Assessment of Land Degradation in Ethiopian Highlands: A case study. Addis Ababa, Ethiopia: National Conservation Strategy Secretariat, Ministry of Planning and Economic Development.
- Swift, M.J. and P. Woomer, 1994: The Biological Management of Tropical Soil Fertility. Wiley-Sayce, New York.
- Takeda, S. 1998: Influence of iron availability on nutrient consumption ratio of diatoms in oceanic waters. Nature 393: 774–777.
- Tegen, I. and I.Y. Fung, 1995: Contribution to the mineral aerosol load from land surface modification. J. Geophys. Res., 100: 18,707–18,726.
- Tegen, I. and R. Miller, 1998: A GCM study on the interannual variability of soil dust aerosol. Journal of Geophysical Research 103, 25975–25995
- Tilman, D. and J. A. Downing. 1994: Biodiversity and stability in grasslands. Nature 367:363–365.
- Tilman, D., P.B. Reich, J. Knops, D. Wedin, T. Mielke, and C. Lehman, 2001: Diversity and productivity in a long-term grassland experiment. Science 294:843–845.
- Tréguer P., D.M. Nelson, A. J. Van Bennekom, D.J. DeMaster, A. Leynaert, and B. Queguiner, 1995: The balance of silicon in the world ocean: a reestimate. Science, 268: 375–379.
- Tréguer, P. and P. Pondaven, 2000: Global Change: silica control on carbon dioxide. Nature, 406: 358–359.
- UNEP (United Nations Environment Programme), 2002: Global Environment Outlook 3. Earthscan.
- Velasquez, E. 2004: Bioindicadores de calidad del suelo basados en comunidades de macrofauna y su relacion con variables fisicas e quimicas del suelo. 250p. Universidad Nacional de Colombia, Cali.
- Verschuren, D., D.N. Edgington, H.J. Kling, and T.C. Johnson, 1998: Silicon depletion in Lake Victoria: Sedimentary signals at offshore stations. J.-Great- Lakes-Res. 24: 118–130.
- Vitousek, P.M., J.D. Aber, R.W. Howarth, G.E. Likens, P.A. Matson, et al., 1997: Human alteration of the global nitrogen cycle—sources and consequences. Ecological Applications 7:737–750.
- Vitousek, P.M., K. Cassman, C. Cleveland, T. Crews, C.B. Field, et al., 2002: Towards an ecological understanding of biological nitrogen fixation. Biogeochemistry 57/58:1–45.
- Wardle, D.A., K.I. Bonner, G.M. Barker, G.W. Yeates, K.S. Nicholson, et al., 1999: Plant removals in perennial grassland: vegetation dynamics, decomposers, soil biodiversity, and ecosystem properties. Ecological Monographs 69:535–568.
- Wood, S., K. Sebastian, and S.J. Scherr, 2000: Agroecosystems. Pilot Analysis of Global Ecosystems. IFPRI and WRI, Washington DC.
- Yeates, G.W. and A.F. Bird, 1994: Some observations on the influence of agricultural practices on the nematode faunae of some south Australian soils. Fundamental and Applied Nematology 17:133–145.
Terms of Use
The copyright for material on this page is the property of the World Resources Institute. Click here for the Terms of Use (Ecosystems and Human Well-Being: Volume 1: Current State and Trends: Nutrient Cycling).
Disclaimer: This chapter is taken wholly from, or contains information that was originally written for the Millennium Ecosystem Assessment as published by the World Resources Institute. The content has not been modified by the Encyclopedia of Earth.
|
|