Agriculture in the Arctic
This is Section 14.5 of the Arctic Climate Impact Assessment.
Lead Author: Glenn P. Juday; Contributing Authors: Valerie Barber, Paul Duffy, Hans Linderholm, Scott Rupp, Steve Sparrow, Eugene Vaganov, John Yarie; Consulting Authors: Edward Berg, Rosanne D’Arrigo, Olafur Eggertsson,V.V. Furyaev, Edward H. Hogg, Satu Huttunen, Gordon Jacoby,V.Ya. Kaplunov, Seppo Kellomaki, A.V. Kirdyanov, Carol E. Lewis, Sune Linder, M.M. Naurzbaev, F.I. Pleshikov, Ulf T. Runesson,Yu.V. Savva, O.V. Sidorova,V.D. Stakanov, N.M.Tchebakova, E.N.Valendik, E.F.Vedrova, Martin Wilmking.
Contents
- 1 Arctic agriculture in a global context (14.5.1)
- 2 Existing agriculture in the Arctic (14.5.2)
- 3 Approach to scenario analysis (14.5.3)
- 4 Climate limitations and influences (14.5.4)
- 5 Growing degree-day analysis (14.5.5)
- 6 Precipitation and potential evapotranspiration analysis (14.5.6)
- 7 Indirect effects of climate change (14.5.7)
- 8 References
- 9 Citation
Arctic agriculture in a global context (14.5.1)
The population of the earth relies on two basic agricultural systems for its food supply. The first is the largescale commercial production and trade of commodities. The commodities that dominate this system are cattle, sheep, and hogs for meat or wool, dairy animals for milk products, grains for animal feed and direct human consumption, and oilseeds. These products move through a complex, and in most cases efficient, network of trading, transportation, and processing before reaching the final consumer. Smaller volumes of products that are important for human dietary variety also move through this network, including potatoes, fruits and vegetables, and raw products for beverages and spices. As a result, a diverse array of foods is available to those consumers who have both physical and economic access to the network. Within the Arctic, this agricultural and trading system serves major population centers, areas served by regular surface transportation, and remote communities. The potential impacts of climate change on this system are global and complex: the system is vulnerable to direct climate influences on crops in multiple climate zones across the earth, to direct climate effects on shipping activities, and to subtle climate influences on prices and relative price differences[1].
The second type of agricultural system that supplies food for the population of the world is subsistence agricultural] production. This system can be generally characterized as regional and largely self-reliant. It does not rely on a complex infrastructure to move either raw or manufactured products to the final consumer. Products are characteristic of the production region, and often obtained as part of a mixture of annual activities (Section 12.2.2 (Agriculture in the Arctic)). These regions are categorized as those having low population density and/or a low economic profile. This subsistence agricultural system serves the majority of the area of the Arctic, but a minority of its population. Generally, regions in which subsistence agriculture predominates have either limited or no physical and/or economic access to the primary global food supply network. Potential climate change impacts on the subsistence system may be acute and local (e.g., a mid-season frost kills a crop) or subtle and longer term (e.g., climate effects on price advantages or barter opportunities).
In the Arctic, many examples can be found of a mixture of the two food systems or a cultural preference for the subsistence agricultural system despite economic and infrastructure advantages that would permit participation in the commercial production system. People in the Arctic can and often do move between participation in one system and the other. It is not clear that the commercial production system will completely displace the subsistence agricultural system in the foreseeable future.
Existing agriculture in the Arctic (14.5.2)
Agriculture is a relatively small industry in high-latitude regions and consists mostly of cropping cool-season forage crops, cool-season vegetables, and small grains; raising traditional livestock (cattle, sheep, goats, pigs, poultry); and herding reindeer. This chapter focuses on crop production rather than livestock. Production of inexpensive reliable feeds is often a major constraint to animal agriculture and livestock production is often limited more by non-climate factors such as availability of processing facilities and appropriate waste handling rather than directly by climate. While agriculture is limited by climate in the Arctic, especially in the colder regions, it is also limited by lack of infrastructure, a small population base, remoteness from markets, and land ownership issues. Major climate limitations include short growing seasons (not enough time to mature or to produce high yields of harvestable crop), lack of heat energy (too few GDDs during the season), long and/or unfavorable winter weather that can limit survival of many perennial crops, and high moisture stress in some areas.
Most of the climate stations selected for examination have climates that are currently at least marginally suitable for growing barley, oats, green peas, and potatoes (although not always to full tuber maturity). Wheat has been grown in experimental plantings as far north as Rovaniemi, Finland, the southern Northwest Territories, Canada, and Fairbanks, Alaska, but is considered too marginal for commercial production in those areas and is a major commercial crop only in southern Siberia (represented by Novosibirsk). Canola (rapeseed) is also produced only in the southernmost part of the Arctic and is considered marginal even in many areas now considered suitable for barley (such as Interior Alaska). Sunflowers currently are produced in generally the same locations as wheat. The magnitude of temperature increases projected by the Arctic Climate Impact Assessment (ACIA)-designated models would remove these heat limitations in areas that are presently climatically marginal by the mid- or late 21st century.
All of the climate stations examined in this chapter have summers with enough heat to produce at least one successful harvest of forage crops, including legumes such as alfalfa or clover and grass such as timothy. Slight increases in growing-season temperature are likely to increase the probability of two or more successful harvests and thus increased yields in some areas. However, winter survival is a problem in most areas, thus alfalfa is produced only in the warmer parts of the Arctic, and clovers are successfully grown in areas with relatively mild winters. Perennial grasses, especially smooth bromegrass and timothy, are grown in much of the region.
Agricultural production statistics match the boundaries of the Arctic as defined in this chapter at the national level for Iceland. Relevant statistics are also available for the three northern counties of Norway (Troms, Finnmark, and Norland), Alaska (United States), and the Yukon and Northwest Territories (Canada). These areas are highlighted in this section. Data from the Norrbottens region of Sweden-Russia match this chapter’s analysis area, and Finnish agricultural statistics are readily available at the national level and for jurisdictions with boundaries that are not as relevant for the purposes of this assessment. Complete and reliable statistics for agriculture in arctic are not available.
Yukon Territory is one of the most mountainous parts of Canada, but agriculture occurs in valleys, especially in the southern interior, and in suitable landforms in the Northwest Territories. The data in this section on Canadian agriculture are from Statistics Canada[2] and Hill et al.[3]. There are at least 170 farms in the Yukon and 30 in the Northwest Territories, representing a total capital value of over Can$ 67 million, primarily in land and buildings. Most of these farms are operated as part of a yearly cycle of other activities, and only 21 have gross receipts greater than Can$ 25,000. Farmers in the Canadian north take a diversified approach to agriculture. They produce traditional livestock and engage in sled-dog breeding and nontraditional livestock production primarily for local and specialty markets. Along with east-central Alaska, the western Yukon is the driest part of the North American subarctic. Because portions of these regions are already natural grasslands too dry for tree growth, irrigation would certainly be required to exploit improved temperature regimes for crop agriculture in such areas. In the central and eastern Canadian Arctic, temperatures currently fall well below minimums necessary for traditional agriculture, although warming trends have been detected. Across much of the Canadian far north, further temperature increases as projected by the ACIA-designated models would move the zone of temperature suitability northward into a region largely dominated by soils with relatively poor suitability for agriculture. Broad areas of Turbic and Organic Cryosols cover these northern landscapes[4], and in the glaciated north, soils are often thin, stony, and derived from nutrient-poor bedrock parent materials. Areas with pockets of suitable climates and soils that are close to population centers could possibly become locally important for food production for established populations with a goal of greater self-sufficiency.
Alaska has several climatically distinct agricultural regions, including interior valleys and lowlands with warm and dry summer climates, coastal regions with cooler summers and moderate to high precipitation, and a broad transition region in the major population zone of south-central Alaska. Most of the volume and value of agricultural production takes place in the transition and interior locations. In the dry interior valleys, heat sums necessary to mature grains such as barley are generally achieved, and recent warming trends have increased the probability of achieving this critical factor to a very high level[5]. In interior valleys and the south-central transition region, there is a high correlation between years of excellent crop production and adequate and (especially) well-timed precipitation in the early and middle parts of the growing season. However, persistent and heavy precipitation in the late summer can delay, reduce, or even ruin crop harvest and recovery.
In 2001, Alaska had about 580 farms and ranches (sales greater than US$ 1,000) covering 370,000 hectares (ha), of which the great majority was unimproved pasture. Alaskan crop production in the same year included 10,500 tons (t) of potatoes (including high-value, certified virus-free seed potatoes), 27,000 t of hay, 800 t of carrots, and over 8,800 m3 of oats and barley. Alaska produced 11,500 cattle, 1,200 sheep, 1,000 hogs and 15,000 domestic reindeer in 2001. A few farm and ranch operations are producing species such as elk (wapiti), bison, yak, and musk oxen. Some Alaskan crops and pastures are already moisture-limited, especially in the warmer summer climate of recent years[6]. If [[temperature]s] were to increase across the northern boreal (Importance and relationship of boreal forests to climate) region without a significant increase in precipitation in the early and middle parts of the growing season, the change would be unfavorable for agricultural production, except in the case of irrigated crop production that could take advantage of the greater growing-season heat units. Temperature increases projected for coastal areas generally are very likely to be favorable to agriculture, although much of the area consists of steeply mountainous terrain with little soil development. In the south-central transition region, Alaskan agriculture faces strong economic challenges from competing urban and suburban Land-useland uses in the region where historically it has been most well-established. Large new areas are available to be opened to agriculture, especially in central Alaska, but no recent public policy initiative to do so has emerged. National-level agricultural subsidy payments to Alaskan farmers have nearly doubled in the last decade to over US$ 2 million, or about 20% of net farm income.
In 2000, northern Finland contained about 10,000 farms, of which about 50% were dairy farms. The average farm size is about 11.5 ha. While most northern Finnish farm properties remain in their traditional size and configuration (they have not been subdivided), the number that are producing significant amounts of dairy products has decreased rapidly in recent years[7]. Reasons for the decline include surpluses of dairy products, small quantities produced, and especially social change. These changes include migration of farm owners to towns and cities with professional opportunities that are more attractive and have higher income potential, and the conversion of inactive farms into country residences for town dwellers.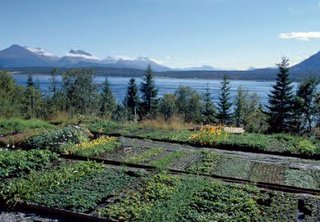
The three northern counties in Norway had 95,000 ha of land in agricultural use in 1999, distributed among about 6,500 owners[8]. The area receives nearly the maximum warming influence of the Gulf Stream in the Arctic, so there is a strong maritime influence especially in the south and west of the region. Climate factors limiting to agriculture are maximum [[temperature]s] and total warmth over the summer, which are strongly influenced by cool and wet maritime weather. Prolonged cool and wet maritime conditions can result in slow plant growth and failure of crops to complete development, wet fields and crops at harvest time, and, occasionally, outbreaks of plant diseases. Agricultural operations are generally small, with only 570 holdings larger than 30 ha and only 50 holdings larger than 50 ha. Employment in agriculture, horticulture, and forestry in the three-county region in 1999 totaled about 6,500 full-time equivalents. Many of these farming operations fit into a diversified set of annual activities that include wage employment, fishing, cultural landscape maintenance, and personal consumption and non-cash trade of crops (Fig. 14.10). Nearly all farming operations include cultivated meadows for hay and pasture, and about one-third produce potatoes. Only 45 farms, all in the southernmost county of Nordland, produce grain or oilseed crops.
The three northern counties in Norway had 95,000 ha of land in agricultural use in 1999, distributed among about 6,500 owners[8]. The area receives nearly the maximum warming influence of the Gulf Stream in the Arctic, so there is a strong maritime influence especially in the south and west of the region. Climate factors limiting to agriculture are maximum [[temperature]s] and total warmth over the summer, which are strongly influenced by cool and wet maritime weather. Prolonged cool and wet maritime conditions can result in slow plant growth and failure of crops to complete development, wet fields and crops at harvest time, and, occasionally, outbreaks of plant diseases. Agricultural operations are generally small, with only 570 holdings larger than 30 ha and only 50 holdings larger than 50 ha. Employment in agriculture, horticulture, and forestry in the three-county region in 1999 totaled about 6,500 full-time equivalents. Many of these farming operations fit into a diversified set of annual activities that include wage employment, fishing, cultural landscape maintenance, and personal consumption and non-cash trade of crops (Fig. 14.10). Nearly all farming operations include cultivated meadows for hay and pasture, and about one-third produce potatoes. Only 45 farms, all in the southernmost county of Nordland, produce grain or oilseed crops.
Temperature increases are likely to move the grain production boundary northward. Any climate changes that enhance the maritime effect, especially in the summer, would not be favorable to agriculture in this coastal region, although the effects are very likely to be lessened inland. Climate changes that increase growing-season length and daily maximum temperatures while maintaining or slightly decreasing persistence of growing-season clouds and rain are very likely to be favorable to agricultural production in this area. Agriculture in the far north of Norway will be strongly influenced by national and European policies to subsidize rural populations and landscapes, perhaps more than any other factor. The government of Norway is likely to have sufficient revenues available from petroleum to intervene strongly in the economics of northern community infrastructure and agriculture to achieve its social and environmental goals for some time to come.
Iceland is surrounded during the growing season by a cool ocean surface; locations farthest inland from the cool maritime influence are covered with glacial ice. As a result, lack of summer warmth has been the chronic limitation to Icelandic agriculture, especially in years when sea ice (Sea ice in the Arctic) reaches the Icelandic shoreline. Icelandic agriculture traditionally has been limited to the crops most tolerant of cool season conditions. Even small temperature increases historically have removed this limitation and permitted the better harvests in the record. Iceland produces over 2 million m3 of hay, more than 10,000 t of potatoes, and over 4,000 t of cereal grains (barley)[9]. Glasshouse agriculture using abundant geothermal heat supports the production of about 1,000 t of tomatoes and cucumbers. In 2001, the 3,000 farms in Iceland produced 473,000 sheep, 70,000 cattle, 73,000 horses, and 106,000 liters of processed milk[10]. During the last decade of the 20th century, sheep and hay production declined at double-digit rates, largely for non-climatic market, policy, and social reasons. Numbers of cattle and horses (the famous Icelandic pony) have remained level. Icelandic agriculture employs about 4,400 people, which is 3.1% of the total employment. Greenland supports about 20,000 sheep and more than 3,000 reindeer[11].
The entrance of Iceland into the European Community Common Agricultural Programme (CAP) has been the major force in Icelandic agriculture in the last decade. In general, CAP subsidies have sustained smaller and higher-cost producers and rural economies, introduced limitations for certain products, reduced risk to producers, and transferred funds from consumers to producers. Temperature increases would almost certainly permit accelerated expansion of cereal grain production and possibly new oilseed crops, reduce the cost of winter forage for livestock, and allow increased per-unit crop yields where nutrients or water are not limiting. There are complex multiple goals in Icelandic agriculture, including food production, employment, rural stability, maintaining an attractive landscape, and environmental protection. Because the agricultural system exists in a highly interventionist public policy environment, a traditional economic analysis is likely to show that national and CAP policies will be more influential than temperature increases in the future of Icelandic agriculture (see Section 14.3.4.4 (Agriculture in the Arctic) for a discussion of the conversion of agricultural land to forests).
Approach to scenario analysis (14.5.3)
The 14 sites that were chosen for examination of the ACIA-designated model projections were selected to represent areas in the northern part of the boreal region currently supporting commercial agriculture and areas north of current potential (Section 14.4.1 (Agriculture in the Arctic)). The analysis did not consider soil effects, although soil can be a major limitation to agriculture, and changes in soil processes following climate change can have significant impacts on agriculture[12]. In much of the circumpolar north, large tracts of soils already exist that are suitable for agriculture if other constraints are removed, with the exception of much of northern Canada (composed of the Canadian Shield) and northern Fennoscandia, where the granitic soils are shallow and nutrient-poor.
This analysis used GDDs as a primary determinant of climate suitability for producing annual crops. Growing degree-days (a measure of accumulated heat energy) are considered a good predictor of plant phenology and are often used to project the timing of different plant growth stages. For example, farmers and extension agents often use GDDs to determine the optimum harvest time for forage crops. There are some major limitations to the use of GDDs. They may vary for different cultivars, locations[13], and growth stages[14]. Heat energy requirements for plants interact with other environmental factors, such as moisture stress and photoperiod[15], and thus GDDs may not be a good predictor of plant development under stress. Heat requirements for plant development generally decrease with increasing photoperiod, so fewer GDDs are needed to reach a given growth stage at high latitudes than at low latitudes.
In areas with humid autumns, GDDs may equal or exceed the threshold for a given crop to reach maturity, but wet conditions may not allow the crop to dry enough to allow cost-effective mechanical harvesting. Thus, even though projections of future temperature may indicate that certain areas will be suitable for some crops, wet conditions may offset the temperature effects, especially in more humid zones within the northern boreal region.
Growing degree-day requirements for various crops from the highest-latitude areas possible were obtained from the literature, and similar GDD requirements were assumed for a given crop throughout the region. One problem with using GDD data from the literature for determining climate suitability for a given crop is that different reports use different base temperatures for calculating GDDs. For example, many agriculturists often use a base of 5°C (GDD5) for cool-season crops, while others use a base of 0°C (GDD0). Others use some experimentally determined growth threshold as the base temperature. If no information existed for GDD requirements using a base of 5 or 0°C, the GDD requirements for the base temperatures of interest were estimated from published GDDs based on similar base temperatures. In some cases, insufficient information was available to do this for both 5 and 0°C base temperatures. Despite its limitations, use of GDDs is a widely reported and accepted method to project approximate crop phenology. GDD analysis is generally accepted as a good way to estimate climate suitability for producing annual crops.
For projecting potential water stress, the analysis used model-projected potential evapotranspiration (Precipitation and evapotranspiration in the Arctic) minus growing-season precipitation. Positive values indicate a potential water deficit, interpreted to mean potential water stress, which could limit crop yields or quality. However, many crops can produce acceptable yields even under water-deficit conditions, and water stress is also affected by soil water-holding capacity, rooting depth, precipitation timing (e.g., spring versus summer), and type of storms (e.g., infrequent large rainfall events may result in more water loss due to runoff (Surface runoff) than small, frequent storms).
This assessment ignored the effects of atmospheric (Atmosphere layers) CO2 enrichment and changes in crop pests, other than to estimate the potential general effects. Few field studies have been done on CO2 enrichment effects on crop plants at high latitudes and results from more temperate zones may not be transferable to northern areas, thus there is little data on which to judge the effects of CO2 enrichment. Climate effects on pests are complex and difficult to forecast. Such an analysis is obviously needed to understand the complete range of climate change effects, but it is not yet feasible because of a lack of detailed knowledge of insect and other pathogens.
For this analysis, a few annual crops were selected that are currently well-adapted or marginally adapted to parts of the region and which have potential to become economically important crops for animal feed (cereal grains), human food, (beans, peas, potatoes, wheat), or oilseeds (canola, sunflowers).
Climate limitations and influences (14.5.4)
If the ACIA-designated model projections of GDDs at a given site equaled or exceeded the minimum GDD requirements for a given crop, but were below the midpoint of the range given in Table 14.3, the crop was considered to be marginal. The analysis was based on 20-year averages, to smooth out much of the variability in the data and because it is assumed that farmers would require about 20 years under a changing climate regime to accept the change and adopt farming practices that included new crops.
The GDD requirements for some of the crops presented in Table 14.3 appear inconsistent between the two base [[temperature]s] (for example, with a base of 5°C, seed peas appear to require fewer GDDs at the low end of the range than canola but require more GDDs at the upper end of the range). This may be due to errors in the literature, errors in the estimation of GDD requirements, or it may mean that either the 5 or 0°C base temperature is not appropriate for some crops. This may cause errors in determining climate suitability for some crops. Table 14.3 also provides estimates of the number of accumulated GDDs required for forage crops to reach optimum time of harvest. These may be underestimates for high-latitude regions, as low soil temperatures may delay initiation of growth, especially in spring.
|
Table 14.3. Growing degree-day requirements for various annual crops to reach maturity[16] and for forage crops to reach optimum harvest stage[17]. | ||
|
Growing degree-days (5°C base) |
Growing degree-days (0°C base) | |
|
Annual crops |
||
|
Peas (green for processing) |
700 –800 |
1000 |
|
Spring barley |
700 –900 |
1200 –1500 |
|
Peas (for seed) |
800 –1150 |
1500 –1700 |
|
Oats |
1300 –1700 | |
|
Canola |
950 –1050 |
1350 –1550 |
|
Potatoes |
1000 –1100 |
|
|
Spring wheat |
1000 –1200 |
400 –1650 |
|
Dry beans |
1100 –1500 |
|
|
Sunflowers (for seed) |
1800 –2000 | |
|
Forage crops |
||
|
Alfalfa |
350 –450 |
|
|
Red clover |
450 |
|
|
Timothy |
350 –450 |
|
The models use large grid cells, which often contain large tracts of terrain not likely to become suitable for agriculture (such as high mountains), and some of the model projections are obviously not realistic even for present conditions. Therefore, this analysis uses proportional changes from the present, compared to observed weather data, rather than using actual temperature projections provided by the models. For each parameter analyzed (GDD0, GDD5, and growing-season water deficit), the highest and lowest projections for each location were selected (Table 14.4).
|
Table 14.4. Projected growing degree-days calculated from the highest and lowest model-projected temperatures for each site. | ||||||
|
2011–2030 |
2041–2060 |
2071–2090 | ||||
|
Highest |
Lowest |
Highest |
Lowest |
Highest |
Lowest | |
|
Growing degree-days (0°C base) | ||||||
|
Fairbanks |
2175 |
1800 |
2525 |
1850 |
2625 |
2025 |
|
Big Delta |
1925 |
1600 |
2225 |
1650 |
2350 |
1800 |
|
Whitehorse |
1750 |
1500 |
2050 |
1525 |
2200 |
1700 |
|
Fort Vermillion |
1875 |
1675 |
2000 |
1750 |
2050 |
1875 |
|
Thompson |
2025 |
1825 |
2125 |
1900 |
2375 |
2050 |
|
Goose Bay |
1550 |
1375 |
1600 |
1525 |
1775 |
1575 |
|
Reykjavik |
1275 |
1125 |
1425 |
1050 |
1450 |
1150 |
|
Tromsø |
1325 |
1100 |
1425 |
1125 |
1525 |
1300 |
|
Umeå |
1700 |
1425 |
1875 |
1600 |
1900 |
1675 |
|
Rovaniemi |
1650 |
1400 |
1825 |
1575 |
1850 |
1675 |
|
Archangelsk |
1700 |
1450 |
1875 |
1600 |
2000 |
1625 |
|
Novosibirsk |
2025 |
1900 |
2125 |
1850 |
2250 |
2000 |
|
Yakutsk |
2025 |
1750 |
2150 |
1800 |
2325 |
1975 |
|
Magadan |
1625 |
1400 |
1825 |
1425 |
2050 |
1775 |
|
Growing degree-days (5°C base) | ||||||
|
Fairbanks |
1600 |
1125 |
2000 |
1150 |
2150 |
1325 |
|
Big Delta |
1275 |
900 |
1600 |
875 |
1725 |
1050 |
|
Whitehorse |
1275 |
900 |
1600 |
925 |
1725 |
1050 |
|
Fort Vermillion |
1400 |
1200 |
1550 |
1275 |
1575 |
1400 |
|
Thompson |
1350 |
1175 |
1450 |
1225 |
1650 |
1375 |
|
Goose Bay |
1300 |
1100 |
1500 |
1275 |
1700 |
1350 |
|
Reykjavik |
500 |
475 |
625 |
425 |
625 |
500 |
|
Tromsø |
600 |
450 |
675 |
475 |
725 |
625 |
|
Umeå |
1025 |
775 |
1200 |
975 |
1200 |
1075 |
|
Rovaniemi |
900 |
700 |
1050 |
800 |
1050 |
875 |
|
Archangelsk |
1000 |
825 |
1150 |
975 |
1250 |
1025 |
|
Novosibirsk |
1325 |
1250 |
1425 |
1200 |
1500 |
1375 |
|
Yakutsk |
1350 |
1075 |
1450 |
1100 |
1625 |
1325 |
|
Magadan |
925 |
725 |
1075 |
625 |
1250 |
1050 |
The success of perennial crops is governed more by winter survival success than by growing-season weather conditions. Factors such as the timing of killing frosts, warm spells during winter, length of the dormant season, snow (Snow cover in the Arctic) depth, and winter [[temperature]s] all interact to affect winter survival. Warm periods during winter, especially prolonged temperatures above 0°C, can be detrimental to perennial plants by reducing winter dormancy and depleting carbohydrate reserves[18]. The complexity of these interactions makes projection of climate change effects on these crops difficult.
Growing degree-day analysis (14.5.5)
When GDD0 was used for analysis, all of the ACIA-designated models projected that all the examined locations would be suitable for green pea production early in this century, and the high-extreme models (GFDLR30_ c and CGCM2) projected climates suitable for barley at all locations by 2030. When GDD5 was used, the models projecting the most GDDs suggested that Reykjavik and Tromsø would be unsuitable for green peas by 2030 because of too many GDDs. The GFDLR30_ c projections indicate that potatoes could be grown in all locations except Reykjavik, Tromsø, Rovaniemi, and Magadan (marginal at Umeå and Archangelsk) by 2030, while the low-extreme models (HadCM3 and CSM_1.4) projected suitable climates only in Fairbanks, Fort Vermillion, Thompson, Goose Bay, Novosibirsk, and Yakutsk. Thus, projections for potatoes may be too low, as potatoes are already produced, at least marginally, in many areas not projected to be suitable by 2030. This may be because use of GDDs may not be a good way to project phenological development in potatoes[19]. The models generally projected that all except the coolest sites in Scandinavia would have climates at least marginally suitable for potato production by the end of the century.
All of the models project a climate suitable for dry pea production at all locations except Reykjavik and Tromsø by 2030 when GDD5 was used, although the low-extreme models (HadCM3 and CSM_1.4) projected that Goose Bay, all of the Scandinavian sites, Archangelsk, and Magadan would be unsuitable for dry peas using GDD0. All the models project that all sites except Reykjavik and Tromsø would have climates suitable (marginally so at Goose Bay) for seed pea production by the end of the century. The high-extreme models (GFDL-R30_c and CGCM2) project that all of the North American sites (marginal at Big Delta,Whitehorse, and Goose Bay), Novosibirsk, and Yakutsk would have climates suitable for dry bean production by 2030, but the low-extreme models (HadCM3 and CSM_1.4) project that climate would only be marginal for such production even at the warmest sites (Fairbanks, Fort Vermillion,Thompson, Novosibirsk) by 2030. Models projecting the highest number of heat units at a given location indicated that all sites except Reykjavik, Tromsø, and Rovaniemi would be at least marginally suitable for dry beans by 2060, whereas the low extreme models (HadCM3 and CSM_1.4) indicated that only Fairbanks, Fort Vermillion, Thompson, Goose Bay, Novosibirsk, and Yakutsk would have climates suitable for dry bean production by 2090.
Most of the models projected that most locations would be at least marginally suitable for all of the cereal grains by the end of the century, although the low-extreme models, using GDD5, projected that only Fairbanks, Fort Vermillion, Thompson, Goose Bay, Novosibirsk, and Yakutsk would be well-suited for wheat by 2090. The high-extreme model (GDFLR30_ c or CGCM2) for each location projected that climate would be suitable for canola at all locations except Tromsø by 2030 using GDD0. All of the models projected that climate will be at least marginally suited for oilseed sunflowers by 2030 at Fairbanks, Thompson, and Novosibirsk, and the high-extreme models projected climates suitable for sunflowers at all sites except Goose Bay, Reykjavik, and Tromsø (marginal at Rovaniemi) by 2090. Conversely, the low-extreme models projected that only Fairbanks, Thompson, Novosibirsk, and Yakutsk would be well-suited, and Big Delta and Fort Vermillion would be marginally suited, for this crop by near the end of the century.
Assuming that the amount of heat is the main factor limiting yields and number of harvests of perennial forage crops, model projections indicate that warmer growing seasons are likely to increase the potential number of harvests and hence seasonal yields for perennial forage crops at all locations. Uncertainty about winter conditions make forecasts about survival potential for crops difficult. Warmer winters could actually decrease survival of some perennial crops if winter thaws followed by cold weather become more frequent. Crops adapted to certain types of winter stress are very likely to experience different types of stresses if winter [[temperature]s] rise and winter thaws become more frequent. However, lengthened growing seasons, especially in autumn, are very likely to result in northward extension of climate suitable for alfalfa production.
All of the models project high interannual variability in GDD accumulation. Thus, even though 20-year averages may indicate climates well suited for crops for a given area, the frequency of growing seasons cool enough to limit production may convince farmers that the risk for producing these crops is too high. Thus, the perception of risk by farmers could be a limiting factor for the northward advancement of many of the analyzed crops.
Precipitation and potential evapotranspiration analysis (14.5.6)
Most of the models project increases in precipitation (Precipitation and evapotranspiration in the Arctic) at most locations, with some forecasting up to 20% increases from values typical of the 1981–2000 baseline period by 2090. There was a great deal of variability among models, with no single model consistently projecting the greatest or smallest change in precipitation at all locations. A few models projected decreases in precipitation at a few sites. For example, CSM_1.4 projects a decrease of 5% at Whitehorse (compared to the present) during the 2011–2030 time slice, and HadCM3 projects a decrease of about 1% at Umeå and about 4% at Tromsø by 2090. All models projected a general increase in potential evapotranspiration over time at all locations, with much variability among models and locations.
Some locations in the subarctic already experience water deficits large enough to reduce crop yields. For example, Sharratt[20] found that barley yields in Interior Alaska are depressed in about five of every nine years due to insufficient water supply. Water deficits were usually projected to increase over time, with GFDL-R30_c usually projecting the smallest deficits and HadCM3 and CSM_1.4 usually projecting the largest (Table 14.5). Most models project rather large water deficits, especially by the end of the analysis period. However, the HadCM3 model projects rather large water surpluses throughout the 21st century at Goose Bay, and slight surpluses at Reykjavik until about mid-century (Table 14.5). Most models, especially CSM_1.4, project fairly small deficits at Tromsø. These results indicate that water is likely to become a major limiting factor for production of most crops at all but the maritime sites in the boreal zone. Unless irrigation is supplied, which may not be economical for most of the crops analyzed, production is likely to be limited in many areas to drought resistant crops, such as cereal grains.
|
Table 14.5. Projected water deficits calculated from highest and lowest model projections at each site. Negative values indicate a water surplus. | ||||||
|
Water deficit (mm) | ||||||
|
2011–2030 |
2041–2060 |
2071–2090 | ||||
|
Highest |
Lowest |
Highest |
Lowest |
Highest |
Lowest | |
|
Fairbanks |
250 |
166 |
282 |
207 |
311 |
253 |
|
Whitehorse |
150 |
116 |
287 |
165 |
321 |
265 |
|
Fort Vermillion |
324 |
148 |
355 |
168 |
371 |
218 |
|
Thompson |
335 |
132 |
394 |
157 |
413 |
169 |
|
Goose Bay |
22 |
-122 |
62 |
-151 |
58 |
-125 |
|
Reykjavik |
184 |
-20 |
216 |
-15 |
241 |
68 |
|
Tromsø |
84 |
-31 |
117 |
14 |
134 |
44 |
|
Umeå |
217 |
139 |
250 |
163 |
262 |
173 |
|
Rovaniemi |
185 |
51 |
233 |
111 |
226 |
145 |
|
Archangelsk |
191 |
-7 |
232 |
26 |
231 |
31 |
|
Novosibirsk |
389 |
126 |
414 |
127 |
469 |
149 |
|
Yakutsk |
289 |
152 |
315 |
161 |
328 |
165 |
|
Magadan |
224 |
117 |
238 |
164 |
269 |
180 |
Indirect effects of climate change (14.5.7)
This analysis has focused on the direct effects of changes in growing-season [[temperature]s] (using GDDs as indicators of crop growth potential) and moisture relationships on potential agricultural crop production in the next century in high-latitude regions. However, the indirect effects of climate change may have similar or greater impacts on agricultural development. Several of them are outlined here without in-depth analysis, to acknowledge their potential importance and alert those involved in future assessments that these factors need to be considered.
The development of crop disease requires suitable host, pathogen, and environmental conditions. Temperature and moisture are critical for the spread of many plant diseases[21], especially in a region as severely heat-limited as the Arctic. Under conditions of increasing temperatures, the risk of crop damage increases in all regions of the northern half of Europe[22]. The severity and number of species capable of reaching infestation levels for North American agriculture are likely to increase with less severe winters[23]. These findings suggest that disease and weed pests are likely to increase throughout the Arctic under the ACIA-designated model scenarios. These problems are not likely to offset potential yield increases or eliminate the potential for new crops in most cases. However, it is possible that severe outbreaks could have that effect in specific cases. For example, temperature increases in Finland are very likely to increase the incidence of potato late blight to the point that it will significantly decrease potato yield in that country[24].
While the effects of atmospheric (Atmosphere layers) CO2 enrichment were not considered in this analysis, higher CO2 concentrations are very likely to result in yield increases for most crops[25]. Lack of experimental data on the effects of CO2 fertilization on crops in high-latitude regions make in-depth analysis of this effect impossible at present.
Lack of infrastructure development, small population sizes (thus limiting local markets), and distance to large markets are likely to continue to be major factors limiting agricultural development in most of the northern part of the boreal (Importance and relationship of boreal forests to climate) region during this century. One possible indirect effect of climate change on agriculture in the Arctic and subarctic is the effect on transportation, including land transport and the prospect of regular ocean shipping across the Arctic Ocean with reduced or absent sea-ice (Sea ice in the Arctic) cover (section 16.3). Thawing of permafrost that is susceptible to ground subsidence is disruptive to existing roads and railroads. Ultimately, once the permafrost thaws, in nearly all cases a more stable foundation will be available for permanent transportation routes and facilities. It is possible that shipping across the Arctic Ocean will greatly enhance economical trade in agricultural products, especially products unique to these regions, and thus enhance development of commercial agriculture in the far north.
If the net effect of climate change is greater global agricultural production, then food prices are likely to be lower for the world as a whole as long as the rather large subsidies that influence prices do not markedly increase or decrease. Lower world food prices would reduce the incentive to rely on local commercial or subsistence production in the Arctic. The opposite would be the case if climate change reduces global agricultural production. A key component of the ability of global food production to cause a fundamental change in the supply/ demand relationship for local agricultural production in the Arctic (other factors being equal) is shipping cost. Regular shipping across an ice-free Arctic Ocean (section 16.3.7) is very likely to lower transport costs for nonperishable bulk commodities such as grains or fertilizers, and thereby lower prices for the basic inputs to the agricultural system in the Arctic. In addition, it is possible that the availability of arctic shipping will stimulate the export of bulk finished products from the Arctic. The volume of agricultural imports to or exports from the Arctic is unlikely to generate the economies of scale that would support regular shipping at a major cost advantage for agriculture within the Arctic, at least not within the 21st century. Mining and petroleum industries would be more likely to generate higher volumes of cargo, although there is only a limited ability to change the kind of cargo handled by specialized vessels. However, if arctic ports of call were integrated into a much higher volume of general trade between the northern continents, then price advantages for agriculturally related arctic cargoes would be much more likely.
The impacts of lower transport cost on arctic commercial agricultural production would be complex. Inexpensive, regular arctic shipping is very likely to provide a price advantage that could possibly stimulate production of unique arctic commodities such as reindeer and caribou meat or muskox milk or cheese, as long as other factors affecting demand were favorable. Conversely, lower shipping costs are likely to discourage arctic production of agricultural commodities widely produced elsewhere, unless overall global supply or demand structure shifted descisively. However, basic input data that would permit in-depth analysis, including trade levels and patterns in an ice-free Arctic, economics and practicalities of Arctic Ocean shipping operations, and the overall regional costs of arctic agricultural production compared to global supply and demand, are somewhat speculative or lacking.
In Europe, the United States, and Canada, public policy and interventions are major factors that agricultural producers confront in determining their activities. In many cases, national or trading-area agricultural transfer payments and rules of production correlate especially well with the annual profile of agriculture in the Arctic, as noted in Existing agriculture in the Arctic (above). There is no obvious trend to suggest that the significant role played by government policy will change during the 21st century. Russia is experiencing a period of population and economic consolidation in its northern regions, an adjustment required after investments made during Soviet times could not be sustained under new conditions. Given the strong dominance of state land ownership, government policy will be a decisive factor in the future of agriculture in most of the arctic nations. The current agricultural profiles also suggest that local markets are vital to the agricultural sector in the Arctic. If climate change results in increases in the human population of the Arctic, then the entire agricultural sector is likely to expand given the historic positive relationship between regional population and agricultural production.
Chapter 14: Forests, Land Management, and Agriculture
14.1. Introduction (Agriculture in the Arctic)
14.2. The boreal forest: importance and relationship to climate
14.3. Land tenure and management in the boreal region
14.4. Use and evaluation of the ACIA scenarios
14.5. Agriculture
14.6. Tree rings and past climate
14.7. Direct climate effects on tree growth
14.8. Climate change and insects as a forest disturbance
14.9. Climate change and fire
14.10. Climate change in relation to carbon uptake and carbon storage
14.11. Climate change and forest distribution
14.12. Effects of ultraviolet-B on forest vegetation
14.13. Critical research needs
References
Citation
Committee, I. (2012). Agriculture in the Arctic. Retrieved from http://editors.eol.org/eoearth/wiki/Agriculture_in_the_Arctic- ↑ Rosenzweig, C. and M. Parry, 1994. Potential impacts of climate change on world food supply. Nature, 367:133–138.
- ↑ Statistics Canada, 2001. 2001 Census of Agriculture. www.statcan.ca/english/freepub/95F0301XIE/tables/territories.htm.
- ↑ Hill,T., D. Beckman, M. Ball, P. Smith and V. Whelan, 2002. Yukon Agriculture: State of the Industry, 2000–2001. Department of Energy, Mines and Resources, Government of Yukon, 48p.
- ↑ Lacelle, B., C. Tarnocai, S. Waltman, J. Kimble, D. Swanson, Ye.M. Naumov, B. Jacobsen, S. Goryachkin and G. Broll, 1998. Northern Circumpolar Soil Map. Agriculture and Agri-Food Canada; USDA;V.V. Dokuchayev Soils Institute; Institutes of Geography – University of Copenhagen and Moscow; Institute of Landscape Ecology – University of Muenster.
- ↑ Sharratt, B., 1992. Growing season trends in the Alaskan climate record. Arctic, 45(2):124–127.–Sharratt, B., 1999. Thermal requirements for barley maturation and leaf development in interior Alaska. Field Crops Research, 63:179–184.
- ↑ Sharratt, B., 1994. Observations and modeling of interactions between barley yield and evapotranspiration in the subarctic. Agricultural Water Management, 25:109–119.
- ↑ Häkkilä, M., 2002. Farms of northern Finland. Fennia, 180(1–2):199–211.
- ↑ 8.0 8.1 Statistics Norway, no date. www.ssb.no/english/subjects/10/04/10/
- ↑ Statistics Iceland, 2003. Iceland in figures 2002–2003,Vol. 8. Hagstofa Islands. Statistics Iceland, Reykjavik, 32p.
- ↑ Statistics Iceland, 2003. Iceland in figures 2002–2003,Vol. 8. Hagstofa Islands. Statistics Iceland, Reykjavik, 32p.
- ↑ Statistics Greenland, 2005. Greenland in Figures 2005. 3rd Edition. Greenland Home Rule Government, 32p.
- ↑ Gitay, H., S. Brown,W. Easterling and B. Jallow, 2001. Ecosystems and their goods and services. In: J.J. McCarthy, O.F. Canziani, N. A. Leary, D.J. Dokken and K.S. White, (eds.). Climate Change 2001: Impacts, Adaptation, and Vulnerability. Contribution of Working Group II to the Third Assessment Report of the Intergovernmental Panel on Climate Change, pp. 235–342. Cambridge University Press.
- ↑ Sanderson, M. A.,T.P. Larnezos and A.G. Matches, 1994. Morphological development of alfalfa as a function of growing degree days. Journal of Production Agriculture, 7:239–242.
- ↑ Bourgeois, G., S. Jenni, H. Laurence and N. Tremblay, 2000. Improving the prediction of processing pea maturity based on the growing-degree day approach. HortScience, 35:611–614.–Kleemola, J., 1991. Effect of temperature on phasic development of spring wheat in northern conditions. Acta Agriculturae Scandinavica, 41:275–283.
- ↑ Bootsma, A., 1984. Forage crop maturity zonation in the Atlantic Region using growing degree days. Canadian Journal of Plant Science, 64:329–338.–Nuttonson, M. Y., 1955. Wheat-Climate Relationships and the Use of Phenology in Ascertaining the Thermal and Photo-thermal Requirements for Wheat. American Institute of Crop Ecology, Washington, D.C., 388p.–Nuttonson, M. Y., 1957. Barley-Climate Relationships and the Use of Phenology in Ascertaining the Thermal and Photo-thermal Requirements for Barley. American Institute of Crop Ecology. Washington, D.C., 200p.
- ↑ Anon., 1996–2000. Climate Applications: Newfoundland and Labrador Heritage.–Ash, G.H.B., D. A. Blatta, B. A. Mitchell, B. Davies, C.F. Shaykewich, J.L. Wilson and R.L. Raddatz, 1999. Agricultural Climate of Manitoba. Agriculture, Food and Rural Initiatives, Government of Manitoba, Winnipeg. Available at: www.gov.mb.ca/agriculture/climate/waa50s00.html.–Dofing, S.M., 1992. Growth, phenology, and yield components of barley and wheat grown in Alaska. Canadian Journal of Plant Science, 72:1227–1230.–Dofing, S.M. and C. W. Knight, 1994.Variation for grain fill characteristics in northern-adapted spring barley cultivars. Acta Agriculture Scandinavia, B, 44:88–93.–Juskiw, P.E.,Y.-W. Jame and L. Kryzanowski, 2001. Phenological development of spring barley in a short-season growing area. Agronomy Journal, 93: 370–379.–Miller, P.,W. Lenier and S. Brandt, 2001. Using growing degree days to predict plant stages. Montana Guide Fact Sheet MT200103 AG 7/2001. Montana State University Extension Service, 8p.–Nuttonson, M. Y., 1955. Wheat-Climate Relationships and the Use of Phenology in Ascertaining the Thermal and Photo-thermal Requirements for Wheat. American Institute of Crop Ecology, Washington, D.C., 388p.–Nuttonson, M. Y., 1957. Barley-Climate Relationships and the Use of Phenology in Ascertaining the Thermal and Photo-thermal Requirements for Barley. American Institute of Crop Ecology. Washington, D.C., 200p.–Sharratt, B., 1999. Thermal requirements for barley maturation and leaf development in interior Alaska. Field Crops Research, 63:179–184.
- ↑ Bootsma, A., 1984. Forage crop maturity zonation in the Atlantic Region using growing degree days. Canadian Journal of Plant Science, 64:329–338.–Breazeale, D., R. Kettle and G. Munk, 1999. Using growing degree days for alfalfa production. Fact Sheet 99-71. University of Nevada Cooperative Extension Service.
- ↑ Crawford, R.M.M., 1997. Oceanity and the ecological disadvantages of warm winters. Botanical Journal of Scotland, 49:205–221.
- ↑ Shaykewich, C.F and D. A. Blatta, 2001. Heat Units for Potato Production in Manitoba. Manitoba Agriculture, Soils and Crops Branch, 6p. Available at: wac01s01.html www.gov.mb.ca/agriculture/climate/ wac01s01.html.
- ↑ Sharratt, B., 1994. Observations and modeling of interactions between barley yield and evapotranspiration in the subarctic. Agricultural Water Management, 25:109–119.
- ↑ Gitay, H., S. Brown, W. Easterling and B. Jallow, 2001. Ecosystems and their goods and services. In: J.J. McCarthy, O.F. Canziani, N. A. Leary, D.J. Dokken and K.S. White, (eds.). Climate Change 2001: Impacts, Adaptation, and Vulnerability. Contribution of Working Group II to the Third Assessment Report of the Intergovernmental Panel on Climate Change, pp. 235–342. Cambridge University Press.
- ↑ Beniston, M., R.S.J. Tol, R. Delecolle, G. Hoermann, A. Inglesias, J. Innes, A.J. McMichael, W.J.M. Martens, I. Nemesova, R. Nicholls and F.L. Toth, 1998. Europe. In: R. T. Watson, M.C. Zinyowera, R.H. Moss and D.J. Dokken (eds.). The Regional Impacts of Climate Change: An Assessment of Vulnerability, pp. 151–185. A Special Report of Working Group II of the Intergovernmental Panel on Climate Change. Cambridge University Press.
- ↑ Shriner, D.S., R.B. Street, R. Ball, D. D’Amours, K. Duncan, D. Kaiser, A. Maarouf, L.R. Mortsch, P.J. Mulholland, R. Neilson, J. A. Patz, J.D. Scheraga, J.G. Titus, H.Vaughan and M. Weltz, 1998. North America. In: R. T. Watson, M.C. Zinyowera, R.H. Moss, and D.J. Dokken (eds.). The Regional Impacts of Climate Change: An Assessment of Vulnerability. A Special Report of Working Group II of the Intergovernmental Panel on Climate Change, pp. 255–330. Cambridge University Press.
- ↑ Carter,T.R., R. A. Saarikko and K.J. Niemi, 1996. Assessing the risks and uncertainties of regional crop potential under a changing climate in Finland. Agricultural and Food Science in Finland, 5:329–350.
- ↑ Warrick, R. A., 1988. Carbon dioxide, climate change and agriculture. The Geographical Journal, 154:221–233.