Anticipated changes in physical conditions in the Arctic
This is Section 9.2.5 of the Arctic Climate Impact Assessment
Lead Author: Harald Loeng; Contributing Authors: Keith Brander, Eddy Carmack, Stanislav Denisenko, Ken Drinkwater, Bogi Hansen, Kit Kovacs, Pat Livingston, Fiona McLaughlin, Egil Sakshaug; Consulting Authors: Richard Bellerby, Howard Browman,Tore Furevik, Jacqueline M. Grebmeier, Eystein Jansen, Steingrimur Jónsson, Lis Lindal Jørgensen, Svend-Aage Malmberg, Svein Østerhus, Geir Ottersen, Koji Shimada
During the 1990s it became apparent that global warming would occur more rapidly and with greater impact in the high latitudes[1]. Observations showed substantial variability in the arctic water column, atmosphere, ice cover, and export to the North Atlantic[2]. This variability spans temporal scales that include interannual fluctuations, interdecadal patterns, and long-term trends. The first challenge is to define the temporal scales and magnitudes of arctic variability, for example to distinguish recurrent modes from trends and to separate natural from anthropogenic climate forcing. The second challenge is to understand and predict the impact of changes in the physical environment on the biota. This section links the various sub-components of the physical system (e.g., land/ocean exchanges, shelf/basin interactions, inter-basin fronts, and the transport of ice and water properties) to climate-scale forcing at seasonal and decadal timescales. The assessment is based on the outcome of Chapter 4 (Anticipated changes in physical conditions in the Arctic), plus the most recent results from the Intergovernmental Panel on Climate Change[3] and information from the peer reviewed literature.
Contents
Atmospheric circulation (9.2.5.1)
General features of projected changes in the arctic atmosphere relevant to marine processes are summarized in Table 9.1. Air temperatures are very likely to increase by 4 to 5° C over most of the Arctic by 2080. As air temperatures are very likely to increase more in winter than in summer there is very likely to be an associated decrease in the amplitude of the seasonal cycle. The IPCC[4] reported that some studies have shown increasingly positive trends in the indices of the NAO/AO in simulations with increased concentrations of GHGs. The magnitude and character of the changes vary for the different models. In general, the intensity of winter storms and the zonal temperature gradient are likely to decrease. However, in some regions (e.g., the Labrador, Nordic, Bering, and Beaufort Seas) an increase in storm activity is likely. Storm tracks are likely to shift northward under stronger AO and NAO conditions. Christensen and Christensen[5] projected that the atmosphere will contain more water under a warmer climate, making more water available for precipitation. Model scenarios project an increase in precipitation of 10% by 2080 and an increase in cloud cover of 8%.
|
Table 9.1. Changes in surface and boundary forcing based on model projections and/or extrapolation of observed trends. Unless otherwise specified these projected changes are very likely to happen. | |||
|
2020 |
2050 |
2080 | |
|
Air temperature |
|||
|
annual meana |
1–1.5° C increase |
2–3° C increase |
4–5° C increase |
|
winter |
2.5° C increase |
4° C increase |
6° C increase in the central Arctic |
|
summer |
0.5° C increase |
0.5–1.0° C increase |
1° C increase |
|
seasonality |
Reduced seasonality (warmer winters compared to summer) | ||
|
interannual |
No change |
No change |
No change |
|
Wind |
|||
|
means |
While changes in winds are expected, there is at present no consistent agreement from general circulation models as to the magnitude of the changes in either speed or direction | ||
|
storm frequency |
Possible increase in storm intensity regionally (Labrador, Beaufort, Nordic Seas); in general, winter storms will decrease slightly in intensity because the pole to equator temperature gradient decreases | ||
|
storm tracks |
Probable northward shift in storm tracks regional issues In areas of sea-ice retreat, there will be an increase in wind-driven effects (currents, waves) because of longer fetch and higher air–sea exchange | ||
|
Precipitation/runoff |
|||
|
meanb |
2% increase |
6% increase |
10% increase |
|
seasonality |
Decreased seasonality in runoff related to earlier snow melt. Seasonality in precipitation unclear | ||
|
snow on ice |
1–2% increase |
3–5% increase |
6–8% increase |
|
Sea level |
5 cm rise |
15 cm rise |
25 cm rise |
|
Cloud cover |
|||
|
general |
3% increase |
5% increase |
8% increase |
|
spring, autumn |
4–5% increase |
5–7% increase |
8–12% increase |
|
winter, summer |
1–2% increase |
3–5% increase |
4–8% increase |
|
Cloud albedo |
Not available |
Not available |
Not available |
|
aThese numbers are averages and should be higher in the central Arctic and lower over southern regions; bbased on the estimates of precipitation minus evaporation in Chapter 6 (Anticipated changes in physical conditions in the Arctic). | |||
Paeth et al.[6] assessed changes in the mean and variance of the NAO at decadal scales. They predicted that the mean value will increase, while the variance will decrease, suggesting that the NAO will stabilize in the positive phase. The consequences of such a scenario are likely to be more westerly winds and milder weather over Europe during winter, while the Labrador Sea would be likely to experience more northwesterly winds and colder conditions. Shindell et al.[7] and Fyfe et al.[8] also predicted a positive trend in the NAO index. Ulbrich and Chrisroph[9] concluded that there will be a northeastward shift of the NAO’s northern variability center from a position close to the east coast of to the Norwegian Sea while Shindell[10] stated that if the dynamic strengthening of the arctic vortex continues the Northern Hemisphere is likely to continue to warm up rapidly during winter.
Despite present uncertainties, it can be concluded that if the NAO increased, it would be likely to lead to increased westerly winds over the North Atlantic and more frequent storm patterns. Any trend toward positive AO conditions would be very likely to result in a weakening of the Beaufort High and increased cyclonicity over Canada Basin, as noted by Proshutinsky and Johnson[11]. Winds over the Bering/Chukchi Seas would probably also weaken. Changes in atmospheric forcing will impact upon most of the features discussed in the following sections; sea-ice conditions, ocean circulation and water properties, ocean fronts, and thermohaline circulation.
Sea-ice conditions (9.2.5.2)
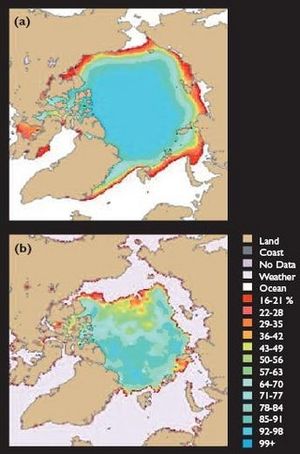
Under scenarios of climate warming (Climate change), sea-ice (Sea ice in the Arctic) cover is expected to "retreat" further into the Arctic Basin, to breakup earlier and freeze-up later, and to become thinner and more mobile. For example, substantial differences in sea-ice conditions were observed in summer 2002 compared to the climatology of sea-ice conditions in summer for the period 1978 to 2002[12] (Fig. 9.11). Substantial changes in sea-ice conditions are evident in Canada Basin north of the Chukchi Sea, and in the sea-ice extent in Fram Strait and north of Svalbard.
Projected changes in sea-ice conditions for the 21st century are summarized in [[Chapter 6 (Anticipated changes in physical conditions in the Arctic)]2] based on output from the five ACIA (Arctic Climate Impact Assessment (ACIA))-designated global climate models. Tables 9.2 and 9.3 show the maximum and minimum values for sea-ice (Sea ice in the Arctic) extent projected by these five models, respectively. The values shown are the adjusted model values, meaning that the data have been "normalized" by forcing a fit to the 1981–2000 baseline observations. The projections vary widely, especially for the summer. The CSM_1.4 (National Center for Atmospheric Research) model consistently projects the greatest sea-ice extent and the least amount of change, while the CGCM2 (Canadian Centre for Climate Modeling and Analysis) model consistently projects the least sea ice and the greatest amount of change. However, all five ACIA designated models agree in projecting that sea-ice coverage will decrease both in summer and winter.
|
Table 9.2. Sea-ice extent in March (106 km2) as projected by the five ACIA-designated models. | ||||
|
Model |
1981–2000 | 2011–2030 | 2041–2060 | 2071–2090 |
|
CGCM2 |
7.28 | 3.33 | 0.55 | 0.05 |
|
CSM_1.4 |
16.32 | 15.00 | 14.16 | 14.01 |
|
ECHAM4/ OPYC3 |
16.19 | 15.62 | 14.97 | 14.38 |
|
GFDL-R30_c |
16.17 | 15.60 | 14.86 | 14.52 |
|
HadCM3 |
16.32 | 15.53 | 14.87 | 13.74 |
|
CGCM2: Canadian Centre for Climate Modelling and Analysis; CSM_1.4: National Center for Atmospheric Research; ECHAM4/OPYC3: Max-Planck Institute for Center for Meteorology; GFDL-R30_c: Geophysical Fluid Dynamics Laboratory; HadCM3: Hadley Centre for Climate Prediction and Research. | ||||
|
Table 9.3. Sea-ice extent in September (106 km2) as projected by the five ACIA-designated models. | ||||
|
Model |
1981–2000 | 2011–2030 | 2041–2060 | 2071–2090 |
|
CGCM2 |
16.14 | 15.14 | 13.94 | 13.26 |
|
CSM_1.4 |
7.22 | 7.00 | 6.72 | 6.59 |
|
ECHAM4/ OPYC3 |
7.02 | 6.03 | 4.06 | 2.68 |
|
GFDL-R30_c |
7.28 | 5.91 | 4.33 | 2.91 |
|
HadCM3 |
7.41 | 6.22 | 5.12 | 3.22 |
|
CGCM2: Canadian Centre for Climate Modelling and Analysis; CSM_1.4: National Atmospheric Research; ECHAM4/OPYC3: Max-Planck Institute for Meteorology; GFDL-R30_c: Geophysical Fluid Dynamics Laboratory; HadCM3: Hadley Centre for Climate Prediction and Research. | ||||
Areal Ice Extent
Increases in the AO are likely to result in the Transpolar Drift taking a strongly cyclonic diversion across the Lomonosov Ridge and into Canada Basin and the Beaufort Gyre shrinking back into the Beaufort Sea ([[ice effect on marine systems in the Arctic|Fig. 9.3). This is very likely to alter the advective pathways and basin residence times of sea ice formed in winter on the Eurasian shelves. Furthermore, the ice extent in early autumn is also likely to be reduced, due to expected changes in wind] forcing and winter air temperature in the eastern Russian Arctic[13]. By 2050, the CGCM2 model, which results in the greatest rate of sea-ice melt, projects that the entire marine Arctic may be sea-ice free in summer (Table 9.3). The other four models agree in projecting the presence of summer sea ice, at least until the end of the 21st century, but disagree in their projections of the extent of areal coverage. While the changes in winter sea-ice coverage are generally projected to be much smaller than in summer (Table 9.2), it is likely that the Barents Sea and most of the Bering Sea may be totally ice free by 2050 (see [[Chapter 6 (Anticipated changes in physical conditions in the Arctic)]3]).
Seasonal sea-ice zone
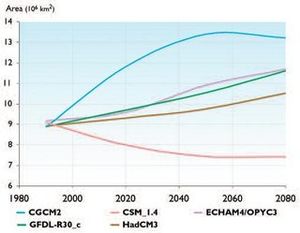
Every year around 7 to 9 million km2 of sea ice freezes and melts in the Arctic[14]. Four of the five ACIA-designated models project that the seasonal sea-ice zone is likely to increase in the future because sea-ice coverage will decrease more during summer than winter (Fig. 9.12). This suggests that sea ice thickness is also likely to decrease because a single winter of sea-ice growth is an insufficient period to reach equilibrium thickness. There is very likely to be a shorter period of sea-ice cover due to earlier breakup and later freeze-up. Longer ice-free periods will significantly increase sub-surface light availability. (At present, sea ice lingers in the Arctic Ocean through May and June, months of high levels of insolation.) A delayed freeze-up will also expose more open water to forcing by autumn storms. Retreat of the seasonal sea-ice zone northward into the central arctic basins will affect nutrient and light availability on the continental shelves during summer and autumn by increasing the areas of open water, wind mixing, and upwelling.
Fast ice is not explicitly included in climate model scenarios. Although reductions in the extent, thickness, and stability of fast ice are likely to occur, the implications of climate change for fast ice is recognized as a gap in knowledge.
Ocean circulation and water properties (9.2.5.3)
Changes in the surface and boundary forcing (Table 9.1) will probably result in changes in ocean circulation, water mass properties, and ocean processes (Section 9.2.3 (Anticipated changes in physical conditions in the Arctic)). Sea surface temperatures are likely to increase by approximately the same amount as air temperatures in areas that are sea-ice free, but are very likely to remain the same (i.e., near freezing) in ice-covered waters. By 2020 the upper water layer of all arctic shelves is very likely to exhibit stronger seasonality in terms of sea-ice cover, and by 2080, 50 to 100% of the Arctic Ocean is likely to undergo such variability. Whether or not there is a concurrent increase in mixed-layer depth in summer depends on the relative coupling of wind and ocean in the presence or absence of sea ice, which in turn depends on the magnitude of internal ice stress[15]. McPhee and Morison[16] argue that, away from coastal areas, in summer most of the wind momentum transferred to the sea ice is subsequently passed on to the water and that sea ice may even serve to enhance the coupling of wind to water. Mixed-layer deepening is also very likely to be influenced by increased river discharge. Sub-sea light levels will increase in areas where sea ice is absent, but are very likely to decrease where sea ice remains due to increased snow.
General circulation models project a strengthening of the AO leading to increased atmospheric cyclonicity over the Arctic Ocean during the 21st century[17]. This, in turn, is very likely to affect the sea-ice drift and surface currents in the Arctic Basin. With increased cyclonicity the Transpolar Drift is very likely to shift eastward to favor drift directly toward Fram Strait[18]. The Beaufort Gyre is very likely to weaken and retreat into Canada Basin, following the "cyclonic mode" discussed by Proshutinsky and Johnson[19] and Polyakov and Johnson[20]. In turn, changes in the Beaufort Gyre are very likely to affect the storage and release of freshwater in Canada Basin[21]. Under this scenario, the position of the Atlantic/Pacific Front will tend to align with the Alpha-Mendeleyev Ridge rather than the Lomonosov Ridge[22], and perhaps retreat further into Canada Basin. Modeling studies by Zhang and Hunke[23] and Maslowski et al.[24] are in general agreement.
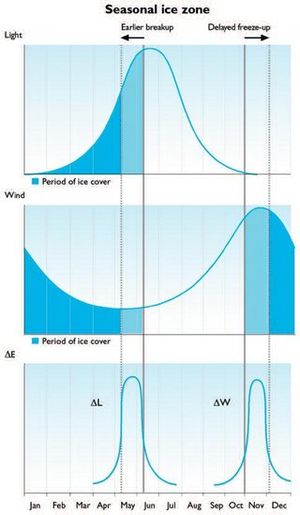
Relatively small changes in the timing of sea-ice breakup and freeze-up (of the order of a few weeks) are very likely to have a disproportionate effect on the physical forcing of arctic waters (Fig. 9.13). For example, under present-day conditions, much of the incoming solar radiation during the long summer days is reflected back by the ice and snow and so does not reach the water column to warm it. A later freeze-up will mean that the ocean surface is exposed to wind forcing by autumn storms for a longer period of time. Combined with prolonged exposure of the shelf break to wind forcing, this is very likely to enhance vertical mixing and the shelf–basin exchange of heat, salt, nutrients, and carbon.
Thresholds for change in the Arctic Ocean
Three potential thresholds for substantial changes in ocean circulation and water mass properties are described in this section (also see Box 9.4).
- If and when the seasonal sea-ice zone retreats annually beyond the shelf break.
- If and when the Arctic Ocean becomes sea-ice free in summer.
- If and when parts of the deep arctic basins (e.g., the western Nansen Basin and western Canada Basin) remain sea-ice free in winter.
The seasonal retreat of sea ice from shelf domains to the deep Arctic Basin, anticipated as soon as 2020 (Tables 9.2 and 9.3, and [[Chapter 6 (Anticipated changes in physical conditions in the Arctic)]4]), will expose the shelf-break region to upwelling- and downwelling favorable winds, both for longer and more often. The coupling of wind and water in the presence of sea ice is not straightforward and can be of greater significance than in sea-ice free waters if internal ice stress (a function of ice concentration and compactness) is sufficiently small[25]. It is thus likely that a zone of maximum coupling exists in the transition from full sea-ice cover to open water, and that if this zone were located over the shelf break, then shelf–basin exchange would also increase[26]. Such exchange would draw more Pacific- and Atlantic-origin waters onto the shelves, with an associated increase in the delivery of salt, heat, and nutrients.
|
Box 9.4. Effects of climate change in the Arctic on global ocean circulation and climate The Arctic plays a key role in the global climate through its production of North Atlantic Deep Water (NADW). North Atlantic Deep Water is formed by the mixture of waters produced by thermohaline ventilation in the Arctic Mediterranean, entrained Atlantic water, and water convected in the Labrador Sea. Once formed the NADW flows southward through the Atlantic Ocean and, together with the denser Antarctic Bottom Water (AABW), forms the source of all the deep and bottom waters of the World Ocean. NADW is of considerable significance for the global thermohaline circulation (THC). If climate change should result in reduced thermohaline ventilation in the Arctic, there is considerable – although not unambiguous – evidence for a reduced NADW–THC through the Atlantic[27]. A proper understanding of this scenario requires an understanding of the relative magnitudes of the NADW and the AABW contributions to the global THC.Traditional estimates of NADW production[28] are of the order of 15 Sv and this is supported by modern estimates based on the WOCE (World Ocean Circulation Experiment) data set[29]. Estimates of AABW production are less consistent, but even the highest estimates[30] indicate that AABW production is currently significantly less than NADW production. The NADW is therefore considered to account for more than half the deep-water production of the World Ocean at present.The latest IPCC assessment[31] concludes that most models show a weakening of the Northern Hemisphere THC, which contributes to a reduction in surface warming in the northern North Atlantic. The more extreme scenario of a complete shutdown of the THC would have a dramatic impact on the climate of the North Atlantic region, on the north–south distribution of warming and precipitation, on sea-level rise, and on biogeochemical cycles[32].The IPCC concluded this to be a less likely, but not impossible, scenario. More reliable estimates of its likelihood and consequences require more reliable coupled ocean–atmosphere models than are presently available (see Section 9.7 (Anticipated changes in physical conditions in the Arctic)). |
The disappearance of sea-ice (Sea ice in the Arctic) cover in the Arctic in summer, as projected by the CGCM2 model by 2050, will have far reaching effects on upper-layer circulation and water properties. Direct exposure of surface waters to wind will enhance wind-driven circulation. Also, it is probable that wind-driven vertical mixing will increase the depth of the surface mixed layer, depending upon the strength of local stratification. For example, wind-driven deepening of the mixed layer is very likely to be more pronounced in the more weakly stratified Nansen Basin than in Canada Basin with its strong Pacific influence. Concurrently, the seasonal sea-ice zone is very likely to increase (perhaps by 10 million km2) owing to projections that the rate of decrease in sea-ice cover for summer will be greater than for winter (Fig. 9.12; Tables 9.2 and 9.3). Some model scenarios project that by 2080 the formation of sea ice in winter will no longer completely cover the Arctic Basin. If this does occur, two parts of the Arctic Basin are potential sites for sea-ice free or at least decreased ice concentrations in winter: the western Nansen Basin and western Canada Basin. The first site is the weakly stratified western Nansen Basin adjacent to the inflow and subduction of Atlantic waters[33]. Here the incoming waters are warmest and the overlying halocline is weakest. At present, this region has the deepest winter mixed layer in the central Arctic Ocean. Under the extreme climate change scenario in which sea ice in winter no longer completely covers the Arctic Basin, the Nansen Basin is likely to become a region of strong convection and deepwater formation. However, the dynamics are more likely to resemble the present day Nordic Sea system, i.e., with deeper mixed-layer ventilation or convection[34]. However, this argument supposes an increased transport of warmer Atlantic water into the Arctic whereas some models[35] suggest a weakening or southward shift of the THC.
The second site is located in the western Canada Basin immediately north of the Chukchi Sea and above the Northwind Ridge (Box 9.5). This area is adjacent to the inflow of shallow and relatively warm summer water through the Bering Strait and across the Chukchi Sea. The spread of this relatively warm water takes place within the Beaufort Gyre at depths of 40 to 60 m, and is thus within the limits of winter haline convection[36].
At both sites, it is their proximity to warm inflows from the Pacific and Atlantic that establishes conditions that may reduce winter sea-ice cover. It is not clear, however, if release of heat from subsurface sources would serve to melt the sea ice, or merely keep new ice from forming. In either case ecosystems currently located in the Nordic and Bering Seas are very likely to shift northward.
|
Box 9.5.The Chukchi albedo feedback loop: An Achilles Heel in the sea-ice cover of the western Arctic? Attention has long focused on the role of Atlantic inflow waters in the transport of heat within the Arctic Basin, and its potential to impact upon the overlying sea ice should the arctic halocline weaken or break down.This box highlights the potential for Pacific inflow waters to impact upon the overlying sea ice, and the potential for this inflow to amplify locally the well-known albedo feedback mechanism. Pacific inflow waters are warmed in summer as they travel northward across the seasonally ice-free parts of the Bering and Chukchi Seas. On reaching the shelf break, these waters subduct below the polar mixed layer and enter the arctic halocline, forming Pacific Summer Water (PSW), identified by a shallow temperature maximum at depths 40 to 60 m and salinities near 31.5. The water at the temperature maximum may be higher in years with extensive open waters over the Bering and Chukchi Seas. Summer climatological data (see panel, [37]) demonstrates the accumulation of such water within the Beaufort Gyre over the eastern flank of the Northwind Ridge. One possibility for the fate of this stored heat within the PSW in the southwestern Canada Basin is that it acts to retard the growth of sea ice during the subsequent winter. Therefore, the amount of summer melting (freshwater addition) and winter freezing (freshwater removal) are not balanced, and ice floes drifting over the “warm patch” will be thinner than in surrounding waters.The thin sea ice observed east of the Northwind Ridge, also noted by Bourke and Garrett[38], is evidence of local PSW influence. When winter sea-ice growth falls below a critical (and unknown) value at the start of the melt season, the thickness and concentration of sea ice over the region would be sufficient to reduce albedo and initiate further sea-ice reduction, thus initiating a feedback. An alternate explanation for the record low sea-ice concentrations in summer 2002 is given by Serreze et al.[39]. |

Changes in the Nordic and the Barents Seas
An 80-year CMIP2 integration (1% per year increase in the atmospheric CO2 concentration) with the Bergen Climate Model (BCM) was used to estimate changes in the Nordic and Barents Seas[40]. This model has a relatively high spatial resolution in these areas and is believed to give as reliable projections for these areas as can be obtained at present. However, in common with other such models, its predictive capability is limited and the results presented should be seen as possible, rather than likely outcomes.
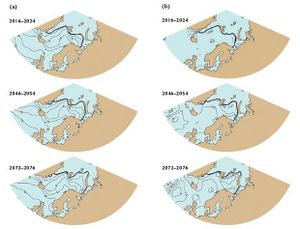
The evolution of the winter sea surface temperature field is shown in Fig. 9.14. From the present to 2020 a minor cooling is projected over most of the area. The greatest decrease is projected to occur along the marginal ice zone in the Barents Sea and off the East Greenland coast, with a maximum decrease of more than 1° C projected in Denmark Strait. Some of this cooling is likely to be associated with the weaker westerlies projected for this period[41]. In the central Nordic Seas a warming of 0.5° C is projected. By 2050, the entire Nordic Seas are projected to become warmer with the exception of a small area in Denmark Strait. The largest warming is projected to occur in the northeastern Barents Sea and to the south of Iceland. With the doubling of the atmospheric CO2 concentration assumed by 2070, surface temperatures in the Nordic Seas are projected to increase by 1 to 2° C, with the highest values in the Barents Sea. Minimum warming (<0.5° C) is projected in the Denmark Strait.
Projected salinity changes in the Nordic Seas are generally small, except for areas influenced by coastal runoff and the melting of sea ice. By 2020, there is projected to be a freshening (a salinity decrease of 0.1 to 0.3) in the southeast Barents Sea and the Kara Sea, and a weak freshening along the East Greenland coast. The freshening continues to the 2050s, with salinity reductions north of Siberia in the range 0.1 to 0.5. A significant freshening is also projected in the Arctic Ocean (a salinity decrease of 0.3 to 0.5), which is advected southward with the East Greenland Current into the Denmark Strait and East Icelandic Current. The arctic waters are projected to become slightly more saline, but not exceeding a salinity increase of 0.1. By the 2070s, the model output suggests 0.1 to 0.2 more saline water south of the inflow area, and less than 0.1 more saline arctic waters in the Nordic Seas. North of Siberia and in the Arctic Ocean, salinities are projected to decrease by 0.5 to 1.0, and a tongue of fresher water is projected along the East Greenland Coast.
In terms of volume flow, from 2000 to 2020 the Bergen Climate Model projects a small (<10%) increase in the net Atlantic inflow through the Iceland–Scotland Gap, mainly near Iceland, and a corresponding increase in the Denmark Strait outflow. There is generally a weakening by a few percent of the cyclonic gyre in the Nordic Seas. By 2050, the Nordic Seas gyre is projected to have weakened by a further 10%. A greater inflow of arctic waters is projected via the eastern branch (east of the Faroe Islands), and less via the western. No significant changes are projected for the Barents Sea. Toward 2070 a further reduction in the internal cyclonic flow in the Nordic Seas is projected. There is also a strengthening (~0.25 Sv, ~12%) in the transport of arctic waters through the Barents Sea with a compensating reduction through Fram Strait[42].
Seas of the North American Arctic
Projections of change in the Bering, Chukchi, and Beaufort Seas, the Canadian Archipelago, Baffin and Hudson Bays, and the Labrador Sea are highly uncertain as many important aspects of these regions (e.g., the presence of fast ice, strong seasonality, complex water mass structure, through flow) are not included in the current global climate models. The following discussion is thus highly speculative.
These seas are expected to experience the general changes in sea ice, sea surface temperature, mixed-layer depth, currents, fronts, nutrient and light levels, air-temperature, winds, precipitation and runoff, sea level, and cloud cover summarized in Tables 9.1 and 9.4, but owing to their more southerly latitude and contact with terrestrial systems, the changes may be greater and perhaps faster. Because the Bering/Chukchi shelf is very shallow the effects of the albedo feedback mechanism, are likely to be amplified as water moves across ice-free parts of the shelves. Preconditioning of Pacific inflow waters during their transport across the shelf supplies a reservoir of heat at shallow depths within the offshore halocline. This may affect conditions to the east on the Beaufort Shelf. Such heat could potentially retard sea-ice growth the following winter.
The Canadian Archipelago is a large (~2.9 million km2, including Foxe Basin and Hudson Strait) and complex shelf domain for which it is particularly difficult to draw conclusions regarding global warming[43]. Sea ice remains landfast for more than half the year there, but the presence of fast ice is not included in the global climate models. The general trends projected by the ACIA-designated models and summarized in Table 9.1 are likely to be representative for this region. Two additional features of the Canadian Archipelago are (1) that it serves as a passageway for water masses moving from the Arctic Ocean to the North Atlantic via Baffin Bay and the Labrador Sea, and (2) that its sea-ice domain is a variable mixture of local growth and floes imported from the Arctic Basin, and that transport through the Canadian Archipelago is governed in the present climate by ice bridges across connecting channels[44].
Large uncertainties exist in the changes projected for the Labrador Sea. If the NAO increases as some models project, then there are likely to be stronger northwesterly winds and colder air masses over this region. This would lead to increased sea-ice cover, colder water temperatures, and increased deep convection. Conversely, general atmospheric warming would lead to warmer water temperatures, decreased sea-ice cover, and decreased convection. The slight increase in precipitation may possibly lower salinities over the Labrador Sea, with the largest decline occurring over the shelves due to the accumulation of river discharges. Temperatures in the region are also likely to be greatly influenced by the relatively warm Irminger Current inflow but given the poor understanding of future wind fields, changes in its strength are highly uncertain. Polynyas, such as the North Water Polynya in northern Baffin Bay, owe their existence, at least in part, to winds that move sea ice from the area of its formation southward, so maintaining the area as open water even in the middle of winter. If the winds change, the number and size of polynyas are also likely to change.
|
Table 9.4. Summary of changes projected in ocean conditions according to the five ACIA-designated models relative to baseline conditions. Unless otherwise specified these projected changes are very likely to happen. | |||
|
2020 |
2050 |
2080 | |
|
Sea ice |
|||
|
duration |
Shorter by 10 days |
Shorter by 15–20 days |
Shorter by 20–30 days |
|
winter extent |
6–10% reduction |
15–20% reduction |
Probable open areas in high Arctic (Barents Sea and possibly Nansen Basin) |
|
summer extent |
Shelves likely to be ice free |
30–50% reduction from present |
50–100% reduction from present |
|
export to North Atlantic |
No change |
Reduction beginning |
Strongly reduced |
|
type |
Some reduction in multi-year ice, especially on shelves |
Significant loss of multi-year ice, with no multi-year ice on shelves |
Little or no multi-year ice |
|
landfast ice |
Possible thinning and a retreat in southern regions |
Probable thinning and further retreat in southern regions |
Possible thinning and reduction in extent in all arctic marine areas |
|
Sea surface temperature |
|||
|
winter/summer (outside THC regions and depending upon stratification and advection) |
An increase by about the same amount as the air temperatures in ice-free regions. No change in ice-covered regions | ||
|
seasonality |
All shelf seas to undergo seasonal changes |
30–50% of Arctic Ocean to undergo seasonal changes |
50–100% of Arctic Ocean to undergo seasonal changes |
|
Mixed-layer depth |
Increase during summer in areas with reduced ice cover and increased wind | ||
|
Currents |
In regions affected by THC, modifications to the THC will change the strength of the currents | ||
|
Ocean fronts |
Fronts are often tied to topography but with altered current flows, may rapidly shift their position | ||
|
Light exposure |
With decreasing ice duration and areal extent, more areas to be exposed to direct sunlight | ||
|
Nutrient levels |
Substantial increases over the shelf regions due to retreat of the sea ice beyond the shelf break |
High levels on shelves and in deep arctic basins; higher levels due to deeper mixed layer in areas of reduced ice cover | |
Ocean fronts (9.2.5.4)
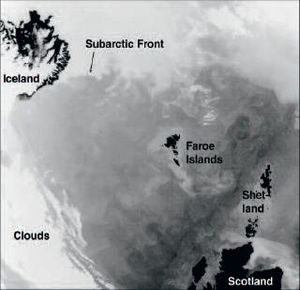
Open ocean fronts generally separate water masses, are associated with strong current flows, and act as barriers for marine organisms. It is difficult, however, to provide reliable estimates of how fronts will respond to climate change since few models provide such information. Most of the deep ocean fronts are linked to bottom topography and so it is likely that these will maintain their present positions, e.g., along the Mohn Ridge in the Greenland Sea and around the Svalbard Bank in the Barents Sea. However, where topographic steering is weak, fronts may disappear or be displaced. The eastern part of the Polar Front in the Barents Sea is very likely to disappear as a result of climate change[45]. In the Norwegian Sea, the front to the east of Iceland is likely to move northeastward to the position it occupied during the warm period at Iceland between 1920 and 1964. The reduced inflow of Atlantic water projected by some models would be very likely to shift ocean fronts toward the continental slope region. For example, in the Norwegian Sea the Subarctic Front separates Atlantic and arctic waters, typically lies a few hundred kilometers north of the Faroe Islands (Fig. 9.15), and reduced inflow would be likely to move the front closer to or even onto the Faroe Shelf. If such a shift takes place a cooling of the order of 5° C would possibly occur in the areas affected. Assessing the likelihood of its occurrence is, however, far beyond the capability of present-day models.
Possibility and consequences of altered thermohaline circulation (9.2.5.5)
A major uncertainty in projecting the extent of climate change in the Arctic concerns the response of the THC to altered freshwater flux. In turn, the THC of the Arctic is an integral part of the global THC. At present, climate models do not generate unambiguous results. Some project a significant weakening, or even collapse, of the THC, while others project a stable THC. An alternative view is that the THC will not weaken or shut down, but that the sites of ventilation will relocate north or south within the system[46].
Several coupled atmosphere–ocean general circulation models have been used to simulate the effects of increased GHG emissions on the North Atlantic THC. Rahmstorf[47] summarized the outcome of six such simulations, all of which projected a weakening of the Atlantic overturning. Latif et al.[48], however, did not find weakening of the overturning in their model. The models tend to agree that global climate change is very likely to include increased freshwater input to the Arctic Mediterranean, but tend to disagree on the associated consequences. Much of the uncertainty involves the response of the Atlantic inflow and the positive feedback mechanism that it can induce through salt advection. In the simulation by Latif et al.[49], the feedback mechanism was counteracted by the increased salinity of the Atlantic inflow to the Arctic Mediterranean. The salinity increase in their model was explained by increased freshwater transport from the Atlantic to the Pacific in the tropical atmosphere. Latif[50] used the observed salinity increase at Bermuda to support their conclusions. In the Nordic Seas, observations indicate the opposite with a general freshening in the upper layers[51].
Most of the general circulation models that project a weakening of the THC project a reduction of no more than 50% for the 21st century[52]. Some, however, project instabilities and the possibility of a more or less total collapse of the THC when the intensity of the circulation falls below a certain threshold[53]. Although such results may explain the instabilities reported for the glacial climate state, their applicability to a GHG-warming scenario cannot be assessed objectively at present.
Observations of the salinity of overflow water in the Atlantic confirm a long-term decrease[54]. However, observational evidence for or against a reduction in the THC itself is uncertain. While many observations indicate a reduction in deep convection in the Greenland Sea since 1970, deep convection to depths below the sill level of the Greenland–Scotland Ridge is still occurring[55] and there are also other sources of dense water. Observations of the Faroe Bank Channel overflow (Fig. 9.16) indicate significant decreases in volume flux during the latter half of the 20th century, especially since 1970[56]. A lack of similar data for the Denmark Strait overflow leaves open the question as to whether the change in the Faroe Bank Channel overflow is representative of the total overflow flux.
A significantly weakened THC in the Nordic Seas is thus a possible scenario. Reduced ventilation implies reduced renewal rates for deep water in some of the basins, and this seems to be happening in the Norwegian Basin[57]. These changes are slow, however. The magnitude of the inflow weakening and its spatial extent will possibly be influenced by changes in the wind field[58]. The waters most likely to be affected in this scenario are those to the north of Iceland and the Faroe Islands, those in the southern Norwegian Sea, and those in the Barents Sea.
The situation in the waters to the north of Iceland, where the present-day climate is associated with a highly variable Atlantic inflow, can be used to illustrate a potential impact of climate change. Hydrographic investigations show clear seasonal variation in this inflow, with a maximum inflow in summer. There are, however, pronounced interannual differences in the variability of the inflow that affect the temperature, salinity, and stability of the water column[59]. Most of the Atlantic inflow (80–90%, see Fig. 9.7) enters the Arctic Mediterranean through the Norwegian Sea. This region is characterized by abnormally high sea surface temperatures (up to almost 10° C) compared to zonal averages[60]. Much of this elevation is due to the heat flux from the inflowing Atlantic water. The temperature decrease in some areas, especially in winter, resulting from a severely weakened Atlantic inflow would thus be much larger than the projected warming ([[Chapter 4 (Anticipated changes in physical conditions in the Arctic)]2]) by the end of the 21st century according to certain models[61]. Thus, there is the possibility that some areas of the Arctic Ocean will experience significant regional cooling rather than warming, but present models can assess neither the probability of this occurring, nor its extent and magnitude. According to Rahmstorf[62] the extent to which Europe’s mild winters depend on the transport of heat by the North Atlantic Current is presently unknown.
Chapter 9: Marine Systems
9.1. Introduction (Anticipated changes in physical conditions in the Arctic)
9.2. Physical oceanography
9.2.1. General features (Anticipated changes in physical conditions in the Arctic)
9.2.2. Sea ice (Sea ice effect on marine systems in the Arctic)
9.2.3. Ocean processes of climatic importance
9.2.4. Variability in hydrographic properties and currents
9.2.5. Anticipated changes in physical conditions
9.3. Biota
9.3.1. General description of the Arctic biota community
9.3.2. Physical factors mediating ecological change
9.3.3. Past variability – interannual to decadal
9.3.4. Future change – processes and impacts on biota
9.4. Effects of changes in ultraviolet radiation
9.5. The carbon cycle and climate change
9.6. Key findings (Anticipated changes in physical conditions in the Arctic)
9.7. Gaps in knowledge and research needs
References
Citation
Committee, I. (2012). Anticipated changes in physical conditions in the Arctic. Retrieved from http://editors.eol.org/eoearth/wiki/Anticipated_changes_in_physical_conditions_in_the_Arctic- ↑ Morison, J., K. Aagaard and M. Steele, 2000. Recent environmental changes in the Arctic: a review. Arctic, 53:359–371.–SEARCH, 2001. SEARCH: Study of Environmental Arctic Change, Science Plan. Polar Science Center, Applied Physics Laboratory, University of Washington, Seattle, 89pp.
- ↑ Belkin, I.M., S. Levitus, J. Antonov and S.-A. Malmberg, 1998. "Great Salinity Anomalies" in the North Atlantic. Progress in Oceanography, 41:1–68.–Carmack, E.C., R.W. Macdonald, R.G. Perkin, F.A. McLaughlin and R.J. Pearson, 1995. Evidence for warming of Atlantic water in the southern Canadian Basin of the Arctic Ocean: Results from the Larsen-93 expedition. Geophysical Research Letters, 22:1061–1064.–Morison, J., M. Steele and R. Anderson, 1998. Hydrography of the upper Arctic Ocean measured from the nuclear submarine U.S.S. Pargo. Deep-Sea Research I, 45:15–38.–Rothrock, D.A., Y. Yu and G.A. Maykut, 1999. Thinning of the Arctic sea-ice cover. Geophysical Research Letters, 26(23):3469–3472.–Walsh, J.E., W.L. Chapman and T.L. Shy, 1996. Recent decreases of sea level pressure in the central Arctic. Journal of Climate, 9:480–488.
- ↑ IPCC, 2001. Climate Change 2001: The Scientific Basis. Contribution of Working Group I to the Third Assessment Report of the Intergovernmental Panel on Climate Change. J.T. Houghton, Y. Ding, D.J. Griggs, M. Noguer, P.J. van der Linden, X. Dai, K. Maskell and C.A. Johnson (eds.). Cambridge University Press, 881pp.
- ↑ IPCC, 2001. Climate Change 2001: The Scientific Basis. Contribution of Working Group I to the Third Assessment Report of the Intergovernmental Panel on Climate Change. J.T. Houghton, Y. Ding, D.J. Griggs, M. Noguer, P.J. van der Linden, X. Dai, K. Maskell and C.A. Johnson (eds.). Cambridge University Press, 881pp.
- ↑ Christensen, J.H. and O.B. Christensen, 2003. Climate modelling: severe summertime flooding in Europe. Nature, 421:805–806.
- ↑ Paeth, H., A. Hense, R. Glowienka-Hense, R.V oss and U. Cubasch, 1999. The North Atlantic Oscillation as an indicator for greenhouse-gas induced regional climate change. Climate Dynamics, 15:953–960.
- ↑ Shindell, D.T., R.L. Miller, G.A. Schmidt and L. Pandolfo, 1999. Simulation of recent northern climate trends by greenhouse-gas forcing. Nature, 399:452–455.
- ↑ Fyfe, J.C., G.J. Boer and G.M. Flato, 1999. The Arctic and Antarctic oscillations and their projected changes under global warming. Geophysical Research Letters, 26(11):1601–1604.
- ↑ Ulbrich, U. and M. Christoph, 1999. A shift of the NAO and increasing storm track activity over Europe due to anthropogenic greenhouse gas forcing. Climate Dynamics, 15:551–559.
- ↑ Shindell, D., 2003. Whither Arctic climate? Science, 299:215–216.
- ↑ Proshutinsky, A.Y. and M.A. Johnson, 1997. Two circulation regimes of the wind-driven Arctic Ocean. Journal of Geophysical Research, 102(C6):12493–12514.
- ↑ Serreze, M.C., J.A. Maslanik, T.A. Scambos, F. Fetterer, J. Stroeve, K. Knowles, C. Fowler, S. Drobot, R.G. Barry and T.M. Haran, 2003. A record minimum in Arctic sea ice extent and area in 2002. Geophysical Research Letters, 30(3), doi: 10.1029/2002GL016406.
- ↑ Rigor, I.G., J.M. Wallace and R.L. Colony, 2002. Response of sea ice to the Arctic Oscillation. Journal of Climate, 15:2648–2663.
- ↑ Parkinson, C.L., D.J. Cavalieri, P. Gloersen, H.J. Zwally and J.C. Comiso, 1999. Arctic sea ice extents, areas, and trends, 1978–1996. Journal of Geophysical Research, 104(C9):20837–20856.
- ↑ Wadhams, P., 2000. Ice in the Ocean. Gordon and Breach Science Publishers, Amsterdam, 351pp.
- ↑ McPhee, M.G. and J.H. Morison, 2001. Turbulence and diffusion: Under-ice boundary layer. In: J. Steele, S. Thorpe and K. Turekian (eds.). Encyclopedia of Ocean Sciences, pp 3071–3078. Academic Press.
- ↑ Fyfe, J.C., G.J. Boer and G.M. Flato, 1999. The Arctic and Antarctic oscillations and their projected changes under global warming. Geophysical Research Letters, 26(11):1601–1604.
- ↑ Rigor, I.G., J.M. Wallace and R.L. Colony, 2002. Response of sea ice to the Arctic Oscillation. Journal of Climate, 15:2648–2663.
- ↑ Proshutinsky, A.Y. and M.A. Johnson, 1997. Two circulation regimes of the wind-driven Arctic Ocean. Journal of Geophysical Research, 102(C6):12493–12514.
- ↑ Polyakov, I.V. and M.A. Johnson, 2000. Arctic decadal and interdecadal variability. Geophysical Research Letters, 27(24):4097–4100.
- ↑ Proshutinsky, A., R.H. Bourke and F.A. McLaughlin, 2002. The role of the Beaufort Gyre in Arctic climate variability: Seasonal to decadal climate scales. Geophysical Research Letters, 29, doi:10.1029/2002GL015847.
- ↑ McLaughlin, F.A., E.C. Carmack, R.W. Macdonald and J.K.B. Bishop, 1996. Physical and geochemical properties across the Atlantic/Pacific water mass front in the southern Canadian Basin. Journal of Geophysical Research, 101(C1):1183–1198.–Morison, J., M. Steele and R. Anderson, 1998. Hydrography of the upper Arctic Ocean measured from the nuclear submarine U.S.S. Pargo. Deep-Sea Research I, 45:15–38.
- ↑ Zhang, Y.X. and E.C. Hunke, 2001. Recent Arctic change simulated with a coupled ice-ocean model. Journal of Geophysical Research, 106(C3):4369–4390.
- ↑ Maslowski, W., B. Newton, P. Schlosser, A. Semtner and D. Martinson, 2000. Modelling recent climate variability in the Arctic Ocean. Geophysical Research Letters, 27(22):3743–3746.
- ↑ McPhee, M.G. and J.H. Morison, 2001. Turbulence and diffusion: Under-ice boundary layer. In: J. Steele, S. Thorpe and K. Turekian (eds.). Encyclopedia of Ocean Sciences, pp 3071–3078. Academic Press.
- ↑ Carmack, E.C. and D. Chapman, 2003. Wind-driven shelf/basin exchange on an Arctic shelf: The joint roles of ice cover extent and shelf-break bathymetry. Geophysical Research Letters, 30:1778, doi:10.1029/2003GL017526.
- ↑ Ganachaud, A. and C.Wunsch, 2000. Improved estimates of global ocean circulation, heat transport and mixing from hydrographic data. Nature, 408:453–457.;-- Munk,W. and C.Wunsch, 1998. Abyssal recipes II: energetics of tidal and wind mixing. Deep-Sea Research I, 45:1977–2010.;-- Rahmstorf, S. and M.H. England, 1997. Influence of southern hemisphere winds on North Atlantic Deep Water flow. Journal of Physical Oceanography, 27:2040–2054.;-- Toggweiler, J.R. and B. Samuels, 1995. Effect of Drake Passage on the global thermohaline circulation. Deep-Sea Research I, 42:477–500.
- ↑ e.g., Schmitz,W.J. Jr. and M.S. McCartney, 1993. On the North Atlantic circulation. Reviews of Geophysics, 31:29–50.
- ↑ Ganachaud and Wunsch, 2000, Op. cit.
- ↑ Broecker,W.S., S. Sutherland and T.-H. Peng, 1999. A possible 20th century slowdown of Southern Ocean deep water formation. Science, 286:1132–1135.
- ↑ IPCC, 2001. Climate Change 2001:The Scientific Basis. Contribution of Working Group I to the Third Assessment Report of the Intergovernmental Panel on Climate Change. J.T. Houghton,Y. Ding, D.J. Griggs, M. Noguer, P.J. van der Linden, X. Dai, K. Maskell and C.A. Johnson (eds.). Cambridge University Press, 881pp.
- ↑ Ibid.
- ↑ Martinson, D.G. and M. Steele, 2001. Future of the Arctic sea ice cover: implications of an Antarctic analog. Geophysical Research Letters, 20:307–310.
- ↑ Muench, R.D., M.G. McPhee, C.A. Paulson and J.H. Morison, 1992. Winter oceanographic conditions in the Fram Strait – Yermak Plateau region. Journal of Geophysical Research, 97:3469–3483.–Rudels, B., R. Meyer, E. Fahrbach, V.V. Ivanov, S. Østerhus, D. Quadfasel, U. Schauer, V. Tverberg and R.A. Woodgate, 2000. Water mass distribution in Fram Strait and over the Yermak Plateau in summer 1997. Annales Geophysicae, 18:687–705.
- ↑ Rahmstorf, S., 1999. Shifting seas in the greenhouse? Nature, 399:523–524.
- ↑ Shimada, K., E.C. Carmack, K. Hatakeyama and T. Takizawa, 2001. Varieties of shallow temperature maximum waters in the western Canadian Basin of the Arctic Ocean. Geophysical Research Letters, 28:3441–3444.
- ↑ Timokhov, L. and F.Tanis (eds.), 1998. Arctic Climatology Project, 1998. Environmental Working Group Joint U.S.-Russian Atlas of the Arctic Ocean - Summer Period. Environmental Research Institute of Michigan in association with the National Snow and Ice Data Center, Ann Arbor, Michigan. CD-ROM.;-- Shimada et al., 2001, Op. cit.
- ↑ Bourke, R.H. and R.P. Garrett, 1987. Sea ice thickness distribution in the Arctic Ocean. Cold Regions Science and Technology, 13:259–280.
- ↑ Serreze, M.C., J.A. Maslanik,T.A. Scambos, F. Fetterer, J. Stroeve, K. Knowles, C. Fowler, S. Drobot, R.G. Barry and T.M. Haran, 2003. A record minimum in Arctic sea ice extent and area in 2002.
- ↑ Furevik, T., M. Bentsen, H. Drange, I.K.T. Kindem, N.G. Kvamstø and A. Sorteberg, 2003. Description and validation of the Bergen Climate Model: ARPEGE coupled with MICOM. Climate Dynamics, 21:27–51.
- ↑ Furevik, T., H. Drange and A. Sorteberg, 2002. Anticipated changes in the Nordic Seas marine climate. Fisken og Havet, 4:1–13.
- ↑ Furevik, T., H. Drange and A. Sorteberg, 2002. Anticipated changes in the Nordic Seas marine climate. Fisken og Havet, 4:1–13.
- ↑ Melling, H., 2000. Exchanges of freshwater through the shallow straits of the North American Arctic. In: E.L. Lewis, E.P. Jones, P. Lemke, T.D. Prowse and P. Wadhams (eds.). The Freshwater Budget of the Arctic Ocean, pp. 479–502. Kluwer Academic Press.
- ↑ Melling, H., 2002. Sea ice of the northern Canadian Arctic Archipelago. Journal of Geophysical Research, 107(C11), doi: 10.1029/2001JC001102.
- ↑ Loeng, H., 2001. Klima og fisk – hva vet vi og hva tror vi. Naturen, 125(3):132–140.
- ↑ Aagaard, K. and E.C. Carmack, 1994. The Arctic Ocean and climate: a perspective. In: O.M. Johannessen, R.D. Muench and J.E. Overland (eds.). The Polar Oceans and their Role in Shaping the Global Environment. Geophysical Monograph Series, 85:5–20. American Geophysical Union.–Ganopolski, A. and S. Rahmstorf, 2001. Rapid changes of glacial climate simulated in a coupled climate model. Nature, 409:153–158.
- ↑ Rahmstorf, S., 1999. Shifting seas in the greenhouse? Nature, 399:523–524.
- ↑ Latif, M., E. Roeckner, U. Mikolajewicz and R. Voss, 2000. Tropical stabilization of the thermohaline circulation in a greenhouse warming simulation. Journal of Climate, 13:1809–1813.
- ↑ Latif, M., E. Roeckner, U. Mikolajewicz and R. Voss, 2000. Tropical stabilization of the thermohaline circulation in a greenhouse warming simulation. Journal of Climate, 13:1809–1813.
- ↑ Latif, M., 2001. Tropical Pacific/Atlantic Ocean interactions at multidecadal time scales. Geophysical Research Letters, 28(3):539–542.
- ↑ Blindheim, J., V. Borovkov, B. Hansen, S.-Aa. Malmberg, W.R. Turrell and S. Østerhus, 1999. Upper layer cooling and freshening in the Norwegian Sea in relation to atmospheric forcing. Deep-Sea Research I, 47:655–680.–Verduin, J. and D. Quadfasel, 1999. Long-term temperature and salinity trends in the central Greenland Sea. In: E. Jansen (ed.). European Subpolar Ocean Programme (ESOP) II, Final Scientific Report, A1:1–11. University of Bergen.
- ↑ IPCC, 2001. Climate Change 2001: The Scientific Basis. Contribution of Working Group I to the Third Assessment Report of the Intergovernmental Panel on Climate Change. J.T. Houghton, Y. Ding, D.J. Griggs, M. Noguer, P.J. van der Linden, X. Dai, K. Maskell and C.A. Johnson (eds.). Cambridge University Press, 881pp.
- ↑ Tziperman, E., 2000. Proximity of the present-day thermohaline circulation to an instability threshold. Journal of Physical Oceanography, 30:90–104.
- ↑ Dickson, R., I. Yashayaev, J. Meincke, B. Turrell, S. Dye and J. Holfort, 2002. Rapid freshening of the deep North Atlantic Ocean over the past four decades. Nature, 416:832–837.
- ↑ Budéus, G.,W. Schneider and G. Krause, 1998. Winter convective events and bottom water warming in the Greenland Sea. Journal of Geophysical Research - Oceans, 103:18513–18527.–Gascard, J.-C., A.J. Watson, M.-J. Messias, K.A. Olsson, T. Johannessen and K. Simonsen, 2002. Long-lived vortices as a mode of deep ventilation in the Greenland Sea. Nature, 416:525–527.–Meincke, J., B. Rudels and H.J. Friedrich, 1997.The Arctic Ocean-Nordic Seas thermohaline system. ICES Journal of Marine Science, 54:283–299.
- ↑ Hansen, B., W.R. Turrell and S. Østerhus, 2001. Decreasing overflow from the Nordic seas into the Atlantic Ocean through the Faroe Bank channel since 1950. Nature, 411:927–930.
- ↑ Østerhus, S. and T. Gammelsrød, 1999. The abyss of the Nordic Seas is warming. Journal of Climate, 12(11):3297–3304.
- ↑ Blindheim, J., V. Borovkov, B. Hansen, S.-Aa. Malmberg, W.R. Turrell and S. Østerhus, 1999. Upper layer cooling and freshening in the Norwegian Sea in relation to atmospheric forcing. Deep-Sea Research I, 47:655–680.
- ↑ Ástthórsson, Ó.S. and H. Vilhjálmsson, 2002. Iceland shelf large marine ecosystem: decadal assessment and resource sustainability. In: K. Sherman and H.R. Skjoldal (eds.). Large Marine Ecosystems of the North Atlantic, pp. 219–243. Elsevier Science.–Thordardóttir, T., 1977. Primary production in North Icelandic waters in relation to recent climate change. In: Polar Oceans. Proceedings of the Oceanographic Congress, pp. 655–665.
- ↑ Rahmstorf, S. and A. Ganopolski, 1999. Long-term global warming scenarios computed with an efficient coupled climate model. Climatic Change, 43:353–367.
- ↑ Seager, R., D.S. Battisti, J. Yin, N. Gordon, N. Naik, A.C. Clement and M.A. Cane, 2002. Is the Gulf Stream responsible for Europe's mild winters? Quarterly Journal of the Royal Meteorological Society, 128:2563–2586.
- ↑ Rahmstorf, S., 2003. Thermohaline circulation: The current climate. Nature, 421(6924):699.