Simulation of observed arctic climate with the ACIA designated models
This is Section 4.3 of the Arctic Climate Impact Assessment.
Lead Authors: Vladimir M. Kattsov, Erland Källén; Contributing Authors: Howard Cattle, Jens Christensen, Helge Drange, Inger Hanssen-Bauer,Tómas Jóhannesen, Igor Karol, Jouni Räisänen, Gunilla Svensson, Stanislav Vavulin; Consulting Authors: Deliang Chen, Igor Polyakov, Annette Rinke
Model-based scenarios of future climate are only credible if the models simulate the observed climate (present-day and past) realistically – both globally and in the region of interest. While an accurate simulation of the present-day climate does not guarantee a realistic sensitivity to an external forcing (e.g., higher GHG concentrations), a grossly biased present-day simulation may lead to weakening or elimination of key feedbacks in a simulation of change, or conversely may cause key feedbacks to be exaggerated. The ability of the models to reproduce climate states in the past – under external forcings differing from those at present – can therefore help to add to the credibility of their future climate projections.
Boer[1] distinguishes three major categories of model evaluation: the morphology of climate, including spatial distributions and structures of means, variances, and other statistics of climate variables; budgets, balances, and cycles in the climate system; and process studies of climate. A comprehensive assessment of recent AOGCM simulations of observed global climate is provided by McAvaney et al.[2], who, in particular, regarded as well-established the ability of the AOGCMs ". . .to provide credible simulations of both the annual mean climate and the climatological seasonal cycle over broad continental scales for most variables of interest for climate change." In this context, clouds and humidity were mentioned as major sources of uncertainty, in spite of incremental improvements in their modeling.
In this section, the first two categories of model evaluation[3] are addressed for the five ACIA-designated AOGCM simulations of the observed arctic climate. The primary focus is on the evaluation of representations of surface air temperature and precipitation as reproduced by the AOGCMs for the ACIA climatological baseline period (1981–2000). The evaluation of individual ACIA-designated model simulations compared to historical data is also considered.
In most cases, the area between 60° and 90° N is used as a reference region for model evaluation. In some cases, however, smaller areas are used for consistency with observational data (e.g., precipitation, see Section 4.3.1 (Simulation of observed arctic climate with the ACIA designated models)). In cases where a variable was missing from one of the five model outputs, a subset of four models was evaluated for that variable.
Contents
Observational data and reanalyses for model evaluation (4.3.1)
A considerable number of datasets are available for the Arctic, including remotely sensed and in situ data, observations from the arctic buoy program, historical data, and field experiments (see Section 2.6 (Simulation of observed arctic climate with the ACIA designated models)). However, for evaluation of three-dimensional AOGCMs, observational data readily available at regularly spaced grid points are the most useful. In situ observations are not representative of conditions covering an area the size of an average model grid box, thus a comprehensive analysis is required to match model simulations and observations.
A good opportunity for model evaluation is provided by reanalyses employing numerical weather prediction models to convert irregularly spaced observational data into complete global, gridded, and temporally homogeneous data (presently available for periods of several decades). Reanalyses include both observed (assimilated) variables (e.g., temperature, geopotential height) and derived fields (e.g., precipitation, cloudiness). For some of the derived fields, direct observations are nonexistent (e.g., evaporation). The quality of a reanalysis is not the same for different variables; it may also vary regionally for the same variable, depending on the availability of observations. In areas where observations are sparse, each reanalysis primarily represents the quality of the model’s simulation. For variables that are not observed, the reanalysis may not be realistic. Errors in a model’s physical parameterizations can also adversely affect the reanalysis. However, despite these problems, reanalyses provide the best gridded, self-consistent datasets available for model evaluation.
It is worthwhile noting that direct point-to-point and time-step-to-time-step comparison of a climate GCM output against observations, reanalyses, or another climate model simulation is not methodologically correct. Only spatial and temporal statistics can be used for the evaluation. For state-of-the-art AOGCMs, spatial averages should be at subcontinental or greater scales, such as the Arctic Ocean; the four ACIA regions (see Section 1.1 (Simulation of observed arctic climate with the ACIA designated models)) including their marine parts; or the watersheds of major rivers.
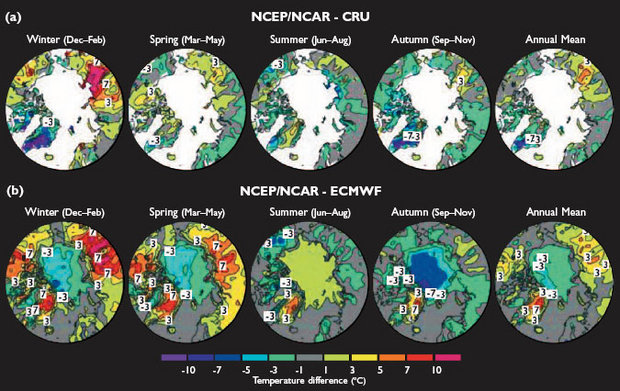
Observational data for validating AOGCM performance in the Arctic (particularly the central Arctic) are characterized by a comparatively high level of uncertainty. Because of the sparsity of direct observations, even the temperature climatology in the Arctic is imperfectly known. Model-simulated surface air temperature and atmospheric pressure have primarily been compared with the National Centers for Environmental Prediction/National Center for Atmospheric Research (NCEP/NCAR) reanalysis[4]. To estimate the accuracy of the NCEP/NCAR reanalysis, its pattern of surface air temperatures was compared against two other datasets (Fig. 4.2). The first, compiled at the Climatic Research Unit (CRU), University of East Anglia[5], is based on the interpolation of weather station observations. It is therefore expected to be accurate where the station density is sufficient, but it covers only land areas. The second dataset used for comparison is the European Centre for Medium-Range Weather Forecasts (ECMWF) reanalysis (ERA-15)[6]. Neither of the two reanalyses should be considered as "truth" but their differences provide some information about the probable magnitude of errors in them. The ECMWF reanalysis is only available for the period since 1979; the difference between the ECMWF and NCEP/NCAR reanalyses shown in Fig. 4.2 was calculated for the overlapping interval (1979–1993).
The differences between the NCEP/NCAR reanalysis and the CRU dataset for the period 1961 to 1990 are smallest in summer (generally within ±1°C, and almost everywhere within ±3°C) and largest in winter. In winter, temperatures in the NCEP/NCAR reanalysis are higher than in the CRU dataset over most of northern Siberia and North America, but lower over the northeastern Canadian Archipelago and Greenland. Locally, the differences are as great as 15°C in northern Siberia (NCEP/NCAR warmer than CRU) and Greenland (NCEP/NCAR colder than CRU). Despite these very large regional differences, the NCEP/NCAR and CRU mean temperatures over the entire arctic land area are in all seasons within 2°C of each other.
The differences between the NCEP/NCAR and ECMWF reanalyses over land follow the NCEP/NCAR minus CRU differences in most, but not all, respects. Substantial differences also occur between the ECMWF reanalysis and the CRU dataset, most notably in spring when the ECMWF temperatures show a widespread cold bias compared to the CRU dataset. Over the central Arctic Ocean, temperatures in the NCEP/NCAR reanalysis are lower than temperatures in the ECMWF reanalysis throughout most of the year, with the greatest differences (up to 5–7°C) in autumn. In summer, however, NCEP/NCAR temperatures are slightly higher than ECMWF temperatures.
The quality of precipitation climatologies for high latitudes derived from reanalyses is lower than that for temperature (or, e.g., atmospheric pressure). On the other hand, assessments of simulated precipitation at high latitudes are confounded by the uncertainties in observational estimates, which suffer from errors in gauge measurements of solid precipitation, especially when the solid precipitation occurs under windy conditions. Depending on the partitioning between falling snow (precipitation) and wind-blown snow from the surface, the error can range from a significant "undercatch" to a significant "overcatch". Because different observational climatologies incorporate varying types and degrees of adjustment, there is some variance among the observational estimates, more so in the monthly means than in the annual mean. The primary observational dataset used here is an outgrowth of an arctic climatology originally compiled by Bryazgin[7], whose monthly mean fields were extended for inclusion in Khrol[8], and subsequently updated and enhanced by additional corrections. This compilation includes data from the Russian drifting ice stations and high-latitude land-surface stations, and it is gridded over the 65° to 90° N domain. Additional precipitation climatologies used in this assessment are Legates and Willmott[9] and Xie and Arkin[10]. Both the Bryazgin and Legates-Willmott climatologies are based on gauge-corrected in situ data only. The two climatologies are multi-year averages over periods that do not coincide with each other or with the ACIA climatological baseline (see Section 4.3.2 (Simulation of observed arctic climate with the ACIA designated models)). The Xie and Arkin climatology is a blend of in situ and satellite data, and reanalysis where in situ and satellite data are not available. It differs significantly from the other two not only in spatial distributions, but also in areal averages. The Xie and Arkin dataset provides monthly means for individual years over a period that includes the ACIA baseline.
Specifying the ACIA climatological baseline (4.3.2)
A climatological baseline is a period of years representing the current climate in terms of the mean and variability over the period. To satisfy widely adopted IPCC[11] criteria, a baseline period should:
- be representative of the present-day or recent average climate in the region considered;
- be of sufficient duration to encompass a range of climatic variations;
- cover a period for which data on all major climatological variables are abundant, adequately distributed in space,and readily available;
- include data of sufficiently high quality for use in evaluating impacts; and should
- be consistent or readily comparable with baseline climatologies used in other impact assessments.
Until recently, the most widely used baseline period has been the "classical" 30-year period defined by the World Meteorological Organization (WMO). Usually the period 1961 to 1990 is used (as was the case for the first three IPCC Assessment Reports). In some cases, an earlier period (1951–1980) was used. It is expected that the IPCC Fourth Assessment Report will use the climatological baseline 1971–2000[12].
The 20-year period 1981–2000 was selected as the ACIA climatological baseline. While shorter than the 30-year WMO standard, the ACIA baseline is linked to the period of high-quality (satellite) observations of sea-ice extent and concentration (important climatological variables for the Arctic), which have been available only since the late 1970s[13] (see also Section 6.3 (Simulation of observed arctic climate with the ACIA designated models)). The precise coincidence of the baseline duration with the ACIA future time slices (also 20 years, see Section 1.4.2 (Simulation of observed arctic climate with the ACIA designated models)) is also methodologically consistent. Another technical reason for selecting the 1981–2000 baseline period, rather than 1971–2000, was the availability of the former (but not the latter) in the outputs of all five B2 simulations stored in the ACIA archive.
A serious concern is that the ACIA baseline duration is insufficient to reflect natural climatic variability on a multi-decadal timescale. Indeed, the ACIA climatological baseline includes at least ten of the warmest years globally since the mid-19th century when the instrumental record began[14]. However, considering the large interdecadal variability of arctic climate during the entire period of the instrumental record[15], any particular 30-year (or even longer) period of the 20th century could exhibit a similar limitation.
Following the recommendations of the IPCC Task Group on Scenarios for Climate and Impact Assessment, the ACIA climatological baseline (1981–2000) was compared with the standard 1961–1990 baseline, using surface air temperature and precipitation data from the NCEP/NCAR reanalysis[16]. Table 4.2 provides seasonal and annual multiyear means of the atmospheric variables for the two baseline periods.
The differences in the global means between the two baseline periods are systematic, but small. Globally, the ACIA baseline period is warmer by 0.1 to 0.2°C in all seasons. The differences in global precipitation are negligible. For the polar region (60°–90° N), the differences between the two baselines are larger. The difference in the surface air temperature is at a maximum in winter (0.6°C) and is smallest in summer (0.2°C). The ACIA baseline annual mean precipitation is the same as the 1961–1990 mean.
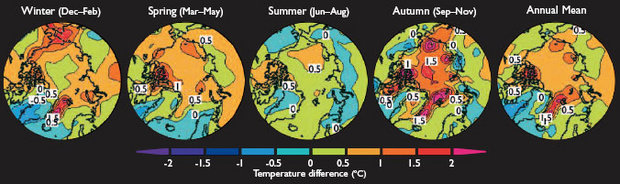
Geographically, the differences between the two baseline periods in the NCEP/NCAR reanalysis are more pronounced (Fig. 4.3). The Arctic is generally warmer during the ACIA baseline period, especially in autumn. The strongest warming is evidently associated with the marginal sea-ice zone, particularly along the east coast of Greenland. Mean sea-level pressure (SLP) is generally lower (by up to about 1.5 hPa) over the central Arctic and northern North Atlantic in the ACIA baseline period compared to the 1961–1990 baseline period.
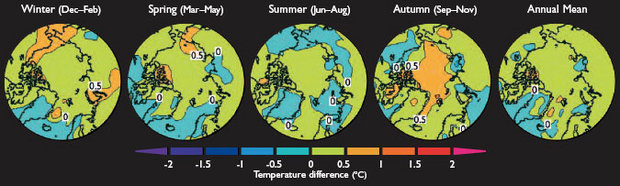
Because 1961–1990 is expected to be superseded in the near future by 1971–2000 as the new standard 30-year averaging period, it is worth comparing the ACIA climatological baseline against the latter. Figure 4.4 shows the spatial distributions of seasonal and annual differences in surface air temperature between the 1981–2000 and 1971–2000 periods.
In summary, for surface air temperature, precipitation, and atmospheric pressure, the ACIA baseline period has systematic but generally small differences in comparison with the World Meteorological OrganizationWMO standard baseline (1961–1990). The differences can easily be taken into account when a comparison between climate change scenarios employing the different baselines is required. An advantage of the ACIA climatological baseline period is that it is more "current" than the 1961–1990 period. The duration of the ACIA baseline period is exactly the same as that adopted for the ACIA future time slices. There are only minor geographical differences in seasonal temperature means between the ACIA baseline and the new standard baseline (1971–2000). While the ACIA climatological baseline period (1981–2000) satisfies the IPCC[17] selection criteria, its relative shortness (compared to the standard 30-year period) may not provide an adequate representation of the probability of extreme events.
Surface air temperature (4.3.3)
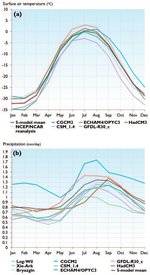
The seasonal cycle of the simulated and analyzed air temperatures at the 2 m height (1.5 m height for HadCM3) for the period 1981 to 2000 is illustrated in Fig. 4.5a, which shows means for the entire area north of 65° N. While there are differences between the five-model mean and the NCEP/NCAR reanalysis, these are relatively small compared with the range of model results. In particular, the area mean temperatures during the greater part of the year differ by about 5°C between the models simulating the highest and lowest temperatures, and local differences are even larger. In late winter (February–March), all the models simulate slightly lower temperatures than those in the NCEP/ NCAR reanalysis. It should be noted that the 1.5 and 2 m temperatures in the models are not prognostic variables – they are derived from the prognostic temperatures at the lowest model level (typically a few tens of meters) using the models’ ABL parameterizations; as a result, the biases may be partly due to the diagnostic schemes. In addition, surface elevation differences between the models and the reanalysis, as a result of differences in spatial resolution, could be contributing to the apparent biases.
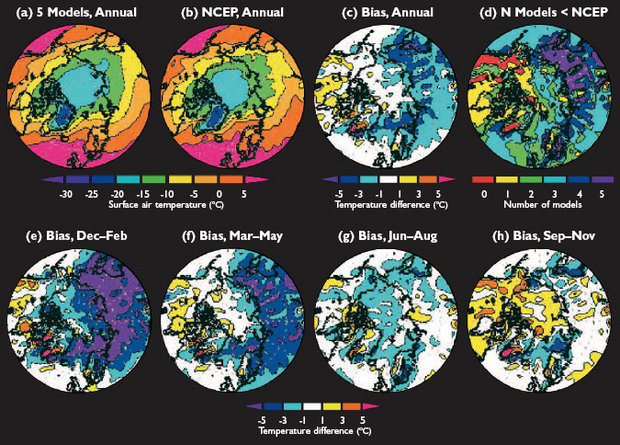
The large-scale spatial distribution of annual mean temperature in the Arctic is, on average, reasonably well reproduced by the ACIA-designated models. The simulations tend to be slightly colder than the NCEP/NCAR reanalysis in northern Eurasia and somewhat warmer over the western Arctic Ocean and northern North America (Fig. 4.6). A sharp local maximum in the five-model bias (Fig. 4.6c) in southern probably reflects the relatively smooth model topographies. However, the biases vary substantially between the individual models. Figure 4.6d shows the number of the five models that simulate lower mean annual temperatures than those in the NCEP/NCAR reanalysis. There are a few areas in the western Arctic where all five models simulate higher mean annual temperatures than those in the NCEP reanalysis and a few areas in the eastern Arctic where all five models simulate lower mean annual temperatures. The seasonal distribution of the biases in the five-model mean temperature is shown in Fig. 4.6e-h. The cold bias in northern Eurasia is most pronounced in winter and spring, whereas the warm bias in northern North America persists for most of the year and is largest in autumn. The simulated temperatures in the central Arctic Ocean tend to exceed the NCEP/NCAR reanalysis estimate in spring and especially in autumn. The five-model mean simulated summer temperatures in the central Arctic are lower than in the NCEP/NCAR reanalysis and the model-to-model variation is relatively small.
The ability of [[AOGCM]s] to provide credible projections of future climates is strongly supported by their ability to simulate the evolution of the climate during past centuries. One of the five-member ensemble 20th century simulations with the GFDL-R30_c model driven by historical changes in GHG and sulfate aerosol concentrations demonstrated an impressive resemblance to the observed warming that occurred in two distinct periods in the first and second halves of the 20th century with a pronounced maximum in the Arctic[19]. The early 20th-century warming was not obtained in the other simulations of the GFDLR30_ c ensemble, which highlights the role of internal variability in the climate evolution, and therefore proves the necessity of ensemble simulations, rather than single runs, in order to better delineate the associated uncertainties. In the HadCM3 model, a good fit to 20th century observations was only obtained when natural (varying) forcing from solar and volcanic activity was also included[20].
Precipitation (4.3.4)
More so than with temperature, there are major systematic differences between precipitation in the ACIA 1981–2000 simulations and in observational datasets. The five-model mean seasonal cycle of precipitation in the area 65° to 90° N is in qualitative agreement with the climatologies (Fig. 4.5b). While the range between the individual simulations is substantial throughout the year, it is noteworthy that the observational climatologies demonstrate a comparable scatter, at least in summer and autumn.
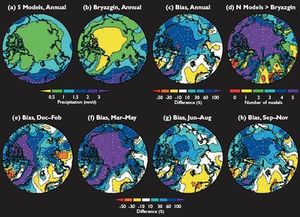
As shown in Fig. 4.7a-d, the average simulated annual precipitation generally exceeds the Bryazgin estimate[22] and other observational estimates in most of the Arctic; in some areas by a factor of two. The reverse is true, however, in the northeastern North Atlantic and parts of northwestern Eurasia, probably because simulated cyclone activity in this area tends to be too weak (see Section 4.3.5 (Simulation of observed arctic climate with the ACIA designated models)). The same geographical pattern of biases persists throughout the year, although the magnitude of these biases varies with season. The positive biases relative to the Bryazgin climatology are generally greatest in spring and smallest in summer (Fig. 4.7e-h).
The differences between the simulated precipitation and the observational estimates may be partly due to measurement errors that lead to underestimation of the actual precipitation, particularly when it falls in solid form. However, this clearly cannot explain all the differences in the spatial and seasonal distributions of precipitation. For example, the difference between the five-model area mean and the observational estimates is substantially larger in spring than in winter, in contrast to what might be expected from measurement errors alone.
The ability of AOGCMs (including three of the ACIA-designated models: HadCM3, ECHAM4/OPYC3, and CGCM2) to reproduce the 20th century increase in arctic precipitation has been demonstrated[23]. In all of the ACIA-designated model simulations, positive linear trends in 20th century arctic precipitation agree with available observational estimates (see Section 2.6.2.2 (Simulation of observed arctic climate with the ACIA designated models)).
Further details on the evaluation of the five ACIA-designated models with respect to simulation of precipitation and other components of arctic hydrology and climatology can be found in Chapter 6 (Simulation of observed arctic climate with the ACIA designated models).
Other climatic variables (4.3.5)
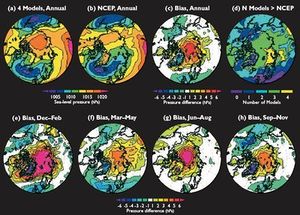
The distribution of the 1981–2000 mean SLP is qualitatively similar between the mean of four of the ACIA-designated models (for GFDL-R30_c, only surface pressure fields were available) and the NCEP/NCAR reanalysis, but there are important differences in details (Fig. 4.8). Surface pressure is the prognostic variable in GCMs, while SLP is diagnosed using different reduction schemes. Some of the variations in SLP between the different models, and between the models and the reanalysis, may be due to the use of different SLP reduction schemes.
The models simulate the main lobes of the annual mean Icelandic and Aleutian lows quite well, but the simulated extension of the Icelandic low towards the Barents Sea is too weak. The positive pressure bias over the eastern Arctic Ocean and the negative bias in western Eurasia (Fig. 4.8c) suggest that the path of cyclone activity is too far south in the simulations. There also tends to be a slight negative pressure bias in the western Canadian Arctic, which suggests that the simulated cyclone activity is too strong in that region. Winter pressure biases make the greatest contribution to the four-model annual mean pressure biases. However, the positive bias over the eastern Arctic Ocean persists throughout the year. As with temperature and precipitation, the pressure biases also vary between the individual models. The shift of the arctic air mass relative to observations is a well-known feature of both AOGCMs and stand-alone AGCMs (e.g., AMIP). The pressure biases contribute to significant differences in wind forcing of sea ice between the AOGCM simulations and the real world, and lead to distortions in simulated spatial distributions of sea ice[25].
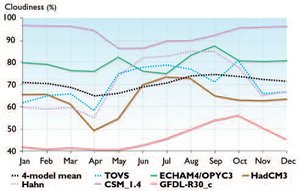
Cloudiness and the radiative properties of clouds, particularly in the Arctic, remain a major challenge to simulate. Figure 4.9 shows the dramatic scatter between the total cloud amounts simulated by four of the ACIA-designated models (the results from CGCM2 were not available) over the Arctic Ocean between 70° and 90° N. Two observational estimates, one based primarily on Television and Infrared Observation Satellite Operational Vertical Sounder (TOVS) data[26] and the other obtained primarily from surface-based observations[27], diverge substantially in late summer and early autumn, but give an idea of the seasonality of arctic cloud cover. While the intermodel scatter is quite large (e.g., the difference between the highest (CSM_1.4) and lowest (GFDLR30_ c) simulations approaches 60% in winter), the four-model mean underestimates cloudiness in the warm season and overestimates it in winter. Of the four ACIA-designated models, only the HadCM3 simulation shows some qualitative agreement with the observed seasonality of arctic cloud cover.
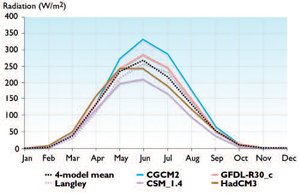
Surface radiative fluxes also vary widely between the models. Figure 4.10 shows the seasonal variation in incident solar radiation as simulated by four of the ACIA-designated models (ECHAM4/OPYC3 data were not available) for the Arctic Ocean between 70° and 90° N and the lone observational estimate obtained from the Langley Atmospheric Sciences Data Center. The four-model mean seasonal cycle is close to the observed one. In summer, however, the difference between the highest and lowest simulated values (CGCM2 and CSM_1.4, respectively) reaches a maximum of up to 125 W/m2.
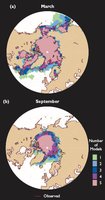
The large inter-model scatter in the ACIA-designated model simulations of baseline (1981–2000) sea-ice and terrestrial snow-cover distributions reflects problems in modeling the cryosphere as discussed in Sections 4.2.5 and 4.2.6 (Simulation of observed arctic climate with the ACIA designated models). Figure 4.11 presents an integrated picture of sea-ice distributions in the Northern Hemisphere as simulated by the five ACIA-designated models for March (maximum observed sea-ice extent) and September (minimum extent). The distribution is represented by the number of models simulating sea ice in each of the 2.5° x 2.5° grid cells. For each model, sea ice is defined as present in a grid cell if its quantity exceeds one of the ad hoc critical values (depending on what variable is available from the model output): 5 cm thickness, 45 kg/m2 mass, or 10% areal coverage. For the greater part of the Arctic Ocean, all five models simulate sea ice in both March and September; however, major differences between the models occur along the margins of the ice cover. A detailed evaluation of the five ACIA-designated models with respect to simulation of the baseline sea-ice and terrestrial snow-cover distributions in the Northern Hemisphere is provided in Sections 6.3.3 and 6.4.3 (Simulation of observed arctic climate with the ACIA designated models).
Summary (4.3.6)
A key characteristic of the simulations of the arctic climate from the ACIA-designated models is their large inter-model scatter. Biases in surface air temperature and SLP spatial distributions and simulation of excessive arctic precipitation are among the most important systematic errors. Significant uncertainty is introduced by the simulated cloudiness – one of the key variables in climate system feedbacks (this is also a problem in the current generation of AOGCMs outside of the Arctic). The large inter-model scatter in reproducing sea-ice and terrestrial snow-cover extent limits the credibility of future climate projections obtained with the models. Conversely, compared to the five individual simulations, the five-model ensemble means show reasonable agreement with available observations, at least for the area averages. The evaluation of the ability of the ACIA-designated AOGCM ensemble to simulate observed climate conditions supports use of the ensemble for constructing 21st-century climate change scenarios for the Arctic. This suitability is further supported by the ability of some of the ACIA-designated models, when driven by estimates of historical radiative forcing, to satisfactorily emulate the observed evolution of arctic surface air temperature and precipitation throughout the 20th century, which enhances the credibility of future arctic climate change projected by these models.
As a consequence of the biases and inter-model scatter inAOGCM simulations of the present-day arctic climate, the ACIA has chosen to append (add or subtract) the simulated changes to observed baseline climates as was done, for example, by the National Assessment Synthesis Team[29] rather than to use the model-simulated climates directly in impact studies. The [[climate change]s] should be expressed either as absolute differences (e.g., temperature), or as ratios (e.g., precipitation).
Chapter 4: Future Climate Change: Modeling and Scenarios for the Arctic
4.1. Introduction (Simulation of observed arctic climate with the ACIA designated models)
4.2. Global coupled atmosphere-ocean general circulation models
4.3. Simulation of observed arctic climate with the ACIA designated models
4.4. Arctic climate change scenarios for the 21st century projected by the ACIA-designated models
4.5. Regional modeling of the Arctic
4.6. Statistical downscaling approach and downscaling of AOGCM climate change projections
4.7. Outlook for improving climate change projections for the Arctic
References
Citation
Committee, I. (2012). Simulation of observed arctic climate with the ACIA designated models. Retrieved from http://editors.eol.org/eoearth/wiki/Simulation_of_observed_arctic_climate_with_the_ACIA_designated_models- ↑ Boer, G.J., 2000a. Analysis and verification of model climate. In: P. Mote and A. O'Neill (eds.). Numerical Modeling of the Global Atmosphere in the Climate System. NATO Science Series C-550. Kluwer Academic Publishers.
- ↑ McAvaney, B.J., C. Covey, S. Joussaume, V. Kattsov, A. Kitoh, W. Ogana, A.J. Pitman, A.J. Weaver, R.A. Wood and Z.-C. Zhao, 2001. Model evaluation. In: J.T. Houghton, Y. Ding, D.J. Griggs, M. Noguer, P.J. van der Linden, X. Dai, K. Maskell and C.A. Johnson (eds.). pp. 471–524. Climate Change 2001: The Scientific Basis. Contribution of Working Group I to the Third Assessment Report of the Intergovernmental Panel on Climate Change. Cambridge University Press.
- ↑ Boer, G.J., 2000a. Analysis and verification of model climate. In: P. Mote and A. O'Neill (eds.). Numerical Modeling of the Global Atmosphere in the Climate System. NATO Science Series C-550. Kluwer Academic Publishers.
- ↑ Kistler, R., E. Kalnay, W. Collins, S. Saha, G. White, J. Woollen, M. Chelliah, W. Ebisuzaki, M. Kanamitsu, V. Kousky, H. van den Dool, R. Jenne and M. Fiorino, 2001. The NCEP-NCAR 50-year reanalysis: Monthly means CD-ROM and documentation. Bulletin of the American Meteorological Society, 82:247–268.
- ↑ New, M., M. Hulme and P. Jones, 1999. Representing twentieth-century space-time climate variability. Part I: Development of a 1961–90 mean monthly terrestrial climatology. Journal of Climate, 12:829–856.–New, M., M. Hulme and P. Jones, 2000. Representing twentieth-century space-time climate variability. Part II: Development of 1901–96 monthly grids of terrestrial surface climate. Journal of Climate, 13:2217–2238.
- ↑ Gibson, J.K., P. Kållberg, S. Uppala, A. Hernandez, A. Nomura and E. Serrano, 1997. ERA description. ECMWF Reanalysis Project Rep. Series 1. European Centre for Medium Range Weather Forecasts, Reading, UK, 66pp.
- ↑ Bryazgin, N.N., 1976. Yearly mean precipitation in the Arctic region accounting for measurement errors. Proceedings of the Arctic and Antarctic Research Institute, 323:40–74. (In Russian)
- ↑ Khrol, V.P. (ed.), 1996. Atlas of Water Balance of the Northern Polar Area. Gidrometeoizdat, St. Petersburg, 81pp.
- ↑ Legates, D.R. and C.L. Willmott, 1990. Mean seasonal and spatial variability in gauge-corrected global precipitation. International Journal of Climatology, 10:111–133.
- ↑ Xie, P. and P.A. Arkin, 1998. Global monthly precipitation estimates from satellite-observed outgoing longwave radiation. Journal of Climate, 11:137–164.
- ↑ IPCC, 1994. IPCC Technical Guidelines for Assessing Climate Change Impacts and Adaptations. Prepared by Working Group II. T.R. Carter, M.L. Parry, H. Harasawa and S. Nishioka (eds.). WMO/UNEP, CGER-IO15-94. Intergovernmental Panel on Climate Change, 59pp.
- ↑ IPCC-TGCIA, 1999. Guidelines on the Use of Scenario Data for Climate Impact and Adaptation Assessment. Version 1. Prepared by T.R. Carter, M. Hulme and M. Lal. Intergovernmental Panel on Climate Change, Task Group on Scenarios for Climate and Impact Assessment, 69pp.
- ↑ IPCC, 2001. Climate Change 2001: The Scientific Basis. Contribution of Working Group I to the Third Assessment Report of the Intergovernmental Panel on Climate Change. J.T. Houghton, Y. Ding, D.J. Griggs, M. Noguer, P.J. van der Linden, X. Dai, K. Maskell and C.A. Johnson (eds.). Intergovernmental Panel on Climate Change. Cambridge University Press, 881pp.
- ↑ IPCC-TGCIA, 1999. Guidelines on the Use of Scenario Data for Climate Impact and Adaptation Assessment. Version 1. Prepared by T.R. Carter, M. Hulme and M. Lal. Intergovernmental Panel on Climate Change, Task Group on Scenarios for Climate and Impact Assessment, 69pp.
- ↑ Bengtsson, L., V.A. Semenov and O. Johannessen, 2003. The Early Century Warming in the Arctic – A Possible Mechanism. Rep. 345. Max Planck Institute for Meteorology, Hamburg, Germany, 31pp.–Polyakov, I. and M. Johnson, 2000. Arctic decadal and interdecadal variability. Geophysical Research Letters, 24:4097–4100.–Polyakov, I., S.-I. Akasofu, U. Bhatt, R. Colony, M. Ikeda, A. Makshtas, C. Swingley, D. Walsh and J. Walsh, 2002a. Trends and variations in Arctic climate system. Eos, Transactions, American Geophysical Union, 83(47):547–548.–Polyakov, I., G. Alekseev, R. Bekryaev, U. Bhatt, R. Colony, M. Johnson, V. Karklin, A. Makshtas, D.Walsh and A. Yulin, 2002b. Observationally based assessment of polar amplification of global warming. Geophysical Research Letters, 29(18):1878–1881.
- ↑ Kistler, R., E. Kalnay, W. Collins, S. Saha, G. White, J. Woollen, M. Chelliah, W. Ebisuzaki, M. Kanamitsu, V. Kousky, H. van den Dool, R. Jenne and M. Fiorino, 2001. The NCEP-NCAR 50-year reanalysis: Monthly means CD-ROM and documentation. Bulletin of the American Meteorological Society, 82:247–268.
- ↑ IPCC, 1994. IPCC Technical Guidelines for Assessing Climate Change Impacts and Adaptations. Prepared by Working Group II. T.R. Carter, M.L. Parry, H. Harasawa and S. Nishioka (eds.). WMO/UNEP, CGER-IO15-94. Intergovernmental Panel on Climate Change, 59pp.
- ↑ Khrol, V.P. (ed.), 1996. Atlas of Water Balance of the Northern Polar Area. Gidrometeoizdat, St. Petersburg, 81pp.–Legates, D.R. and C.L. Willmott, 1990. Mean seasonal and spatial variability in gauge-corrected global precipitation. International Journal of Climatology, 10:111–133.–Xie, P. and P.A. Arkin, 1998. Global monthly precipitation estimates from satellite-observed outgoing longwave radiation. Journal of Climate, 11:137–164.
- ↑ Delworth, T.L. and T.R. Knutson, 2000. Simulation of early 20th century global warming. Science, 287:2246–2250.
- ↑ Stott, P., 2003: Attribution of regional-scale temperature changes to anthropogenic and natural causes. Geophysical Research Letters, 30(14): 1728, doi:10.1029/2003GL017324.–Stott, P.A., S.F.B. Tett, G.S. Jones, M.R. Allen, J.F.B. Mitchell and G.J. Jenkins, 2000. External control of twentieth century temperature variations by natural and anthropogenic forcings. Science, 15:2133–2137.–Tett, S.F.B., G.S. Jones, P.A. Stott, D.C. Hill, J.F.B. Mitchell, M.A. Allen, W.J. Ingram, T.C. Johns, C.E. Johnson, A. Jones, D.L. Roberts, D.M.H. Sexton and M.J. Woodage, 2000. Estimation of Natural and Anthropogenic Contributions to 20th Century. Hadley Centre Tech Note 19. Hadley Centre for Climate Prediction and Response, UK, 52pp.–IPCC, 2001. Climate Change 2001: The Scientific Basis. Contribution of Working Group I to the Third Assessment Report of the Intergovernmental Panel on Climate Change. J.T. Houghton, Y. Ding, D.J. Griggs, M. Noguer, P.J. van der Linden, X. Dai, K. Maskell and C.A. Johnson (eds.). Intergovernmental Panel on Climate Change. Cambridge University Press, 881pp.
- ↑ Khrol, V.P. (ed.), 1996. Atlas of Water Balance of the Northern Polar Area. Gidrometeoizdat, St. Petersburg, 81pp.
- ↑ Bryazgin, N.N., 1976. Yearly mean precipitation in the Arctic region accounting for measurement errors. Proceedings of the Arctic and Antarctic Research Institute, 323:40–74. (In Russian)–Khrol, V.P. (ed.), 1996. Atlas of Water Balance of the Northern Polar Area. Gidrometeoizdat, St. Petersburg, 81pp.
- ↑ Kattsov, V.M. and J.E. Walsh, 2002. Reply to comments on "Twentieth-century trends of Arctic precipitation from observational data and a climate model simulation" by H. Paeth, A. Hense, and R. Hagenbrock. Journal of Climate, 15:804–805.
- ↑ Hahn, C.J., S.G. Warren and J. London, 1995. The effect of moonlight on observations of cloud cover at night, and applications to cloud climatology. Journal of Climate, 8:1429–1466.
- ↑ Bitz, C., G. Flato and J. Fyfe, 2002. Sea ice response to wind forcing from AMIP models. Journal of Climate, 15:523–535.–Walsh, J.E., in press. Summary of a workshop on modeling the Arctic atmosphere, Madison, Wisconsin, 20–22 May 2002. Bulletin of the American Meteorological Society.–Walsh, J.E., V. Kattsov, W. Chapman, V. Govorkova and T. Pavlova, 2002. Comparison of Arctic climate simulations by uncoupled and coupled global models. Journal of Climate, 15:1429–1446.
- ↑ Schweiger, A.J., R.W. Lindsay, J.R. Key and J.A. Francis, 1999. Arctic clouds in multiyear satellite data sets. Geophysical Research Letters, 26:1845–1848.
- ↑ Hahn, C.J., S.G. Warren and J. London, 1995. The effect of moonlight on observations of cloud cover at night, and applications to cloud climatology. Journal of Climate, 8:1429–1466.
- ↑ Meleshko, V.P., V.M. Kattsov, V.A. Govorkova, S.P. Malevsky-Malevich, E.D. Nadyozhina and P.V. Sporyshev, 2004. Anthropogenic climate changes in the 21st century in Northern Eurasia. Russian Meteorology and Hydrology, 7:5–26.
- ↑ NAST, 2001. Climate Change Impacts on the United States: The Potential Consequences of Climate Variability and Change. National Assessment Synthesis Team, Report for the US Global Change Research Program. Cambridge University Press, 620pp.