Sea-level rise and coastal stability in the Arctic
This is Section 6.9 of the Arctic Climate Impact Assessment.
Lead Author: John E.Walsh; Contributing Authors: Oleg Anisimov, Jon Ove M. Hagen,Thor Jakobsson, Johannes Oerlemans,Terry D. Prowse,Vladimir Romanovsky, Nina Savelieva,Mark Serreze, Alex Shiklomanov, Igor Shiklomanov, Steven Solomon; Consulting Authors: Anthony Arendt, David Atkinson, Michael N. Demuth, Julian Dowdeswell, Mark Dyurgerov, Andrey Glazovsky, Roy M. Koerner, Mark Meier, Niels Reeh, Oddur Sigur0sson, Konrad Steffen, Martin Truffer
Contents
Background (6.9.1)
Sea-level rise is one of the most important consequences of climate change and has the potential to cause significant impacts on ecosystems and societies. Changes in sea level will directly affect coastal stability. While Section 6.5 (Sea-level rise and coastal stability in the Arctic) discussed glacier wastage as a contributor to sea-level change, the present section addresses sea-level change in a broader context. The consequences for arctic coastal stability serve as the motivation and target of the present discussion of sea level and its variations. Sea level is discussed further in section 2.5.2 (Sea-level rise and coastal stability in the Arctic) and 16.2.4 (Sea-level rise and coastal stability in the Arctic).
Vulnerability to sea-level change varies substantially among arctic coastal regions. Figure 6.38 shows the areas of the Arctic that are presently less than ten meters above mean sea level. Substantial portions of the coasts of Siberia, Alaska, and Canada are low-lying and hence vulnerable to sea-level rise, although the rate of isostatic rebound in eastern Canada is substantial, as discussed below.
"Mean sea level" at the coast is defined as the height of the sea with respect to a local land benchmark, averaged over a long enough period (e.g., a month or a year) that fluctuations caused by waves and tides are largely removed. Changes in mean sea level measured by coastal tide gauges are called "relative sea-level changes", because they can be caused by movement of the land on which the tide gauge is situated or by climate-driven oceanic changes affecting the height of the adjacent sea surface. These two causes of relative sea-level change can have similar rates (several millimeters per year) over decadal or longer timescales. In addition, sea level is affected by changes in the spatial distribution of the water in the ocean resulting from atmosphere–ocean processes, for example, atmospheric (hydrostatic) pressure and storm winds, tides, and changes in the ocean circulation (currents). To infer sea-level changes arising from changes in the atmosphere or the ocean, the movement of the land must be subtracted from the records of tide gauges and geological indicators of past sea level. Because the processes contributing to sea-level change all have significant spatial variability, there will be considerable geographic variability in changes in the rate of relative sea-level rise.
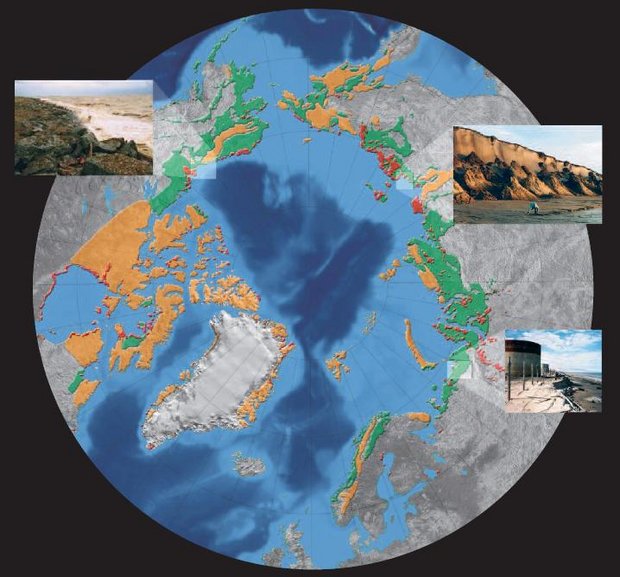 Fig. 6.38. Vulnerability of arctic coasts to sea-level rise and erosion, showing land areas of the Arctic with elevations less than 10 m above mean sea level (red), regions with unlithified coasts (green), and regions with lithified coasts (brown)[1]. Examples of unstable coastal environments are shown in the insets from the Pechora (photo: S. Ogorodov, courtesy of the Arctic Coastal Dynamics website), Laptev (photo: M. Grigoriev, courtesy of the Arctic Coastal Dynamics website), and Beaufort (photo: S. Solomon, Geological Survey of Canada) Sea coasts.
 Vertical motions of the land surface (isostatic changes) (6.9.1.1)
Widespread land movements are caused by glacioisostatic adjustment (a slow response to the melting of large ice sheets), and by tectonic land movements that include rapid displacements (earthquakes) and slow movements (associated with mantle convection and sediment transport). Glacio-isostatic adjustment and tectonic movements both vary widely in space. Therefore, sea-level change is not expected to be geographically uniform, and information about its distribution is needed to inform assessments of the impacts on coastal regions.
Glacio-isostatic adjustment is a response of the earth to loading and unloading by [[glacier]s] during the last major glaciation and the subsequent deglaciation. Regions that hosted thick accumulations of ice experienced subsidence followed by rebound when the ice retreated. Other parts of the earth experienced both subsidence and uplift or subsidence alone. Because the response of the earth’s crust (Structure of the Earth) and mantle is slow, recovery from this loading and unloading is still occurring[2]. Glacio-isostatic adjustment varies considerably around the Arctic, from uplift in the Canadian Archipelago, Greenland, and Norway to subsidence along the Beaufort Sea and Siberian coasts. Tectonic motion is caused by movements of the crustal plates that result in rapid changes (earthquakes) or slow, gentle uplift or subsidence. Local loading of the crust by sediment (e.g., in deltas) can also cause subsidence.
Climate-driven oceanic changes affecting the height of the sea surface (6.9.1.2)
In the absence of vertical motions of the land surface, there are two main components of sea-level rise:
- "steric rise", which refers to processes that cause an increase in ocean volume without a change in mass, primarily through changes in temperature (thermal expansion) and salinity (freshening); and
- "eustatic rise", which refers (at least in the oceanographic community) to changes resulting from an increase in the mass of water. Increased runoff from terrestrial regions, including [[glacier]s] and ice sheets, contributes directly to eustatic rise.
Changes in the amount of water stored on land will alter the mass of the ocean. (Sea level will be unaffected by the melting of sea ice, which displaces the volume of ocean water equivalent to its mass.) Climate change is projected to reduce the amount of water frozen in glaciers and ice caps owing to increased melting and evaporation (Section 6.5.3 (Sea-level rise and coastal stability in the Arctic)). Greater melting of, and evaporation from, the Greenland and Antarctic ice sheets are also projected, but might be offset by increased precipitation, especially over Antarctica. Recent laser altimetry work by the National Aeronautics and Space Administration (NASA) shows that increased precipitation over Greenland does not presently balance the increased melting at lower elevations[3]. Increased discharge of ice from the ice sheets into the ocean is also possible. The ice sheets respond to climate change over timescales of up to millennia, so they could still be gaining or losing mass in response to climate variations that occurred as far back as the last glacial period, and they will continue to change for thousands of years after climate stabilizes. In addition to changes in glaciers and ice sheets, groundwater extraction and impounding of water in reservoirs can affect sea level.
Variations in sea level arising from atmosphere–ocean processes (including sea ice) (6.9.1.3)
A variety of atmosphere–ocean processes contribute to spatial and temporal variations in sea level. The frequency, direction, magnitude, and duration of winds are the important variables which, when combined with water depth and coastal morphology, determine wave and storm-surge forcing at the coast. Storm surges form in response to lowered atmospheric pressure in cyclonic weather systems and accumulation of water in shallow coastal areas due to wind stress. Storm surges can cause increases in water level many times greater than the normal tidal range. Associated waves can directly impact coastal bluffs, resulting in rapid coastal retreat.
Changes in meteorological forcing over time can be identified using data from the terrestrial and ice-island weather observation networks that have been active in the circumpolar coastal and ocean region since the 1940s. Of the parameters observed at a weather station, winds represent the single most important forcing agent for the coastal regime, driving waves and surges and affecting sea-ice formation and presence. It is important to consider the distributions of wind speeds rather than the averages, because the greatest impacts are typically associated with high-magnitude winds. A strong wind event can also break up existing sea ice, further exposing the coast to wave activity.
Wind speeds in excess of 10 m/s are considered strong enough to have an impact on the coastal regime[4] when occurring during the open water period (broadly defined as July through October, although there is regional variability). Serreze et al.[5] summarized a number of studies that have identified a decreasing trend in sea-level pressure over the Arctic Ocean. This has been linked to an increasing trend in both the frequency (trend significant in all seasons) and intensity (trend significant in summer) of cyclonic activity[6], although these trends are not apparent at all sites (e.g., Barrow, Alaska[7]). At many sites in the circumpolar coastal station network, there was also a decrease between 1950 and 2000 in the observed time between cyclonic events during the open-water season[8].
Wind forcing of oceanographic processes in the Arctic is moderated by the presence of sea ice throughout much of the year. Severe winter storms, which have such a devastating effect on temperate coasts, have little impact on arctic shores because sea ice protects the Arctic Ocean coastline from waves for eight months or more of the year. The impacts of changes in the duration of the open-water season depend on not only the magnitude, duration, and direction of winds, but also on the extent and concentration of sea ice. Sea ice affects wave generation and, to a lesser extent, the magnitude of storm surges. The duration of the open-water season varies considerably both spatially and temporally. Some parts of the Canadian Archipelago are never ice-free, while sea ice is rare in the vicinity of northern Norway (under the influence of the Gulf Stream). In some locations, interannual variations in the duration and extent of the open water range from a few weeks and several kilometers of fetch to eight to ten weeks and hundreds of kilometers of fetch, as in the Beaufort Sea in late summer and early autumn. Changes in the duration of the open-water season will be critical to the future impacts of coastal storms in the Arctic. There are various examples of Inuit peoples having difficulty coping with thinning ice, retreating ice-floe edges, and increasing storm frequency during the last decade[9]. These experiences indicate that, while sea-level rise is one of the most well known possible consequences of climate change, the fate of sea ice may be equally or more important to natural and human coastal systems.
Sea-ice pressure-ridge keels and icebergs scour the seabed, resulting in a characteristic roughened or ploughed seabed morphology that may affect resuspension rates and could change the degree of consolidation of the seabed surface. This process may be responsible for enhanced coastal retreat along parts of the Canadian Beaufort Sea coast.
Compounding the problem of sea-level change are concerns about arctic coastal stability, which directly affects human settlements and development. The stability of any coast is a function of the interaction between meteorological and oceanographic forcing and the physical properties of coastal materials. Short-term (hours to days) meteorological and oceanographic events are superimposed on the medium-term elevation of the sea surface, which changes seasonally and interannually due to natural climate variability, and over the longer term due to the combination of vertical motion of the land and the volume and distribution of the global ocean.
High-latitude coastal environments differ from their temperate counterparts in several important ways. The interaction between the atmosphere and the ocean that produces waves and storm surges is mediated by the presence and concentration of sea ice, while coastal materials are either strengthened or destabilized by the presence of permafrost, the abundance of ground ice, and associated temperature regimes[10].
Arctic coasts are as variable as coasts in temperate regions. The most unstable coasts are those that are composed of unlithified sediments (Fig. 6.38). These sediments were deposited during the past glacial and interglacial periods, are affected by permafrost erosion, and contain variable, sometimes significant, amounts of ground ice. Unlithified sediments are concentrated along much of the Russian coast and along the Beaufort Sea coast. Bedrock coasts are located in the Canadian Archipelago, and along Greenland, Norway, and extreme western Russia. The bedrock coasts generally coincide with those areas that experienced extensive glaciation during the Holocene. Even along bedrock and fjord-dominated coasts, beaches and deltas do occur, and those are usually where human settlements and infrastructure are concentrated (Section 16.3 (Sea-level rise and coastal stability in the Arctic)).
Recent and ongoing changes (6.9.2)
According to the IPCC[11], sea level has risen more than 120 meters (m) over the past 20,000 years as a result of mass loss from melting ice sheets. The IPCC also reports that, based on geological data, global mean sea level may have increased at an average rate of about 0.5 millimeters per year (mm/yr) over the last 6,000 years and at an average rate of 0.1 to 0.2 mm/yr over the last 3,000 years. In addition, vertical land movements are still occurring today.
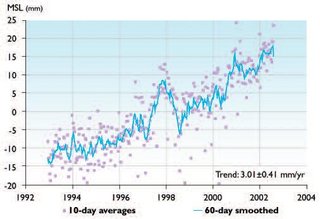 Fig. 6.39. Temporal variations in global mean sea level (MSL) computed from TOPEX/POSEIDON measurements between December 1992 and July 2002[12].
 The IPCC[13] consensus value for the current rate of sea-level rise is 1 to 2 mm/yr. Recent results from global tide gauge analyses (length <70 years) show that the present global mean rate of sea-level rise is closer to 2 mm/yr[14]. Complex short-term variations are superimposed on this rise, complicating the evaluation of trends (Fig. 6.39).
While both steric rise and eustatic rise are thought to be responsible for the current increase in sea level[15], Cabanes et al.[16] recently used a combination of ocean temperature measurements and satellite observations of sea level to argue that nearly all the present sea-level rise can be accounted for by steric processes alone. Others[17] have countered that, due to melting [[glacier]s], the eustatic contribution is significant. Munk[18] and others report observed recent freshening of ocean water, which also suggests an increase in freshwater discharge from the land. These arguments, combined with new data from satellite-borne altimeters and gravity-measuring instruments and new calculations of glacio-isostatic adjustments, make this a complex subject for which there is no firm consensus, but rather an evolving spectrum of views.
The mass of the ocean, and thus sea level, changes as water is exchanged with glaciers and ice caps. Observational and modeling studies of glaciers and ice caps ([[Section 6.5 (Sea-level rise and coastal stability in the Arctic)]2]) indicate a contribution to sea-level rise of 0.2 to 0.4 mm/yr averaged over the 20th century. Modeling studies suggest that climate changes during the 20th century have led to contributions of -0.2 to 0.0 mm/yr from [[Antarctic]a] (the result of increasing precipitation) and 0.0 to 0.1 mm/yr from Greenland (from changes in both precipitation and runoff).
 Fig. 6.40. Factors affecting coastal stability in the Arctic. Blue dots show stations where relative sea level (RSL) is rising; red dots show stations where RSL is falling. The light green area in the Arctic Ocean represents present-day September sea-ice extent (concentrations exceeding 15% in at least half the Septembers from 1980 to 1999). The pink area is the corresponding ACIA model-projected sea-ice extent (ice present in September in more than 50% of the years from 2071–2090; five-model average). Regions with unlithified coasts are shown in dark green, while regions with lithified coasts are shown in dark brown[19].
 Rates of change in the Arctic similar to the global values have been documented. Sea-level curves for the Beaufort Sea shelf suggest a rapid rise (~7 to 8 mm/yr) between 10,000–8,000 and 3,000 years BP, and a slower average rise (~1.1 to 2.5 mm/yr) from 3,000 years BP to the present[20]. These rates refer to relative sea-level rise and therefore include the isostatic contribution. Multi-decadal tide gauge data from Russian Arctic stations show relative sea-level rise of 0.3 to 3.2 mm/yr[21] (Fig. 6.40). Data from additional stations in Alaska[22] show mostly falling sea levels in the Pacific region (probably related to tectonic activity) and a single station in the Canadian Arctic showing rising sea level[23]. Analyses reported by Proshutinsky[24] indicate that in the Russian sector of the Arctic Ocean, sea level increased by an average of 1.85 mm/yr over the past 50 years (after correction for glacioisostatic adjustments). Most of the increase is attributed to a combination of steric effects (0.64 mm/yr), decreasing sea-level pressure (0.56 mm/yr), and increasing cyclonic curvature of the mean wind field (0.19 mm/yr). For comparison, the IPCC[25] reports observational estimates of the steric effect of about 1 mm/yr over recent decades, similar to values of 0.7 to 1.1 mm/yr simulated by AOGCMs over a comparable period. Averaged over the 20th century, AOGCM simulations suggest thermal expansion rates of 0.3 to 0.7 mm/yr.
Sea-ice conditions, especially greater amounts of open water, also contribute to increasing coastal instability. Figure 6.40 contrasts the present-day September sea-ice extent with that projected by the Arctic Climate Impact Assessment (ACIA) models for the 2071–2090 time slice. The significant projected increase in open-water extent is likely to create more energetic wave and swell conditions at the coast resulting in greater coastal instability.
The ACD project (Section 6.6.2.5 (Sea-level rise and coastal stability in the Arctic)) was initiated in 1999 to compile circumpolar coastal change data, to develop a comprehensive set of monitoring sites, and to synthesize information about historical coastal environmental forcing. Based in part on information from the ACD project, it is clear that large regions of the arctic coast are undergoing rapid change. For example, Rachold et al.[26] reported that the average rate of retreat of the Laptev Sea coast is 2.5 m/yr, a rate that contributes more sediment and organic carbon to the sea than does the Lena River. Retreat also predominates along the coast of the Beaufort Sea and large portions of the Russian coast. However, most arctic coastal stability monitoring records are too short and infrequent to identify trends in rates of retreat. The records show considerable annual and decadal variation in recent rates of retreat, which are attributed to variability in the frequency and severity of coastal storms and variations in open-water extent.
Projected changes (6.9.3)
 Fig. 6.41. Projected global sea-level rise between 1990 and 2100 using 35 different emissions scenarios. Thermal expansion and land ice changes were calculated using a simple climate model calibrated separately for each of seven AOGCMs. Contributions from changes in permafrost, the effect of sediment deposition, and the long-term adjustment of the ice sheets to past climate change were added. Each of the six colored lines is the average of all the model projections for one of six illustrative emissions scenarios; vertical bars at the right show the range of these projections. The region of light shading shows the range of the seven-model average projection for all 35 scenarios. The dark shading shows the entire range of projections by the seven models for the 35 scenarios. The outermost lines delineate the range of projections from all models and scenarios with the additional uncertainties due to changes in land ice, permafrost, and sediment deposition included[27].
 IPCC[28] projections of the components contributing to sea-level change between 1990 and 2100 are as follows: thermal expansion of 0.11 to 0.43 m, accelerating throughout the 21st century; a glacier contribution of 0.01 to 0.23 m; a Greenland contribution of -0.02 to 0.09 m; and an Antarctic contribution of -0.17 to 0.02 m. The glacier and Greenland contributions are consistent with the estimate of 0.04 m derived from the ACIA-designated models forced with the B2 emissions scenario (Section 6.5 (Sea-level rise and coastal stability in the Arctic) 3). Including thawing of permafrost, sediment deposition, and the ongoing contributions from ice sheets as a result of climate change since the Last Glacial Maximum, projected global average sea-level rise between 1990 and 2100 ranges from 0.09 to 0.88 m over the 35 emissions scenarios used by the IPCC (Fig. 6.41).
The wide range in the projections shown in Fig. 6.41 reflects systematic uncertainties in modeling. The central value of 0.48 m represents more than a doubling of the mean rate of global sea-level rise over the 20th century. Based on the summation of the components contributing to sea-level rise, the IPCC projects that global sea level will rise by 0.11 to 0.77 m between 1990 and 2100[29]. However, the large variation among the models is an outstanding feature of the IPCC projections of sea-level rise. Moreover, sea-level rise will depend strongly on the actual greenhouse gas (GHG) emissions (for which any scenario beyond the 21st century is highly uncertain) and the behavior of glaciers and ice sheets, particularly the Greenland and the West Antarctic Ice Sheets. The range in the projections given above makes no allowance for instability of the West Antarctic Ice Sheet, although it is now widely agreed that major loss of grounded ice and accelerated sea-level rise due to West Antarctic Ice Sheet instability are very unlikely during the 21st century.
One of the important results of these model studies is that projected sea-level rise is not globally uniform. In particular, the greatest sea-level increases are projected for the Arctic, based on output from seven of nine models[30]. Figure 6.42 shows the IPCC[31] model-projected sea-level changes after transformation to the same polar projection, providing a better depiction of spatial variability in the Arctic.
The IPCC[32] stated that confidence in the regional distribution of sea-level change projected by AOGCMs is low because there is little similarity between model projections for various regions. One of the reasons for these regional differences may be the across-model variations in projected freshening of the Arctic Ocean owing to increased runoff or precipitation over the ocean[33]. Using the NASA–GISS atmosphere–ocean model, Miller and Russell[34] project that arctic sea level will rise by 0.73 m between 2000 and 2100, of which 0.42 m is due to thermal expansion and about 0.31 m is from increased freshwater input, which also reduces the salinity. The mean global sea-level rise projected by the NASA–GISS model is 0.45 m during the same period.
 Fig. 6.42. Projected sea-level rise between 2000 and 2100 based on output from nine global climate models: (a) CSIRO Mk2 GS; (b) GFDL-R3_c; (c) MRI2 GS; (d) HadCM3 GSIO; (e) HadCM2 GS; (f) CMC2 GS; (g) SMC1 GS; (h) GFDL r15 b; and (i) ECHAM4/OPYC3 G (figure courtesy of J. Gregory[35]; see IPCC[36] for description of models and scenarios used).
 Land movements, both isostatic and tectonic, will continue throughout the 21st century at rates that are unaffected by climate change. It is possible that by 2100, many regions currently experiencing decreases in relative sea level will instead have a rising relative sea level. Extreme high-water levels will occur with increasing frequency as a result of projected mean sea-level rise. Their frequency is likely to be further increased if storms become more frequent or severe as a result of climate change.
Projected decreases in sea-ice extent (Section 6.3.3 (Sea-level rise and coastal stability in the Arctic); see also Section 16.2.5 (Sea-level rise and coastal stability in the Arctic)) will result in longer open-water seasons and an increased probability that severe storm events will occur without the protection of winter ice cover.
Impacts of projected changes (6.9.4)
On other parts of the physical system
Increases in sea level are likely to increase coastal erosion rates in low-elevation areas and affect sediment transport in coastal regions. The salinity of bays, estuaries, and low-lying coastal areas is likely to increase as sea level rises. Spatial variations in sea-level changes may alter ocean currents and sediment transport. An increase in the duration of the open-water season will increase the frequency of wave-induced mixing, sediment transport, and storm surges during shoulder seasons, especially the autumn.
On ecosystems
Extensive coastal lowlands and immense deltas host ecosystems that will be affected by increases in sea level. Wetlands are likely to move farther inland, and coastal flood events will increase. Salinity will increase in coastal marine ecosystems that are now freshened by terrestrial discharge. If storm surges and coastal flood events increase in frequency and/or intensity, bird and fishery habitats in the affected areas are likely to be adversely affected. Decreased sea-ice coverage, which increases the probability that arctic storms will occur over open water, may change the timing and extent of mixing regimes and water–sediment interaction in coastal waters, with potential effects on benthic and coastal ecosystems.
On people
In the Arctic, many communities and much of the infrastructure are located on the coast and are therefore vulnerable to projected changes. Coastal erosion will have impacts on infrastructure and other human activities in the vicinity of coastlines (section 16.4.3). The frequency and severity of coastal flood events are likely to increase, and the severity may be compounded by the loss of sea ice along the coast during the autumn and spring seasons during which, under present climate conditions, coastal waters are usually ice-covered.
Critical research needs (6.9.5)
The IPCC[37] estimated that eustatic sea-level rise over the past 100 years was 0.10 to 0.20 m, which is higher than the estimated total sea-level rise over the same period. This discrepancy in estimates of historical change points to the imperfect state of current knowledge of sea-level variations. Similarly, the relative importance of eustatic and steric contributions to recent sea-level rise is a subject of current disagreement, as noted in Section 6.9.2 (Sea-level rise and coastal stability in the Arctic). Attribution is a key issue in understanding and projecting sea-level change, and must be regarded as a key research need.
Uncertainties in the projected sea-level changes are very large, although improved observations and modeling have reduced some uncertainties since publication of the Second Assessment Report[38]. The present wide range of projections is partially a consequence of uncertainties in the scenarios of future GHG forcing, as well as uncertainties in the response of different global climate models to this forcing. It is also a consequence of how different models simulate (or do not simulate) the response of [[glacier]s], ice sheets, and the oceans to climate change. In order to more realistically capture glacier and ice sheet responses, models will need to resolve the topographic features that surround most glaciers (and the topography of the larger ice sheets). Topographic resolution is essential for simulation of the precipitation and melt regimes, including the location of the equilibrium line, of significant glaciers. Other research needs for projecting the response of glaciers and ice sheets are discussed in Section 6.5.5 (Sea-level rise and coastal stability in the Arctic). The discharge of glacial meltwater to the ocean creates spatial gradients in sea level and upper-ocean salinity, both of which will trigger oceanic responses. These responses are not well understood and are poorly simulated, yet are crucial to projecting regional variations in sea-level rise.
The contribution of [[Antarctic]a] to future changes in sea level remains a major uncertainty. Whether or not an increase in precipitation will offset the effects of enhanced melt in a warmer climate is a first-order question that needs to be addressed. Changes in the West Antarctic Ice Sheet have the potential to contribute significantly to future changes in global sea level.
For model simulations to be useful in assessments of coastal stability, enhanced resolution of coastlines is required in order to simulate realistically the sharp near-coastal gradients that are likely to characterize GHG-induced changes in temperature and precipitation. Credible simulations of changes in storminess and surface winds will also require improved model resolution and parameterizations of surface fluxes in high latitudes.
Finally, assessments of coastal vulnerability in the Arctic suffer from the limitations of the observational network for monitoring coastal surface winds and coastal stability. Data from the existing station network are of limited utility for driving numerical wave and surge models, which require offshore wind fields. The availability of surface wind data from the Arctic Ocean is poorer still. Evaluations of current trends in storm events and the associated coastal vulnerabilities will require additional sources of reliable surface wind data from coastal and offshore areas in the Arctic. Observations of coastal responses to wind and sea-level forcing are also essential in order to quantify the relationships between environmental processes and coastal impacts.
Chapter 6: Cryosphere and Hydrology
6.1. Introduction (Sea-level rise and coastal stability in the Arctic)
6.2. Precipitation and evapotranspiration
6.3. Sea ice (Sea ice in the Arctic)
6.4. Snow cover
6.5. Glaciers and ice sheets
6.6. Permafrost (Permafrost in the Arctic)
6.7. River and lake ice
6.8. Freshwater discharge
6.9. Sea-level rise and coastal stability
References
Citation
Committee, I. (2012). Sea-level rise and coastal stability in the Arctic. Retrieved from http://editors.eol.org/eoearth/wiki/Sea-level_rise_and_coastal_stability_in_the_Arctic- ↑ Brown, J., O.J. Ferrians, J. A. Heginbottom and E.S. Melnikov, 1997. Circum-Arctic Map of Permafrost and Ground-ice Conditions. U.S.G.S. Circum-Pacific Map series, Map CP-45. U.S. Geological Survey.–Peltier, W.R., 2004. Global glacial isostasy and the surface of the iceage Earth: the ICE-5G(VM2) model and GRACE. Annual Review of Earth and Planetary Sciences, 32:111–149.
- ↑ Peltier, W.R., 2001. Global glacial isostatic adjustment and modern instrumental records of relative sea level history. In: B. Douglas, M. Kearney and S. Leatherman (eds.). Sea Level Rise: History and Consequences. International Geophysics Series, 75:65–95.–Peltier,W.R., 2004. Global glacial isostasy and the surface of the ice-age Earth: the ICE-5G(VM2) model and GRACE. Annual Review of Earth and Planetary Sciences, 32:111–149.
- ↑ Zwally, H.J., W. Abdalati, T. Herring, K. Larson, J. Saba and K. Steffen, 2002. Surface melt-induced acceleration of Greenland ice-sheet flow. Science, 297:218–222.
- ↑ Solomon, S.M., D.L. Forbes and B. Kierstead, 1994. Coastal Impacts of Climate Change: Beaufort Sea Erosion Study. Geological Survey of Canada, Open File 2890, 85pp.
- ↑ Serreze, M.C., J.E. Walsh, F.S. Chapin III, T. Osterkamp, M. Dyurgerov, V. Romanovsky, W.C. Oechel, J. Morison, T. Zhang and R.G. Barry, 2000. Observational evidence of recent changes in the northern high-latitude environment. Climatic Change, 46:159–207.
- ↑ McCabe, G.J., M.P. Clark and M.C. Serreze, 2001. Trends in northern hemisphere surface cyclone frequency and intensity. Journal of Climate, 14:2763–2768.–Serreze, M.C., J.E. Walsh, F.S. Chapin III, T. Osterkamp, M. Dyurgerov, V. Romanovsky, W.C. Oechel, J. Morison, T. Zhang and R.G. Barry, 2000. Observational evidence of recent changes in the northern high-latitude environment. Climatic Change, 46:159–207.
- ↑ Lynch, A.H., J. A. Curry, R.D. Brunner and J. A. Maslanik, 2004. Towards an integrated assessment of the impacts of extreme wind events on Barrow, Alaska. Bulletin of the American Meteorological Society, 85:209–221.
- ↑ Atkinson, D., 2003. Pers. comm. National Research Council of Canada.
- ↑ Kerr, R., 2002. A warmer Arctic means change for all. Science, 297:1490–1492.
- ↑ Are, F. A., 1988. Thermal abrasion of sea coasts (Parts I and II). Polar Geography and Geology, 12:1–157.–Kobayashi, N., J.C. Vidrine, R.B. Nairn and S.M. Solomon, 1999. Erosion of frozen cliffs due to storm surge on the Beaufort Sea Coast. Journal of Coastal Research, 15:332–344.
- ↑ IPCC, 2001. Climate Change 2001: The Scientific Basis. Contribution of Working Group I to the Third Assessment Report of the Intergovernmental Panel on Climate Change. J.T. Houghton, Y. Ding, D.J. Griggs, M. Noguer, P.J. van der Linden, X. Dai, K. Maskell and C.A. Johnson (eds.). Cambridge University Press, 881pp.
- ↑ Leuliette, E. W., R.S. Nerem and G. T. Mitchum, 2004. Calibration of TOPEX/Poseidon and Jason altimeter data to construct a continuous record of mean sea level change. Marine Geodesy, 27(1–2):79–94.–University of Colorado Global Mean Sea Level Change.
- ↑ IPCC, 2001. Climate Change 2001: The Scientific Basis. Contribution of Working Group I to the Third Assessment Report of the Intergovernmental Panel on Climate Change. J.T. Houghton, Y. Ding, D.J. Griggs, M. Noguer, P.J. van der Linden, X. Dai, K. Maskell and C.A. Johnson (eds.). Cambridge University Press, 881pp.
- ↑ Douglas, B.C., 2001. Sea level changes in the era of the recording. In: B. Douglas, M. Kearney and S. Leatherman (eds.). Sea Level Rise: History and Consequences, pp. 37–64. Academic Press.–Peltier, W.R., 2001. Global glacial isostatic adjustment and modern instrumental records of relative sea level history. In: B. Douglas, M. Kearney and S. Leatherman (eds.). Sea Level Rise: History and Consequences. International Geophysics Series, 75:65–95.–Cabanes, C., A. Cazenave and C. Le Provost, 2001. Sea level rise during past 40 years determined from satellite and in situ observations. Science, 294:840–842.
- ↑ Douglas, B.C., M. Kearney and S. Leatherman (eds.), 2001. Sea Level Rise: History and Consequences. Academic Press, 232pp.
- ↑ Cabanes, C., A. Cazenave and C. Le Provost, 2001. Sea level rise during past 40 years determined from satellite and in situ observations. Science, 294:840–842.
- ↑ Meier, M.F. and J.M. Wahr, 2002. Sea level is rising: Do we know why? Proceedings of the National Academy of Sciences, 99(10): 6524–6526.–Munk, W., 2002. Twentieth century sea level: An enigma. Proceedings of the National Academy of Sciences, 99:6550–6555.
- ↑ Munk,W., 2003. Ocean freshening, sea level rising. Science, 300: 2041–2043.
- ↑ Hadley Centre for Climate Prediction and Research, United Kingdom, HadISST dataset.–Proshutinsky, A., V. Pavlov and R.H. Bourke, 2001. Sea level rise in the Arctic Ocean. Geophysical Research Letters, 28:2237–2240.–Proshutinsky, A., 2003. Pers. comm. Woods Hole Oceanographic Institution, Massachusetts.–Zervas, C. 2001. Sea Level Variations of the United States 1854–1999. NOAA Technical Report NOS CO-OPS 36. National Oceanic and Atmospheric Administration, Silver Spring, Maryland, 65pp+appendices.
- ↑ Campeau, S., A. Hequette and R. Pienitz, 2000. Late Holocene diatom biostratigraphy and sea-level changes in the southeastern Beaufort Sea. Canadian Journal of Earth Sciences, 37:63–80.–Hill, P.R., A. Héquette and M.H. Ruz, 1993. Holocene sea level history of the Canadian Beaufort Shelf. Canadian Journal of Earth Sciences, 30:103–108.
- ↑ Proshutinsky, A., V. Pavlov and R.H. Bourke, 2001. Sea level rise in the Arctic Ocean. Geophysical Research Letters, 28:2237–2240.
- ↑ Zervas, C. 2001. Sea Level Variations of the United States 1854–1999. NOAA Technical Report NOS CO-OPS 36. National Oceanic and Atmospheric Administration, Silver Spring, Maryland, 65pp+appendices.
- ↑ Douglas, B.C., M. Kearney and S. Leatherman (eds.), 2001. Sea Level Rise: History and Consequences. Academic Press, 232pp.
- ↑ Proshutinsky, A., 2003. Pers. comm. Woods Hole Oceanographic Institution, Massachusetts.
- ↑ IPCC, 2001. Climate Change 2001: The Scientific Basis. Contribution of Working Group I to the Third Assessment Report of the Intergovernmental Panel on Climate Change. J.T. Houghton, Y. Ding, D.J. Griggs, M. Noguer, P.J. van der Linden, X. Dai, K. Maskell and C.A. Johnson (eds.). Cambridge University Press, 881pp.
- ↑ Rachold, V., J. Brown and S.M. Solomon, 2002. Arctic Coastal Dynamics. Report of an International Workshop, Potsdam (Germany) 26–30 November 2001. Report on Polar Research 413, 27 extended abstracts, 103 pp.
- ↑ IPCC, 2001. Climate Change 2001: The Scientific Basis. Contribution of Working Group I to the Third Assessment Report of the Intergovernmental Panel on Climate Change. J.T. Houghton, Y. Ding, D.J. Griggs, M. Noguer, P.J. van der Linden, X. Dai, K. Maskell and C.A. Johnson (eds.). Cambridge University Press, 881pp.
- ↑ IPCC, 2001. Climate Change 2001: The Scientific Basis. Contribution of Working Group I to the Third Assessment Report of the Intergovernmental Panel on Climate Change. J.T. Houghton, Y. Ding, D.J. Griggs, M. Noguer, P.J. van der Linden, X. Dai, K. Maskell and C.A. Johnson (eds.). Cambridge University Press, 881pp.
- ↑ Church, J. A., J.S. Godfrey, D.R. Jackell and T.J. McDougall, 1991. A model of sea level rise caused by ocean thermal expansion. Journal of Climate, 4:438–456.–IPCC, 2001. Climate Change 2001: The Scientific Basis. Contribution of Working Group I to the Third Assessment Report of the Intergovernmental Panel on Climate Change. J.T. Houghton, Y. Ding, D.J. Griggs, M. Noguer, P.J. van der Linden, X. Dai, K. Maskell and C.A. Johnson (eds.). Cambridge University Press, 881pp.
- ↑ Gregory, J., 2003. Pers. comm. University College of Reading, United Kingdom.
- ↑ IPCC, 2001. Climate Change 2001: The Scientific Basis. Contribution of Working Group I to the Third Assessment Report of the Intergovernmental Panel on Climate Change. J.T. Houghton, Y. Ding, D.J. Griggs, M. Noguer, P.J. van der Linden, X. Dai, K. Maskell and C.A. Johnson (eds.). Cambridge University Press, 881pp.
- ↑ IPCC, 2001. Climate Change 2001: The Scientific Basis. Contribution of Working Group I to the Third Assessment Report of the Intergovernmental Panel on Climate Change. J.T. Houghton, Y. Ding, D.J. Griggs, M. Noguer, P.J. van der Linden, X. Dai, K. Maskell and C.A. Johnson (eds.). Cambridge University Press, 881pp.
- ↑ Bryan, K., 1996. The steric component of sea level rise associated with enhanced greenhouse warming: a model study. Climate Dynamics, 12:545–555.–Miller, J.R. and G.L. Russell, 2000. Projected impact of climate change on the freshwater and salt budgets of the Arctic Ocean by a global climate model. Geophysical Research Letters, 27:1183–1186.
- ↑ Miller, J.R. and G.L. Russell, 2000. Projected impact of climate change on the freshwater and salt budgets of the Arctic Ocean by a global climate model. Geophysical Research Letters, 27:1183–1186.
- ↑ Gregory, J., 2003. University College of Reading, United Kingdom.
- ↑ IPCC, 2001. Climate Change 2001: The Scientific Basis. Contribution of Working Group I to the Third Assessment Report of the Intergovernmental Panel on Climate Change. J.T. Houghton, Y. Ding, D.J. Griggs, M. Noguer, P.J. van der Linden, X. Dai, K. Maskell and C.A. Johnson (eds.). Cambridge University Press, 881pp.
- ↑ IPCC, 2001. Climate Change 2001: The Scientific Basis. Contribution of Working Group I to the Third Assessment Report of the Intergovernmental Panel on Climate Change. J. T. Houghton, Y. Ding, D.J. Griggs, M. Noguer, P.J. van der Linden, X. Dai, K. Maskell and C.A. Johnson (eds.). Cambridge University Press, 881pp.
- ↑ IPCC, 1996. Climate Change 1995: The Science of Climate Change. J. T. Houghton, L.G. Meira Filho, B. A. Callender, N. Harris, A. Kattenberg and K. Maskell (eds.). Intergovernmental Panel on Climate Change, Cambridge University Press, 572pp.