Ecosystems and Human Well-Being: Volume 1: Current State and Trends: Ecosystem Change and Human Wellbeing

This is Chapter 5 of the Millenium Ecosystem Assessment report Ecosystems and Human Well-Being: Volume 1: Current State and Trends
Coordinating Lead Authors: Marc Levy, Suresh Babu, Kirk Hamilton
Lead Authors: Valerie Rhoe, Alessandro Catenazzi, Ma Chen,Walter V. Reid, Debdatta Sengupta, Cai Ximing
Contributing Authors: Andrew Balmford, William Bond
Review Editors: David Rapport, Linxiu Zhang
Main Messages
Over historical time frames, human well-being has on aggregate improved by several orders of magnitude. Incomes have increased, population (Population growth rate)s (Population growth rate) have grown, life expectancies have risen, and political institutions have become more participatory. In the global aggregate, human well-being continues to expand, although there are variations across geographical regions.
Well-being is not distributed evenly among individuals, countries, or social groups. Inequality is high, and gaps between the well-off and the disadvantaged are increasing. A child born in sub-Saharan Africa is 20 times more likely to die before age five than a child born in an OECD country, and this ratio is higher than it was a decade ago.
The ecosystems as classified by the Millennium Ecosystem Assessment vary in the degree to which they harbor high values of human well-being. For example, cultivated systems and coastal ecosystems tend to be characterized by high human well-being, while drylands are characterized by low human well-being.
The degree to which well-being varies across ecosystems is not the same everywhere. Variance in human well-being is highest in Asia and sub-Saharan Africa and lowest in the OECD. For example, per capita incomes in Asia are 40% higher in the [[coastal] zones] than they are in the drylands, while in OECD countries there is no significant difference between incomes in the two systems.
Populations are increasing in ecosystems characterized currently by low well-being. Whereas historically populations have tended to shift from low-productivity ecosystems to high-productivity ecosystems or to urban areas, today there are signs that the relative concentration of people in less productive ecosystems is going up. The concentration of poor in less-favored lands of Asia and sub-Saharan Africa is an example.
These trends signify that there are a large number of people at risk of adverse ecosystem changes. Approximately 1.1 billion people survive on less than $1 per day of income, most of them in rural areas where they are highly dependent on agriculture, grazing, and hunting for subsistence. For these people, degradation and declining productivity of ecosystems threatens their survival.
Ecosystem changes affect human well-being in a variety of different ways. Often the impacts of ecosystem changes are shifted from the groups responsible for them onto other groups. Sometimes ecosystem change is embedded in distributional conflicts over resources, with one group improving at another group’s expense. Often impacts are experienced differentially as a function of levels of coping capacity—such differences can manifest themselves at the individual, household, regional, or national level.
Among less poor populations, ecosystem changes affect well-being in more subtle but not necessarily less important ways. Declines in incomes, loss of culturally important natural resources, and increases in threats to health can be expected to accompany declining ecosystem health.
5.1 Introduction
This chapter provides an overview of the primary patterns and trends in human well-being and summarizes what is known broadly about the connections between human well-being and ecosystems. It does not substitute for the more detailed findings found in the other chapters of this volume, but rather provides an overarching empirical foundation for assessing human well-being and ecosystem change side by side.
5.2 Dimensions of Human Well-being
This section reviews how the different dimensions of human well-being are measured, the extent of our knowledge about them, and the primary measurement gaps. (See also Chapter 2 (Ecosystems and Human Well-Being: Volume 1: Current State and Trends: Ecosystem Change and Human Wellbeing) for further description of the measurement of human well-being.) The benefits of qualitative data and new approaches for assessing human well-being are acknowledged, but the use of this information is limited in this global assessment because of difficulties comparing data across countries and aggregating information within units of ecosystems. Five dimensions of human well-being are recognized in the MA: basic material for a good life, freedom and choice, health, good social relations, and security (MA 2003).
5.2.1 Basic Material for a Good Life
The basic materials for a good life include adequate income, household assets, food, water, and shelter. Considerable effort goes into measuring and monitoring these dimensions of well-being. Systems of national accounts generate regular estimates of gross national income and GNP; these estimates are made roughly comparable through calculation of purchasing power parity, estimates that correct for price differences across countries. Food production is measured by central governments and by international organizations such as the Food and Agriculture Organization. FAO also measures national per capita dietary energy supply for most countries. (See Chapter 8 for further information.) Micronutrient information on vitamin A, iodine, and iron is collected at the community level but is not as widely available as DES. National-level water estimates are available, though these tend to be less precise than income and food measures. Of all these measures, shelter is probably the most poorly measured. The distribution of the quality of substandard housing is not known with any confidence.
Increasingly, measures of these basic material dimensions of well-being are being carried out through detailed household surveys (Deaton 1997). Living standard measurement surveys began collecting standardized measures of well-being at the household level in 1985. Approximately 100 developing countries have carried out such surveys. Other large-scale household survey efforts include demographic and health surveys and national-level multiple indicator cluster surveys. Surveys such as these provide information about nutrition, housing type, household assets, and access to water, health care, and sanitation.
Although great effort goes into these measurement efforts, they do not provide a complete enough picture to support a full understanding of the distribution of well-being and its relationship to ecosystem services. Comparable measures of water and sanitation access, for example, are scarce, because terminologies, methodologies, and measurement priorities differ from place to place (Millennium Project 2004). Even the measurements that receive the greatest level of effort, the national income measures, are inadequate for many purposes. They imperfectly capture economic activity outside the formal sector and the value from subsistence activities, for example, which is often highly important among populations vulnerable to decline in ecosystem services.
Especially problematic is the concept of poverty. Although poverty is the focus of many local, national, and international policies, and although many countries measure it, there is little congruence of measurement efforts and, as a result, little ability to portray clear patterns and trends (Deaton 2003; Reddy and Pogge 2002). Some efforts to measure poverty do so strictly in terms of income. For example, the World Bank relies heavily on household survey data to estimate the number of people living on less than $1 per day, and this measure is a prominent component of the Millennium Development Goal targets.
However, measures of income poverty have been criticized because of problems of comparability and relevance. Comparability is difficult because of the challenges involved in comparing prices, which is quite important at such low thresholds of income. Relevance is a problem where human well-being is often heavily dependent on non-income factors such as household assets (stoves, bicycles, toilets, housing materials, and so on) and output from subsistence activities (cultivation, hunting, and fishing). In spite of such measurement and comparability difficulties, an attempt is made here to provide an overview of trends in selected human well-being indicators and ecosystems.
5.2.2 Freedom and Choice
Freedom is defined as the range of options a person has in deciding on and realizing the kind of life to lead. At a broad scale, only a few of the many specific phenomena that are relevant to this dimension of well-being are measured at all, and many of those that are measured are problematic.
The degree to which political institutions are participatory is not measured by any intergovernmental agency, chiefly because of disputes over what are appropriate measures. The most widely used measure in the scientific literature is the polity database, which provides annual measures of democratic institutions for 160 countries (Jaggers and Gurr 1995). The polity data, and similar efforts such as the Heritage Foundation’s index of civil liberties, provide comparable, clear measures of national political institutions that emphasize electoral institutions and constraints on chief executives. There are no comparable data that measure citizen participation in decision-making at regional or local levels, although this dimension of freedom and choice has been well connected to ecosystem management and human well-being (Ostrom 1990; Ostrom et al. 2002).
Education is a clear aspect of well-being that enhances life prospects. Comparable international measures are poor. A frequently used measure is literacy, which is a component of the Human Development Index. Literacy is hard to measure accurately and comparably (Bruns et al. 2003). Moreover, it represents only a small aspect of education. Some countries collect comparable data on the percent of the population (often broken down by gender) enrolled in school, but this too is incomplete. More relevant for life prospects is the school completion rate, but this is not well measured.
5.2.3 Health
Human health is measured in a variety of ways, and knowledge about broad trends and patterns concerning health is good. Life expectancy, infant mortality, and child mortality are measured fairly intensively. Most central governments collect these vital statistics and publish them; international organizations such as the World Health Organization and World Bank collate and harmonize these measures. As a result, high-quality country-level time series on these measures are available. Some scholars have been able to construct time series going back several centuries by relying on a range of vital statistics collections (Maddison 2001).
Knowledge of health aspects of human well-being is more limited when it comes to more precise dimensions such as sub-national patterns or specific disease prevalences. There are no consistent monitoring or measurement efforts that measure health outcomes at a sub-national level. Infant mortality and child mortality are measured through a set of coordinated household survey efforts, including the DHS and MICS, and these can be used to generate estimates for sub-national regions, on the order of about 10 regions per country. Such surveys are not carried out in every country, however, and no more than about once per decade. As a result, it is difficult to portray the distribution of human health at a level of resolution more precise than national boundaries.
When it comes to measuring health outcomes in terms of specific diseases, monitoring and surveillance are also less complete than for vital statistics. Few disease incidence statistics are collected across a significant number of countries in a comparable enough fashion to permit robust tracking of patterns. The World Health Organization collects disease-specific data by country, but reports primarily at the level of six world regions because of limitations in comparability (WHO 2004).
5.2.4 Good Social Relations
Humans enjoy a state of good social relations when they are able to realize aesthetic and recreational values, express cultural and spiritual values, develop institutional linkages that create social capital, show mutual respect, have good gender and family relations, and have the ability to help others and provide for their children (MA 2003; Dasgupta and Serageldin 1999). This aspect of human well-being is not well measured, largely because it is more difficult to observe directly. Partly as a result of recent scholarship identifying the importance of social relations and social capital in explaining a range of important public policy outcomes (e.g., Putnam et al. 1993; OECD 2001), interest in measuring this dimension has increased considerably in the past decade. Although comparable quantitative measurements remain very primitive, there are case studies that illustrate the sensitivity of ecosystem changes on good social relations. (See Box 20.12 in Chapter 20, on North America’s Great Lakes and Invasive Species.) Some research has noted that high levels of economic development are sometimes associated with poor social relations (Jungeilges and Kirchga¨ssner 2002). Problems such as suicide and divorce are observed consequences of such dynamics.
5.2.5 Security
Humans can be said to live in a state of security when they do not suffer abrupt threats to their well-being. Chapter 6 indicates that people within the geographical region of a threat are differently susceptible to its negative effects. Those who are poor, sick, or malnourished generally have fewer assets and coping strategies and are more likely to be more severely affected.
>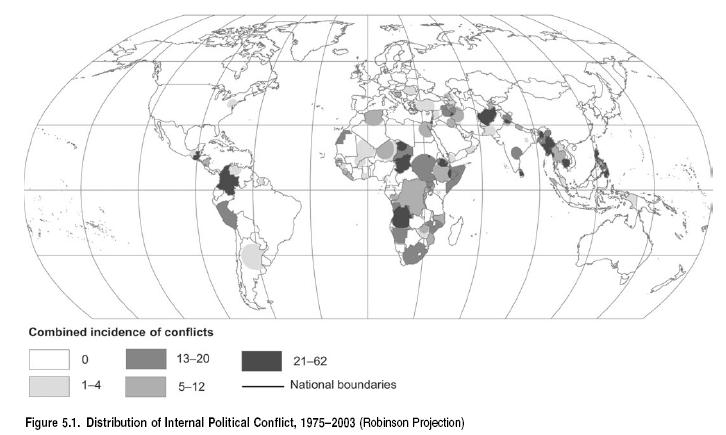
Some of the most salient threats are organized violence, economic crises, and natural disasters. Comparable measures of organized violence are available for international warfare and civil war, but generally not for banditry and other forms of crime. One prominent collection of data on war is the Uppsala conflict database, which attempts to document all political conflicts resulting in 25 or more deaths for the period 1946–2003 (Gleditsch et al. 2002). It provides measures of the frequency of war as well as estimates of the magnitude of war, and rough information on geographical extent. Political violence is not evenly distributed across the world; it is especially concentrated in the poor countries of the world, though not all poor countries experience violence and not all violence takes place among the poor. Figure 5.1, showing the distribution of political conflict, maps the combined incidence of low-intensity (25 deaths or fewer), middle-intensity, and high-intensity (1,000 deaths or more) conflicts for the period 1975– 2003. If a region had all three types of conflicts during each ofthese 29 years, it would have a value of 87; the observed range is 0–62.
Economic crises—hyperinflation, depressions, exchange-rate shocks, and so on—are well measured by international financial institutions such as the International Monetary Fund, the World Bank, and various regional and national financial authorities. Yet the direct impact of such shocks on ecosystems have not been studied or documented adequately.
Natural disasters are not measured well, though various international organizations and research centers are seeking to improve measurement (Guha-Sapir and Below 2002). The most glaring deficiency in efforts to measure natural disasters is in the area of human impacts. Although some insurance companies undertake considerable efforts to quantify insured economic losses due to natural disasters, many of the grossest effects on human well-being are not insured economic losses, but rather loss of life and shelter in poor communities. (Further information on natural disasters can be found in Chapters 6 and 16.)
5.2.6 Aggregations
A wide variety of efforts to aggregate the multiple dimensions of human well-being have been attempted, the most prominent of which is the Human Development Index. The HDI is endorsed by the intergovernmental community through the U.N. General Assembly and widely used in policy assessments and the scholarly literature. A large number of countries now calculate their own HDIs, typically reporting at sub-national levels. (Other aggregations enjoy less support and are used less widely; see [[Chapter 2 (Ecosystems and Human Well-Being: Volume 1: Current State and Trends: Ecosystem Change and Human Wellbeing)]2].) The HDI aggregates measures of economic well-being (per capita income), health (life expectancy), and education (literacy and enrollment). It does not take into account cultural or social aspects of well-being, and it considers security dimensions only insofar as they are reflected in economic and health outcomes. It is not meant to be an all-encompassing measure of well-being but rather a useful indicator of development consistent with the development-as- freedom approach pioneered by Sen (1999).
It is acknowledged that human well-being is not equally distributed among different social groups, including among men and women. In response, the U.N. Development Programme in 1995 began calculating the Gender-related Development Index (Prescott- Allen 2001).
Beyond measuring current well-being, there is the important question of sustaining well-being in the future. Asset accounting (an outgrowth of ‘‘green’’ national accounting) provides the necessary framework for assessing sustainability. As Hamilton and Clemens (1999) and Dasgupta and Ma¨ler (2000) show, the change in real wealth—genuine savings—is equal to the change in the discounted future flows of well-being measured in dollars. The World Bank publishes figures on ‘‘adjusted net saving’’ that account for depreciation of assets; investment in human capital; depletion of minerals, energy and forests; and selected pollution damages (World Bank 2004). While ecosystem services are not directly valued in the published figures, the framework is robust enough to incorporate the economic value of the degradation of ecosystem ‘‘assets’’ where these values have been estimated.
5.3 Patterns and Trends in the Distribution of Human Well-being
5.3.1 Global Trends
In the aggregate, human well-being has improved dramatically since the advent of agriculture first made possible the accumulation of wealth. Incomes have risen, life expectancy has gone up, food supplies have risen, culture has become enriched, and political institutions have become more participatory. Two exceptions to this generalization have been the trends in warfare and hunger. Battle deaths (both combatant and civilian) peaked in the middle of the twentieth century, as a consequence of the intensity of the two world wars. Since 1945 they have declined. The second exception is the number of hungry people, which is now increasing. Although the size of world population is not a direct measure of well-being, it constitutes a fundamental background measure and is therefore included in this summary.
Of these trends, population (Population growth rate) growth shows clear signs of leveling off. (See Chapter 3.) Per capita incomes, life expectancy, and democratization do not yet show signs of leveling off, although they have increased historically at different rates. The absolute number of hungry people began to rise in 1995/97 (FAO 2003), as described in Chapter 8. Warfare patterns are not stable enough to identify clear trends, although the past 50 years have been comparatively peaceful in historical terms. Cultural trends are not susceptible to simple generalizations. Some observers have argued that the global reach of a relatively homogenous mass media threatens local cultural institutions, while others have argued that knowledge of cultural traditions has been able to spread globally; placing values on recent changes such as these is difficult.
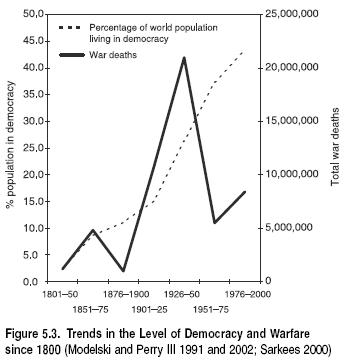
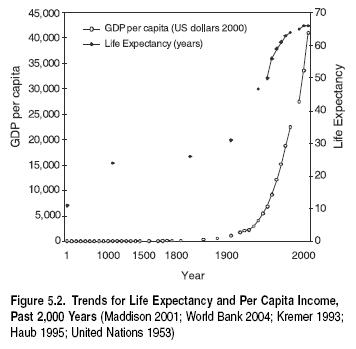
Many dimensions of human well-being that can be measured on a large scale, then, have increased considerably over the past 10 centuries and in the aggregate shows signs of continued expansion. Figure 5.2 shows estimates of human life expectancy and per capita income over the past 2,000 years, demonstrating the enormous improvements in basic material aspects of well-being over this long time frame. Figure 5.3 shows trends in the level of democracy and warfare since 1800 in 25-year increments; signs of progress are also visible in these more social dimensions of wellbeing. As Modelski and Perry (2002) demonstrate, the percentage of the world’s population living under democratic institutions has increased steadily for several centuries and crossed the 50% mark in the 1990s. War deaths are lower today than they were in the first half of the twentieth century, but not low in longer historical comparison.
5.3.2 Distributional Patterns
Human well-being is not evenly distributed across individuals, social groups, or nations. Inequality across national boundaries is high by historical standards. Prior to the industrial revolution in the nineteenth century, national differences in economic output per capita were relatively low; as countries and regions accelerated at different rates of industrialization, they generated dramatic differences in economic growth rates (Maddison 2001; Baudrillard 1998). Cross-national income inequality has increased over the past decade (World Bank 2003). National inequality is apparent in other measures of well-being as well. A child born in sub- Saharan Africa is 20 times more likely to die before age five than a child born in an OECD country, and this ratio is higher than it was a decade ago.
At the individual level, the gap between the world’s poorest and the world’s richest individuals has increased over the past two decades, though whether this signifies a general increase in inequality among the world’s population is the subject of debate (UNDP 2003).
Recent increases in human well-being have been most pronounced in East Asia, where income-poverty levels have been reduced by approximately half since 1990. However, there have been systematic decreases in human well-being in many countries over the last decade. Although differences in growth rates are common, absolute declines in well-being on this scale have been rare. During the 1980s only four countries experienced declines in their rankings in the Human Development Index; during the 1990s, 21 countries registered declines, 14 of which were in sub- Saharan Africa (UNDP 2003). Hundreds of millions of people are living in countries with economic growth rates too low to permit significant poverty reductions (UN Millennium Project 2004).
The overall global pattern of human well-being, therefore, is one in which aggregate levels are continuing to increase at historical rates, although a large number of individuals appear to be stuck at very low levels of well-being.
5.3.3 Spatial Patterns
Human well-being is not evenly distributed with respect to the world’s ecosystems. At a global level, there are a limited number of measures of human well-being available through which to assess patterns across ecosystem boundaries. Population totals and densities, infant mortality rates, GDP, and GDP per capita can be calculated using spatial data derived from sub-national sources.
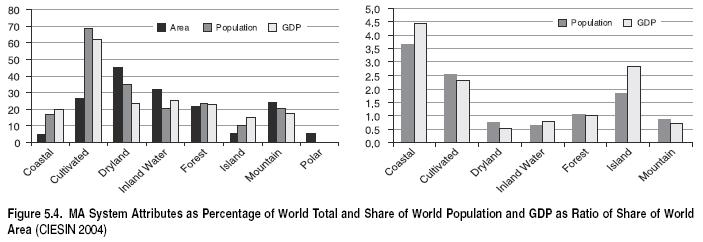
The primary indicators for the MA systems and subsystems are reported in Tables 5.1 to 5.4 and shown graphically in Figure 5.4. (These aggregations do not take into account the urban system; a separate set of aggregations is reported in Chapter 27.) Of these indicators, infant mortality is the most spatially representative measure of human well-being because it is available for most countries at a sub-national level. The global distribution of infant mortality rates is provided in Figure 5.5 (in Appendix A).
|
Table 5.1. Human Well-being Indicators, by MA System System GDP (billion dollars) Infant Mortality Rate (deaths per thousand live births) Area (million sq. km.) Population (billion) Population Density (people per sq. km.) Coastal 9,148 41.5 6.0 1.0 169.7 Cultivated 27,941 54.3 35.3 4.1 116.2 Drylands 10,395 66.6 59.9 2.1 35.2 Forest 11,406 57.7 41.9 1.2 28.4 Inland Water 10,215 57.6 29.1 1.4 48.1 Island 7,029 30.4 7.1 0.6 85.5 Mountain 7,890 57.9 31.9 1.2 38.2 Polar (Arctic) 96 12.8 8.1 0.0 0.7 Table 5.2. Population Growth within MA Systems, 1990–2000 System Change in Population (million) Net Change in Population (percent) Change in Population per Square Kilometer Cultivated 505.7 14.1 14.3 Dryland 329.6 18.5 5.5 Inland Water 203.5 17.0 7.0 Mountain 171.0 16.3 5.4 Forest 142.1 13.5 3.4 Coastal 140.3 15.9 23.3 Island 67.0 12.3 9.5 Polar -117.9 -6.5 0.0 Table 5.3. Distribution of Dryland Population Growth, 1990–2000 Region Increase in Dryland Population (million) Share of World Population Increase (percent) Asia 180 54.5 Former Soviet Union 5 1.4 Latin America 21 6.4 Northern Africa 65 19.6 OECD 10 3.2 Sub-Saharan Africa 49 14.9 World 330 100.0 At the broadest level of generalization, it is clear that infant mortality rates are highest within drylands and that most of the world’s population and GDP is located within cultivated systems. One way to assess well-being across ecosystems more precisely is to compare the fraction of the world’s population found within each ecosystem to the fraction of the world’s GDP within each ecosystem. If well-being were distributed randomly with respect to ecosystem boundaries, these two numbers would be approximately equal in each ecosystem. Where the ratio of population fraction to GDP fraction is much higher than one, people are less well off in relative terms; where it is much lower than one, people are better off. As seen in Figure 5.6, this ratio varies considerably across the MA systems, and this variation is correlated with differences in measured infant mortality rates. The drylands emerge as clearly an ecosystem characterized by low levels of human well-being. (See Box 5.1.) In each region, the dryland ecosystem shows higher infant mortality rates than the forest ecosystems (Ecosystems and Human Well-Being: Volume 1: Current State and Trends: Ecosystem Change and Human Wellbeing) , though the ratio of the two varies across regions. The ratio is highest in the former Soviet Union and lowest in Latin America. (See Table 5.5.) |
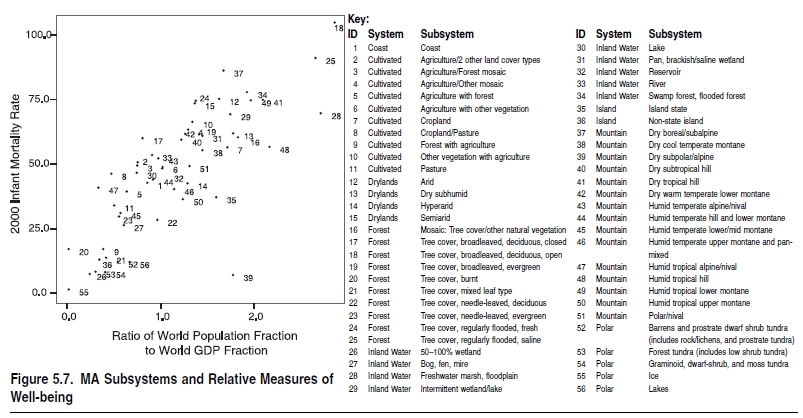
The same comparisons can be performed for the MA subsystems. The results reveal even greater variation in patterns of human well-being than at the system level. As Figure 5.7 shows, infant mortality ranges from over 100 to under 10 in the MA subsystems, and some subsystems have a share of the world’s population that is almost three times as large as their share of the world’s GDP. At this level of resolution, the drylands do not emerge as clearly disadvantaged as they do in the system comparison. This is likely to be because the 56 MA subsystems are not distributed as evenly across geopolitical regions as the systems are, and therefore the strong effects of these geopolitical regions become more prominent in the subsystem analysis. For example, the MA subsystem with the highest infant mortality rate and the highest ratio of world population fraction to world GDP fraction is a forest subsystem: broadleaf, deciduous, open tree cover. Three quarters of this subsystem type are found within sub-Saharan Africa, where poverty rates in general are quite high, irrespective of ecosystem type.
|
Table 5.4. Human Well-being Indicators, by MA Subsystems. GDP and infant mortality rate estimates were not calculated for polar subsystems due to lack of appropriate resolution data. MA System Subsystem Area (thousand sq. km.) Population (million) Population Density (people/ sq. km.) GDP (bill. 2000 dollars) GDP Per Capita (2000 dollars) Infant Mortality Rate (deaths per thousand live births) Coastal coastal 6,020 1,022 170 9,148 8,956 41.5 Cultivated agriculture/ two other land cover types 630 91 145 932 10,202 49.6 agriculture/forest mosaic 4,459 294 66 3,017 10,272 48.2 agriculture/other mosaic 5,922 508 86 3,001 5,903 62.2 agriculture with forest 2,170 247 114 3,003 12,154 38.2 agriculture with other vegetation 2,884 288 100 2,160 7,492 47.7 cropland 8,270 3,013 243 8,924 4,433 55.3 cropland/pasture 2,612 152 58 2,515 16,528 45.1 forest with agriculture 1,601 97 61 1,969 20,235 15.9 other vegetation with agriculture 6,659 405 61 2,299 5,677 65.2 pasture 108 7.6 70 120 15,790 32.8 Dryland dry subhumid 12,689 910 72 3,886 4,271 60.7 semiarid 22,270 855 38 4,773 5,580 72.4 arid 15,325 243 16 1,135 4,677 74.2 hyper-arid 9,635 101 11 601 5,928 41.3 Forest mosaic: tree cover/ other natural vegetation 2,409 53 22 217 4,137 59.3 tree cover, broadleaved, deciduous, closed 6,526 348 53 3,312 9,503 58.9 tree cover, broadleaved, deciduous, open 3,776 88 23 232 2,645 103.7 tree cover, broadleaved, evergreen 12,210 266 22 1,436 5,394 60.3 tree cover, burnt 298 0.3 1.0 2.4 8,238 15.9 tree cover, mixed leaf type 3,182 51 16 953 18,843 12.4 tree cover, needle-leaved, deciduous 3,804 3.5 0.9 28 8,127 27.2 tree cover, needle-leaved, evergreen 9,032 370 41 5,184 14,013 28.5 tree cover, regularly flooded, fresh 562 3.6 6.3 20 5,531 73.4 tree cover, regularly flooded, saline (daily variation) 89 7.9 89 22 2,794 90.0 Inland Water 50–100% wetland 2,157 13 6.3 454 33,623 6.1 bog, fen, mire 2,305 7.4 3.2 98 13,243 25.1 freshwater marsh, floodplain 4,606 403 87 1,123 2,789 68.5 intermittent wetland/lake 4,946 128 26 558 4,355 68.2 lake 9,538 522 55 5,390 10,329 45.5 pan, brackish/saline wetland 619 11 18 59 5,279 59.8 reservoir 649 37 57 278 7,504 47.1 river 2,382 258 108 2,174 8,426 52.3 swamp forest, flooded forest 1,902 21 11 82 3,993 76.7 Island island state 3,949 375 95 1,787 4,767 36.0 non-island state 3,125 230 74 5,242 22,794 11.8 Mountain dry boreal/subalpine 997 10 10 46 4,436 85.2 dry cool temperate montane 2,936 145 49 761 5,259 54.2 dry subpolar/alpine 315 1.2 3.7 5.1 4,347 5.8 dry subtropical hill 2,078 47 23 292 6,246 58.3 dry tropical hill 467 16 33 56 3,595 73.8 dry warm temperate lower montane 1,364 45 33 272 6,034 60.5 humid temperate alpine/nival 1,605 4.4 2.8 33 7,381 51.1 humid temperate hill and lower montane 3,888 373 96 3,101 8,321 42.8 humid temperate lower/ mid-montane 1,591 91 57 1,232 13,512 29.8 humid temperate upper montane and pan-mixed 5,143 54 10 357 6,659 39.1 humid tropical alpine/nival 151 1.3 8.8 28 21,093 39.7 humid tropical hill 942 57 60 198 3,487 55.4 humid tropical lower montane 5,673 348 61 1,344 3,858 73.3 humid tropical upper montane 212 16 74 99 6,253 35.1 polar/nival 4,574 11 2.5 66 5,723 48.1 Polar barrens and prostrate dwarf shrub tundra (includes rock/lichens and prostrate tundra) 2,628 0.5 0.2 8.5 18,805 10.9 forest tundra (includes low shrub tundra) 1,435 0.7 0.5 16 22,537 7.0 graminoid, dwarf-shrub, and moss tundra 3,356 1.0 0.3 23 22,017 6.8 ice 444 0.0 0.0 1.2 0.2 lakes 595 4.0 6.7 48 12,019 10.7 BOX 5.1 Drylands and Human Well-being Dryland ecosystems are characterized by extreme rainfall (Ecosystems and Human Well-Being: Volume 1: Current State and Trends: Ecosystem Change and Human Wellbeing) variability, recurrent but unpredictable droughts, high temperatures, low soil fertility, high salinity, grazing pressure, and fires. They reflect and absorb solar radiation, maintain balance in the functioning of the atmosphere, and sustain biomass and biodiversity. (This section is derived from World Bank 2003.) |
Of the 500 million rural people who live on arid and dry semiarid land (see Table), most live in Asia and Africa, but there are also large pockets in Mexico and Northeastern Brazil. The low volume and extreme variability of precipitation limit the productive potential of this land for settled farming and nomadic pastoralism. Many ways of expanding agricultural production in the drylands—shifting cultivation from other areas, reducing fallow periods, switching farming practices, overgrazing pasture areas, cutting trees for fuelwood—result in greater environmental degradation.

The Southern Plains of North America, Africa’s Sahel, and the inner Asian grasslands face similar climatic and soil characteristics but different political, financial, and institutional constraints. The result is differing patterns of resource management, with different impacts on human well-being.
The Southern Plains of North America
The European settlers in the Great Plains converted prime grazing land into intensive agricultural uses (monocropping, usually wheat). This pattern was badly suited to the lighter soils of the Southern Plains. Deep plowing dislodged soils, and monocropping mined soil nutrients. Large-scale farming in the 1920s pushed the expansion of wheat cultivation further onto native grasslands. By the next decade overgrazing, overplowing, and monocropping were exacerbated by the worst drought in U.S. history. An area of about 50 million hectares was affected each year in the Dust Bowl of the 1930s. (This section is based on Worster 1979.)
The response to the Dust Bowl included zoning laws for the most fragile areas, repurchases of submarginal private land, cash payments for leaving land fallow, and farm loans tied to approved land practices. In addition, there was planting of shelterbelts, adoption of soil and water conservation techniques such as the introduction of contour plowing, small dam and pond construction, mixed cropping, replanting of grasses, and state and federal protection of the remaining open grasslands.
Beginning in 1940, normal rainfall patterns resumed, while outmigration reduced the farm population and increased farm sizes (about 1 million people left the area between 1930 and 1970). But in the 1950s Dust Bowl II hit, followed in the 1970s by Dust Bowl III. Conservation practices had helped, but to achieve reliable production the United States needed to achieve a ‘‘climate-free’’ agriculture on the plains. In response, a striking feature has been the reliance on fossil fuel–intensive agricultural production with deep pumping of underground aquifers (up to 600 feet), and heavy reliance on chemical fertilizers and mechanization. In the Texas High Plains Region, irrigated land area shrunk by 34% between 1974 and 1989 because the cost of overpumping the Ogallala aquifer exceeds the value of crops grown there. This vast aquifer is now being pumped faster than replenishment rates, with a net depletion rate of 3.62 million acre- feet (4.5 billion cubic meters) a year (Postel 1993).
The African Sahel
Throughout much of Africa the plowing and monocropping on fragile soils adopted in colonial times continued after independence (Swearingen and Bencherifa 1996). Inappropriate land use can rapidly lower soil quality, and intensive cultivation can deplete soil nutrients. Deforestation can cause erosion, washing away the layers of soil most suitable for farming. Two patterns are typical in Africa (note, however, that population (Population growth rate) growth in low density areas can be positive for resource management; see Tiffen et al. 1994):
- Growing populations convert high quality pastureland to grow cash crops. Herders lose the better grazing land, their security against drought. Migratory movements for herders are reduced, lower-quality land is more intensively grazed, and overgrazing leads to degradation.
- Poor subsistence farmers reduce fallow periods in order to grow more food to feed growing families. The reduction in fallow increases vulnerability to drought and without sufficient inputs, depletes soil nutrients. Degradation and soil erosion get worse.
In the Sahel, favorable rainfall from the 1950s to the mid-1960s attracted more people to the region. However, rainfall reverted to normal low levels after 1970, and by the mid-1970s many people and their livestock had died. The possibility that the Sahel could enter another period of favorable rainfall poses the risk of repeating the same tragedy as poor people are drawn back to the land. The Intergovernmental Panel on Climate Change (Intergovernmental Panel on Climate Change (IPCC)) (IPCC 2002) reports that Africa is highly vulnerable to climate change. Although the equatorial region and coastal areas are humid, the rest of the continent is dry subhumid to arid. Global warming scenarios suggest that soil moisture and runoff will be reduced in subhumid zones. Already, water storage has been reduced to critical levels in some lakes and major dams, with adverse repercussions for industrial activity and agricultural irrigation.
The poor quality of soils in the Sahel is another constraining environmental factor. Phosphorus deficiency, low organic content, and low water infiltration and retention capacity on much of African soil have been limiting factors in agriculture. Unlike climate variability, this problem can be addressed: soil quality can be augmented through careful management and soil nutrient supplementation. More difficult to address are the recurrent droughts.
The Asian Drylands
Population pressure on arable land in Asia is considerable and growing. Severe land degradation affects some 35% of productive land. The result has been to put more population pressure on the Inner Asian drylands. Most affected are Afghanistan, China, India, and Pakistan (FAO et al. 1994; ESCAP 1993), as well as Inner Asia’s high steppe, the largest remaining pastureland in the world, which includes Mongolia, northwestern China, and parts of Siberia. Over thousands of years, these grasslands have been home to nomadic herders of horses, camels, goats, sheep, and cattle who practice elaborate systems of seasonal pasture rotation across wide stretches of land in response to climate fluctuations. Herd rotation has helped sustain the fertility and resilience of grassland ecosystems and improve the health of livestock (Ojima 2001).
Over the past decade, population pressures and competing uses on these fragile lands have made it hard to find the right balance between the grasslands through irrigation from underground aquifers. The objective traditional land management and demand for higher agricultural productivity. Government policies that discouraged a nomadic lifestyle, herd movement, and temporary use of patchy grasses led to dependence on agricultural livelihoods and sedentary herds, which created greater pressure on local ecosystems and degraded fragile grasslands. The contrasting experiences of Mongolia and northwestern China illustrate some of the problems.
Mongolia has retained many traditional herding customs and customary tenure with land management as a commons. (This section is drawn from WRI 2000 and from Mearns 2001, 2002.) Herders rely on local breeds (which are stronger and more resilient) that graze year-round on native grasses. These customary practices were effectively supported by collective agriculture between the 1950s and 1980s. Policies allowed people and herds to move over large areas and provided the possibility of sustainable grasslands management under controlled-access conditions.
The economic transition since 1990 has not been conducive to sustainable management. Livestock mobility declined significantly. Many public enterprises closed. Having few alternatives, people turned to herding—often for the first time. The numbers of herders more than doubled from 400,000 in 1989 (17% of Mongolia’s population) to 800,000 in the mid-1990s (representing 35%). Poverty also increased to 36% of the population by 1995 from a very low base in the 1980s. Herd size grew from the traditional 25 million head to about 30 million. Today, an estimated 10% of pastureland is believed to be degraded, causing noticeable increases in the frequency and intensity of dust storms.
This problem is considered manageable in Mongolia because population pressures are not very high. Rural population (Population growth rate) increased by about 50% from 1950 to 2000 (compared with a 700% increase in neighboring northwestern China).
As in Mongolia, the grasslands in China are state-owned. (This section is drawn from Mearns 2001, 2002.) But settled pastoralism and the conversion of grasslands to arable cultivation were more common in northwestern China than in Mongolia, beginning in the 1950s, when state-owned pastureland was allocated to ‘‘people’s communes.’’ The concentration of people in villages meant declining pasture rotation and expanding agriculture. Policies encouraged conversion of prime pasturelands into arable cropland, leading to salinization and wind erosion in some areas.
Common policies were applied to highly diverse circumstances, resulting in perverse outcomes and higher degradation in some places. Subsidies encouraged mixed farming systems, which put more pressure on fragile land than the traditional mobile pastoralism. Economic reforms in the early 1990s granted households nominal shares in the collective land pool. Shared areas were fenced off, making herd mobility more difficult. Subsidized inputs, income transfers, and deep pumping of underground aquifers encouraged a rapid increase in farming. From an estimated 3 million indigenous pastoralists in the 1950s in the Inner Mongolian part of northwestern China, farmers and livestock producers today number 20 million, and cattle doubled from 17 million head in 1957 to 32 million today.
China’s western development plan shares two characteristics with the policies followed in the Southern Plains of the United States: intensification of agricultural production and creation of ‘‘climate-free’’ agriculture in is to make the area a bread-and-meat basket to meet China’s growing demands for protein-rich diets. But unlike the Southern Plains—where about 1 million farmers left between the 1930s and the 1970s, enabling reconsolidation of landholdings and conversion of vast grassland areas to protected areas—population pressures have continued to increase in China’s grasslands. Poverty rates in these degraded and ecologically sensitive areas are well above the national average (25% in some provinces, compared with the national average of 6.3%). The frequency and intensity of dust storms are increasing. Estimates of areas degraded are 50–75%, compared with 10–15% in the grasslands of Mongolia.
Improving Prospects for Well-being in the Drylands
Agricultural research in China and India shows diminishing returns to investments in many high-potential areas, but investments in drylands can produce large returns in reducing poverty, even if yields are modest (Hazell 1998; Hazell and Fan 2000; Fan et al. 2000; Wood et al. 1999). Governments, researchers, and donor organizations are beginning to pay some attention to research and development on crop breeding varieties for people on marginal lands, but much more needs to be done by the public sector to replace antiquated crop varieties (UNEP 1992, 1997). In partnership with South African institutions, the International Maize and Wheat Improvement Center (a research center of the Consultative Group on International Agricultural Research) has developed two maize varieties for small farmers in South Africa’s drought-prone, acidic, nutrient-depleted [[soil]s]. Both varieties are drought-resistant, and one matures early, when farm food supplies are at their lowest. Trials from Ethiopia to South Africa have shown yields that are 34–50% higher than currently grown varieties (Ter-Minassian 1997; Rodden et al. 2002; Bardham and Mookherjee 2000). There are opportunities to achieve sustainable livelihoods in quite a few areas. But development decision-makers must recognize that the drylands are not homogeneous and cannot be made to function sustainably as non-drylands.
Some arid areas can take advantage of solar energy potential; others may have scenic value worthy of ecotourism development. The Mozambique Transfrontier Conservation Area Program and Burkina Faso’s wildlife reserve development are two attempts in the direction of ecotourism that combine local and international cooperation. Research and innovations for appropriate service delivery—combined with policies that link human activities (farming, herding, and settlements) with natural processes (vegetation distribution, seasonal growing cycles, and watersheds)—can help sustain vulnerable dryland ecosystems while enhancing productivity to support growing populations |}
|
Table 5.5. Ratio of Infant Mortality Rate in Drylands to Rate in Forests, by Region Region IMR in Dryland/IMR in Forests (ratio) Asia 1.6 Former Soviet Union 2.6 Latin America 1.0 Northern Africa 1.2 OECD 1.4 Sub-Saharan Africa 1. It must be emphasized that none of these generalizations implies anything about causality. If infant mortality is high within a particular ecosystem, this does not mean that the ecosystem explains the high infant mortality. Rather, it indicates that the ecosystem is home to populations experiencing comparatively low levels of well-being and that these populations are therefore, other things being equal, potentially vulnerable to declines in ecosystem services (Ecosystems and Human Well-Being: Volume 1: Current State and Trends: Ecosystem Change and Human Wellbeing) . |
If the geopolitical regions are brought into the analysis explicitly, additional detail can be seen. Figure 5.8 (in Appendix A) shows that the differences across geopolitical regions are by and large more significant than the differences across ecosystem boundaries. Sub-Saharan Africa is less well off within each ecosystem than all other world regions, for example. There is also significant deviation from global averages within Asia: the Asian cultivated system contains 44% of the world’s population, for example, but only 20% of the world’s GDP.
By looking simultaneously at world geopolitical regions and the MA subsystems, the world is divided into 274 overlapping units. The basic patterns are seen in Figure 5.9 (in Appendix A). Well-being disparities across ecosystem types are lowest in the OECD countries and highest in Asia and sub-Saharan Africa. The very low variation within the OECD countries probably reflects the fact that high incomes and advanced infrastructures eliminate the kind of gross sensitivity to ecosystem effects that would influence infant mortality. This figure also shows the fundamentally different situation that sub-Saharan Africa is in with respect to well-being patterns. Almost all of its IMR values are higher than those found in any other region. Significant exceptions are the Asian dry boreal/subalpine subsystem and the Asian arid subsystem, where IMR values are much higher than the Asian average and well within the sub-Saharan African range.
5.3.4 Temporal Patterns
Most global socioeconomic indicators that are available in spatially disaggregated (sub-national) formats are not available in time series, and therefore it is difficult to say much about broad trends within the MA system boundaries. The exception to this generalization is population. Because most countries carried out censuses both around 1990 and around 2000, and since these have been geo-referenced and integrated into a consistent grid, it is possible to estimate changes over the 1990–2000 period within the MA systems, as in Table 5.2.
Considering the global MA systems, the fastest growth rate during the 1990s occurred in the drylands, where population increased by 18.5%. The MA system with the greatest increase in total population is the cultivated system, where population increased by 506 million. If population growth is divided by land area, the highest value is observed in the [[coastal] zone], where over the 1990s population grew by 23.3 people per square kilometer.
The fact that the highest growth rates are in an especially vulnerable ecosystem is significant. As the World Bank (2003) has pointed out, historically populations have migrated out of marginal lands to cities or to agriculturally productive regions; today the opportunities for such migration are limited due to poor economic growth in many African cities and much tighter immigration restrictions in wealthy countries.
Table 5.3 showed how the increased population in the drylands is distributed across world regions. More than half the people are located in Asia, but significant portions are also in Africa.
5.4 Sensitivity to Ecosystem Change
This section briefly reviews the state of knowledge about the degree to which the various dimensions of human well-being are sensitive to ecosystem change. In assessing the level of sensitivity, several issues arise that make an isolated understanding of the exact effect of a change in ecosystems on human well-being difficult. The affects of appropriating an ecosystem service today may have a different effect in the future on the appropriating social group. For example, the consumption of water today for irrigation will raise current crop productivity for the consuming population, but the impact on the future population is unknown, and so the net effect cannot be determined. Another difficulty in isolating the human well-being impact of ecosystem change is the distribution of ecosystem services. These may be derived from one geographical location but consumed in another one. Devising the net impact needs to take into account the costs and benefits to groups in all affected geographical locations.
5.4.1 Basic Material for a Good Life
The assessment of changes in the ecosystems on access to the basic needs for a good life has been one of the two dimensions of human well-being that has been most thoroughly investigated, and there are numerous well-documented examples demonstrating that declining ecosystem services are capable of having serious negative consequences on incomes, food security, and water availability. Some studies have also suggested that the decline and in some cases even the collapses of several ancient civilizations— including the Mesopotamians, the ancient Greeks, the Mayans, the Maori, and the Rapanui of Easter Island—were associated with the overexploitation of biological resources (Deevey et al. 1979; Flenley and King 1984; van Andel et al. 1990; Ponting 1991; Flannery 1994; Diamond 1997; Redman 1999).
Economic theory shows clearly how continued improvements in income depend on growing levels of assets to be sustainable. If assets, or wealth, do not grow, incomes will eventually fall (Sachs et al. 2004). Some economists have attempted to quantify the natural resource components to assets, including such resource stocks as forests and minerals (Repetto et al. 1989; Vincent et al. 1997; Lange et al. 2003), and have sought to estimate the net social benefits of habitat conversion, taking into account both the narrow economic gains associated with conversion and the decline of broader social benefits. These studies support the generalization that private gains achieved by conversion are typically outweighed by the loss of public benefits, so that in overall societal terms, conversion of remaining intact habitat rarely makes net economic sense (Balmford 2002; Turner et al. 2003). For example, the early 1990s collapse of the Newfoundland cod fishery has cost tens of thousands of jobs, as well as at least $2 billion in income support and retraining (Beaudin 2001).
Recent reviews of such dynamics have concluded that many countries appear to be experiencing declines in net per capita assets when such resource components are taken into account (Dasgupta and Ma¨ler 2004; Hamilton and Clements 1999). (See Box 5.2.) These findings suggest that some of the declines in wellbeing in sub-Saharan Africa may be in part attributable to declines in natural resource assets, and that other regions currently experiencing increases in well-being may be doing so at the expense of a declining resource base, which will create problems in the future.
| BOX 5.2 Economic Values Associated with Ecosystem Services | |||||
|
Many ecosystem services, such as the purification of water, regulation of floods, or provision of esthetic benefits, do not pass through markets. The benefits they provide to society, therefore, are largely unrecorded: only a portion of the total benefits provided by an ecosystem make their way into statistics, and many of these are misattributed (the water regulation benefits of wetlands, for example, do not appear as benefits of wetlands but as higher profits in water-using sectors). Moreover, for ecosystem services that do not pass through markets there is often insufficient incentive for individuals to invest in their maintenance (although in some cases common property management systems provide such incentives). Typically, even if individuals are aware of the services provided by an ecosystem, they are neither compensated for providing these services nor penalized for reducing them. |
Nonmarketed ecosystem services do have economic value, and a number of techniques can be used to measure the economic benefits of value of the services and the costs of their degradation. (See [[Chapter 2 (Ecosystems and Human Well-Being: Volume 1: Current State and Trends: Ecosystem Change and Human Wellbeing)]3].) A growing literature exists concerning measurements of the value of the nonmarketed ecosystem services, in order to provide better estimates of the total economic value of ecosystems (Pearce and Warford 1993). Some of the methods used to value nonmarketed services are still controversial, and in some cases estimates of the same services may differ by as much as several orders of magnitude. Moreover, even in the cases where the economic valuation methods are well established, the physical and ecological information necessary to value marginal changes in ecosystems may not be available. (For example, the calculation of the marginal cost of deforestation in terms of reduced water services requires accurate information on the relationship between forest cover loss and change in the timing and magnitude of river flows, and that biophysical information may not be available.)
Despite these challenges, even imperfect estimates of the economic costs and benefits of changes in ecosystem services can be useful for decision-making. Well-designed valuation studies tell us not only how much ecosystem services are worth, but inform resource management decisions with information about the economic benefits of alternative management options. Moreover, valuation studies help to identify who benefits from different ecosystem services and how various factors, including institutional ones, influence values. Information on beneficiaries and their willingness-to-pay under different institutional arrangements can help in the design of payment mechanisms or of mechanisms to turn economic values into actual financial flows.
The marketed portion of ecosystem services is often only a small portion of the total economic value of an ecosystem. In the case of [[forest] ecosystems], for example, marketed services can include some provisioning services, such as timber production, and some cultural services, such as recreation. Even these services are only partially marketed: informal collections of fuelwood and non-timber products such as fruit and mushrooms, for example, are often not marketed (although local systems of rights or management may serve to maintain sustainable harvests). Regulating and supporting services have rarely been marketed, although some markets—such as for carbon sequestration—have recently been established to ameliorate the rate of change in climate services.
Figure A in Appendix A shows the results of one of the few comprehensive efforts to estimate the TEV of ecosystems on a significant scale, in this case forests in selected Mediterranean and nearby countries. Timber and fuelwood generally account for less than a third of estimated TEV, on average, and even this share is likely overestimated as it is easier to measure such provisioning services than other services. Recreation and hunting benefits were imperfectly measured, but in European countries these benefits rival and sometimes exceed timber values. Watershed protection is an important benefit in Italy, Syria, Tunisia, Algeria, and Morocco and would likely have played an important role in several other countries as well had it been possible to better estimate its value. If forests were to be considered only for their timber, as is all too often the case, they would appear much less valuable than they actually are and would tend to be managed only for their extractive uses, such as timber harvest.
The estimated values of individual non-marketed ecosystem services are often substantial but are rarely included in resource management decisions, although incorporation of these values is now beginning to become somewhat more common. For example:
- Recreational benefits of protected areas: The annual recreational the coral reefs of each of six marine protected areas in the Hawaiian Islands in 2003 ranged from $300,000 to $35 million (van Beukering and Cesar 2004).
- Water quality: The net present value in 1998 of protecting water quality in the 360-kilometer Catawba River in the United States for a five-year period was estimated to be $346 million (Kramer and Eisen-Hecht 1999).
- Nursery habitat for fisheries (Fisheries and aquaculture): Deforestation of an 860-square-kilometer mangrove habitat in the state of Campeche, Mexico, at an average rate of 2 square kilometers a year in 1980–90 resulted in a loss in shrimp harvest each year of about 28.8 tons, amounting to a loss of approximately $279,000 in revenue (Barbier and Strand 1998). In contrast, a 1981 study of the marginal value of wetlands on the Gulf Coast of Florida for production of blue crab estimated the present value of only $7.40 per hectare (Lynne et al. 1981).
- Water purification service of wetlands: Approximately half of the total economic value of the Danube River floodplain in 1992—which included values associated with timber, cattle, fisheries, recreation, hunting, and the filtering of nutrients—could be accounted for in its role as a nutrient sink (Gren et al. 1995).
- Native pollinators: A study in Costa Rica found that forest-based pollinators increased coffee yields by 20% within 1 kilometer of forest (as well as increasing the quality of the coffee). During 2000–03, pollination services from two forest fragments (of 46 and 111 hectares) increased the income of a 1,100-hectare farm by $60,000 per year, a value commensurate with expected revenues from competing [[land use]s] (Ricketts et al. 2004).
- Flood control: Muthurajawela Marsh, a 3,100-hectare coastal peat bog in Sri Lanka, provides an estimated $5 million in annual benefits ($1,750 per hectare) through its role in local flood control (Emerton and Bos 2004).
- Open space protection: In an ex-urban area of Maryland in the United States, the marginal economic benefits per household of preserving neighboring open space range from $994 to $3,307 per acre of farmland preserved (Irwin 2002). And in Grand Rapids, Michigan, lots for residential homes that border forest preserves were found to sell at premiums of about $5,800–8,400 during the 1990s (19– 35% of lot price) (Thorsnes 2002).
- Biochemical resources: Estimates of the economic value of species-rich ecosystems (such as neotropical forests) for bioprospecting for new pharmaceutical products range from $20 to $9,000 per hectare, depending on assumptions used in the economic models (Simpson et al. 1996; Rausser and Small 2000).
Relatively few studies have compared the TEV of ecosystems under alternate management regimes. The results of several that attempted to do so are shown in the Table. In each case where the TEV of sustainable management practices was compared to management regimes involving conversion of the ecosystem or unsustainable practices, the benefit of managing the ecosystem more sustainably exceeded that of the converted ecosystem, although the private benefits—that is, the actual monetary benefits captured from the services entering the market—would favor conversion or unsustainable management.
These studies are consistent with the understanding that market failures associated with ecosystem services lead to greater conversion of flow ecosystems than is economically justified. However, this finding would not hold at all locations. For example, the value of conversion of an ecosystem in areas of prime agricultural land or in urban regions often exceeds the total economic value of the intact ecosystem (although even in dense urban areas, the TEV of maintaining some ‘‘greenspace’’ can be greater than development of these sites). Similarly, in a study of the economic benefits of forest protectionn for maintaining water flows as ‘‘drought mitigation’’ for farmers in Eastern Indonesia, Pattanayak and Kramer (2001) found that where increased watershed protection mitigates droughts, the economic benefits can be sizable (as much as 10% of annual agricultural profits), but they found that forest cover did not necessarily increase base for all households in a watershed or in all watersheds.
|-
| valign="bottom" | Ecosystem
| valign="bottom" | Alternatives
Compared
| valign="bottom" | Services Included in TEV Calculations
| valign="bottom" | Private Benefits
| valign="bottom" | Total Economic Value
| valign="bottom" | Source
|-
| colspan="6" | Comparison of benefits of sustainably managed ecosystem to converted ecosystem
|-
| valign="top" | Tropical forest,
Cameroon
| valign="top" | comparison of low-impact
logging to small-scale
farming or conversion to
oil palm and rubber plantation
| valign="top" | benefits from agricultural or plantation
output, sedimentation control,
flood prevention, carbon storage, and
option, bequest and existence values;
10% discount rate over 32 years
| valign="top" | Small-scale agriculture
had greatest private
benefits
| valign="top" | across five study sites, average TEV of
sustainable forestry was approximately
$3,400 per hectare and that of small-scale
farming $2,000 per hectare; across four of
the sites, average TEV of conversion to oil
palm plantation was $-1000 per hectare
| valign="top" | Yaron 2001
|-
| valign="top" | Mangrove,
Thailand
| valign="top" | comparison of existing
uses of mangrove system
to conversion to shrimp
farming
| valign="top" | benefits from shrimp farming, timber,
charcoal, NTFPs, offshore fisheries,
and storm protection. 10% discount
rate over 20 years
| valign="top" | conversion to aquaculture
had greatest
private benefits
| valign="top" | TEV value of intact mangroves was a minimum
of $1,000 and possibly as high as
$36,000 per hectare; TEV of shrimp farming
was about $200 per hectare
| valign="top" | Sathirathai
and Barbier
2001
|-
| valign="top" | Wetland, Canada
| valign="top" | comparison of intact wetlands
to conversion to
intensive farming
| valign="top" | benefits of agriculture, hunting,
angling, trapping; 4% discount rate
over 50 years
| valign="top" | conversion to agriculture
had highest private benefits
(in part due to substantial
drainage subsidies)
| valign="top" | TEV was highest for intact wetlands (average
for three wetland types of approximately
$5,800 per hectare) versus TEV of
converted wetlands of $2,400 per hectare
| valign="top" | Van Vuuren
and Roy
1993
|-
| valign="top" | Tropical forest,
Cambodia
| valign="top" | comparison of traditional
forest uses to benefits
associated with commercial
timber extraction
| valign="top" | examined benefits associated with
swidden agriculture and extraction of
non-timber forest products (including
fuelwood, rattan and bamboo, wildlife,
malva nuts, and medicine) and ecological
and environmental functions
such as watershed, biodiversity, and
carbon storage; 6% discount rate
over 90 years
| valign="top" | private benefits associated
with unsustainable
harvest practices
exceeded private benefits
of NTFP collection
| valign="top" | total benefits were greatest for traditional
uses, ranging from $1,300 to $4,500 per
hectare (environmental services accounted
for $590 per hectare while NTFPs provided
between $700 and $3,900); private benefits
for timber harvest ranged from $400 to
$1,700 per hectare but after accounting for
lost services the total benefits were $150 to
$1,100 per hectare
| valign="top" | Bann 1997
|-
| colspan="6" | Comparison of benefits of establishing protected area to current use
|-
| valign="top" | Coastal habitat,
Jamaica
| valign="top" | comparison of current
management (includes
destructive fishing, loss of
mangroves, pollution) to
establishment of Portland
Bight Protected Area
| valign="top" | benefits of fisheries, forestry, tourism,
carbon sequestration, biodiversity,
costal protection; 10% discount rate
over 25 years
| valign="top" | current overfishing
has resulted in a
decline of profits
effectively to zero
| valign="top" | total incremental benefits of establishment
of protected area estimated to be $53 million
($28 per hectare) in the optimistic
tourism scenario and $41 million ($22 per
hectare) in the pessimistic tourism case;
cost of protected area establishment and
management would total $19 million ($10
per hectare) over the next 25 years, resulting
in net benefits of $11 to $18 per hectare
| valign="top" | Cesar et al.
2000
|-
| valign="top" | Marine
protected areas,
Hawaii
| valign="top" | comparison of net benefits
of protection of six
existing MPAs with the
costs associated with
their protection
| valign="top" | benefits associated with tourism, contribution
to fisheries in adjacent
areas, biodiversity, and amenity values;
discount rate of 3%, period of
25 years
| valign="top" |
| valign="top" | benefits for individual MPAs ranged from
$15 million (Diamond Head) to $84 million
(Hanauma), with management costs for
these two MPAs of $1.1 million and $22
million respectively; the net benefit per
hectare (benefits minus management
costs) ranged from $144,000 (Diamond
Head) to $17 million (Kahalu’u)
| valign="top" | van
Beukering
and Cesar
2004
|-
| colspan="6" |
The economic costs associated with damage to ecosystem services can be substantial:
- The early 1990s collapse of the Newfoundland cod fishery due to overfishing resulted in the loss of tens of thousands of jobs and has cost at least $2 billion (CAN$2.66 billion) in income support and retraining (Commission for Economic Cooperation 2001).
- In 1996, the external cost of U.K. agriculture associated with damage to water (pollution (Water pollution), eutrophication), air (emissions of greenhouse gases), soil (off-site erosion damage, carbon dioxide loss), and biodiversity was $2.6 billion (£1.566 billion at 1996 exchange rates)—9% of average yearly gross farm receipts for the 1990s (Pretty et al. 2000). Similarly, the cost of freshwater eutrophication in England and Wales was estimated to be $105–160 million per year in the 1990s, with an additional $77 million per year being spent to address those damages (Pretty et al. 2003).
- The largely deliberate burning in 1997 of approximately 50,000 square kilometers of Indonesian vegetation (about 60% of the total area burned from 1997 to 1998) affected around 70 million people (Schweithelm and Glover 1999). Some 12 million people required health care; overall economic costs—through lost timber and non-wood forest products, lost agriculture, reduced health, increased CO2 emissions, lost industrial production, and lost tourism revenues—have been conservatively estimated at $4.5 billion (Ruitenbeek 1999; Schweithelm et al. 1999).
- The total damages for the Indian Ocean region over a 20-year time period (with a 10% discount rate) resulting from the long-term impacts of a massive 1998 coral bleaching episode are estimated to be between $608 million (if there is only a slight decrease in tourism-generated income and employment results) and $8 billion (if tourism income and employment and fish productivity drop significantly and reefs cease to function as a protective barrier) (Cesar and Chong 2004).
- The net annual loss of economic value associated with invasive species in the fynbos vegetation of the Cape Floral region of South Africa in 1997 was estimated to be $93.5 million (R455 million), for equivalent to a reduction of the potential economic value without the invasive species of more than 40%. The invasive species have caused losses of biodiversity, water, soil, and scenic beauty, although they also provide some benefits, such as provision of firewood (Turpie and Heydenrych 2000).
Significant investments are often needed to restore or maintain non- marketed ecosystem services. Examples include:
- In South Africa, invasive tree species threaten both native species and water flows by encroaching into natural habitats, with serious impacts for economic growth and human well-being. In response, the South African government established the Working for Water Programme. Between 1995 and 2001 the program invested $131 million (R1.59 billion at 2001 exchange rates) in clearing programs to control invasive species (van Wilgen 2004).
- The state of Louisiana in the United States has put in place a $14-billion wetland restoration plan to protect 10,000 square kilometers of marsh, swamp, and barrier islands in part to reduce storm surgesgenerated by hurricanes (Bourne 2000).
- A plan to restore semi-natural water flows in the Everglades wetlands in the United States in part through the removal of 400 kilometers of dikes and levees is expected to cost $7.8 billion over 20 years (Kloor 2000).
In addition to efforts to measure the value of nonmarketed ecosystem services, recent years have also seen increasing efforts to devise mechanisms to bring these services into the market, thus improving incentives to conserve ecosystems (Pagiola et al. 2002). Examples include:
- Markets for carbon sequestration: Approximately 64 million tons of carbon dioxide equivalent were exchanged through projects from January to May 2004, nearly as much as during all of 2003 (78 million tons) (World Bank 2004). (See Figure B in Appendix A.) The value of carbon trades in 2003 was approximately $300 million. Some 25 percent of the trades (by volume of CO2 equivalents) involve investment in ecosystem services (hydropower or biomass) (World Bank 2004). The World Bank has established a fund with a capital of $33.3 million (as of January 2005) to invest in afforestation and reforestation projects that sequester or conserve carbon in forests and agroecosystems while promoting biodiversity conservation and poverty alleviation. It is speculated that the value of the global carbon emissions trading markets could reach $44 billion in 2010 and involve trades totaling 4.5 billion tons of carbon dioxide or equivalent (http://www.pointcarbon.com/).
- Markets for forest environmental services. In 1997, Costa Rica established a nationwide system of payments for environmental services (Pago de Servicios Ambientales). Under this program, Costa Rica pays land users who conserve forests, thus helping to maintain environmental services such as downstream water flows, biodiversity conservation, carbon sequestration, and scenic beauty. Funds the program come partly from earmarked taxes and partly from environmental service buyers, including the Global Environment Facility (biodiversity), Costa Rica’s Office of Joint Implementation (carbon), and water users such as hydroelectric producers, municipal water utilities, and bottlers (watershed services). By 2001, over 280,000 hectares of forest had been incorporated into the program at a cost of about $30 million, with pending applications covering an additional 800,000 hectares. Typical payments have ranged from $35 to $45 a hectare per year for forest conservation (MA Policy Responses, Box 5.3; Pagiola 2002). Payments under Costa Rica’s program do not reflect the values attached to the services provided so much as the costs associated with their provision. As a result, while this market mechanism provides for the cost-effective imposition of quantitative targets, it is not a typical market in the sense of private parties undertaking voluntary transactions in environmental services. Worldwide, the number of initiatives involving payments for ecosystem services is growing rapidly.
|}
5.4.2 Freedom and Choice
There are some direct connections between ecosystem services and the freedom and choice dimensions of well-being that are partly understood. The declining provision of fuelwood and drinking water as the result of deteriorating ecosystems, for example, has been shown to increase the amount of time needed to collect such basic necessities, which in turn reduces the amount of time available for education, employment, and care of family members. Such impacts are typically thought to be disproportionately experienced by women. However, the empirical foundation for this understanding is limited to a handful of isolated studies (e.g., Awumbila and Momsen 1995); little work based on comparative, cross-national data has been done.
The findings in the literature on common pool or common property resources is that when a resource is abundant relative to demand, there tend to be few rules about its use. If a resource is valuable and limited, however, then common property institutions develop (Ostrom 1990). Such institutions evolve according to the importance of the resource in question, the technology used to exploit it, and various social or political changes in that society. For many kinds of commons, such as forests, water, and grazing lands, resources may be controlled under government regulations, market mechanisms, or community-based institutions that develop among the users themselves. Even with these community institutions, in some cases ecosystem services have declined, although in other cases the development of effective partnerships or of participatory management institutions—with power-sharing between governments, local communities, or corporate resource owners—has reduced the further decline and even brought about improvement of ecosystem services.
In South Africa, for instance, data gathered over decades showed that invasive forestry trees not only threaten native species by encroaching into natural habitats, but also severely reduce stream flows, with serious impacts for economic growth and human well-being (van Wilgen et al. 1998). In response to this evidence, the South African government established its Working for Water Programme. With an annual budget now over $60 million, this simultaneously increases water availability, employs 20,000 skilled and semi-skilled workers, and addresses a major driver of biodiversity change (van Wilgen et al. 2002; Working for Water 2004). Similarly, in Madagascar continued upland deforestation by an estimated 50,000 slash-and-burn farmers has led to increased siltation and reduced water flows to 250,000 downstream rice farmers (Carret and Loyer 2003), and this played an important role in the Malagasy government’s 2003 decision to triple the size of Madagascar’s network of protected forests (J. Carret, personal communication).
5.4.3 Health
Connections between declining ecosystem services and human health are well documented and may be the best understood of the well-being impacts. As shown in Chapter 14, infectious disease impacts are rising as a consequence of land use change such as deforestation, dam construction, road building, agricultural conversion, and urbanization. Such effects can be observed in all regions of the world. The World Health Organization has attempted to quantify the environmental burden of disease through a modeling of the percentage of disability-adjusted life years lost as a consequence of such environmental drivers as unsafe water, air pollution, indoor smoke, and climate change. (See also [[Chapter 2 (Ecosystems and Human Well-Being: Volume 1: Current State and Trends: Ecosystem Change and Human Wellbeing)]4].) Such analysis provides strong evidence that deteriorating water and air quality account for a large percentage of poor health outcomes in many locations, especially in developing countries (WHO 2002 Chapter 4).
The environmental impact on health, according to WHO analysis, is dependent on levels of poverty. Such impacts are highest in poor countries with high mortality rates, where unsafe water and indoor smoke from solid fuel use account for 9–10% of DALYs (WHO 2002:86).
5.4.4 Good Social Relations
There are clear examples of declining ecosystem services disrupting social relations. Indigenous societies whose cultural identities are tied closely to particular habitats or wildlife suffer if habitats are destroyed or wildlife populations decline. Such impacts have been observed in coastal fishing communities (see Chapter 19), in Arctic populations (see Chapter 25), in traditional forest societies, and among pastoral nomads (e.g., Mather 1999; Parkinson 1999). The 95% decline in the Gyps vulture populations of the Indian subcontinent since the mid-1990s (Cunningham et al. 2003) has led to divisions in the Parsi religion about how to dispose of their dead now that the traditional laying out of corpses in Towers of Silence is no longer practicable (Triveldi 2001).
Deterioration in ecosystems can also provide an opportunity for social relations when communities join together to form community-based institutions in response to degraded ecosystem services (Ostrom et al. 2002).
5.4.5 Security
The impact of declining ecosystem services on natural disasters is well understood and well documented, and this is further explored in Chapter 16. Although there has been much speculation about the relationship between ecosystem conditions and political violence (Myers 1994; Homer-Dixon 1999), scholars have been unable to demonstrate causal connections robustly (Gleditsch 1998).
5.5 Multiple Causal Mechanisms Link Ecosystem Change to Human Well-being
The causal connections between ecosystem change and changes in human well-being are not uniform. A variety of mechanisms link the two. This section delineates some distinct mechanisms and illustrates them with specific examples, in order to demonstrate the variety of pathways linking ecosystem change and human well-being. The presentation is not meant to imply that ecosystem changes are linked to human well-being in simple orderly mechanisms. Socioecological systems are dynamic and nonlinear, and their response to stress may not be predictable. They typically combine in complicated ways; yet drivers of behavior may be identified, and behavior may be bounded by political, social, technological, or economic limitations. Decision-making behavior about the use of different ecosystem services needs to consider trade-offs in human well-being.
The benefits and costs of declining ecosystem services are seldom evenly distributed. There are typically winners and losers, and this can lead to an improvement in well-being for one group at the expense of another. If mountain communities convert forests to agricultural lands, for example, that may reduce downstream ecosystem services to low-lying areas in the form of increased siltation and declining water quality. (See Chapter 24.) If wetlands are converted to human settlements in one area of a watershed, other communities in the watershed may experience diminished flood buffering capacities. (See Chapters 16 and 20.) When ecosystem change is linked to well-being change through this mechanism, some groups of people improve and other groups decline.
Another example is the growth of shrimp farming and the consequent damage of such aquaculture on [[mangrove]s]. (See Chapter 19.) Stonich et al. (1997) have shown how, in Honduras, social conflict has increased between shrimp farm concession holders and those who are not concession holders but believe that shrimp farms are intruding on government-reserved natural resources.
The often-cited example of the Aral Sea provides a vivid illustration of how a government policy aimed at improving the national economy can generate large negative impacts on human well-being by focusing on the benefits of a single ecosystem service. Under Soviet rule, the small-scale independent irrigation systems were transformed into unsustainable large-scale collective irrigation systems for cotton production. With the Soviet Union’s attention focused on cotton self-sufficiency, the long-term adverse effects of a rapid, large-scale expansion of inefficient irrigation systems, sole reliance on high-water demanding production systems, poor water distribution and drainage, and non-dose-related uses of fertilizers and pesticides around the Aral Sea were not considered high priority.
During the second half of the 1900s, these inefficient systems decreased water inflow into the sea to a mere trickle, shrunk the size of the sea by half, reduced the water level by 16 meters, and tripled its salinity (Micklin 1993). The government and the cotton producers were the initial winners. The Soviet Union met its need to be self-sufficient in cotton. However, there were many losers who suffered. Thirty-five million people have lost access to the lake for its water, fish, reed beds, and transport functions. The fishing industry around the Aral Sea has collapsed, with fishing ceasing in the 1980s.
More far-reaching environmental and ecological problems, such as dust storms, erosion, and poor water quality for drinking and other purposes have contributed to decreased human health in the area around the Aral Sea. Rates of anemia, tuberculosis, kidney and liver diseases, respiratory infections, allergies, and cancer have increased, and now far exceed the rest of the former Soviet Union and present-day Russia (Ataniyazova et al. 2001). High levels of reproductive pathologies (infertility, miscarriages, and complications during pregnancy and childbirth) have been observed in this region for more than 20 years. The rate of birth abnormalities, another serious consequence of pollution, is also increasing. One in every 20 babies is born with abnormalities, a figure approximately five times the rate in European countries (Ataniyazova et al. 2001; Ataniyazova 2003). (For more information about the Aral Sea and ecosystems, see Chapters 20 and 24.)
China has also witnessed the effects of ecosystem trade-offs, especially in connection with economic development and land use change in the north and west. Excessive collection of fuelwood, blind mining, harvesting of medicinal herbs, construction projects, rising population (Population growth rate)s (Population growth rate), and farming have all contributed to China’s desertification through deforestation, water mismanagement, and overgrazing. Excessive cutting of fuelwood has reduced the sand fixing vegetation (Land-cover) in Qaidam Basin by one third. Illegal cultivation, harvesting, and exploitation have degraded 12 million hectares of rangeland, steppe, and grasslands from 1993 to 1996. The large-scale diversion of water from the upper reach of some rivers has caused the reduction and even the drying off of the water flow in lower reaches. Desertification has silted up rivers, raised riverbeds, and retreated lake surfaces (Asian Regional Network for Desertification Monitoring and Assessment, n.d.).
The spread of desertification in northern China is threatening villages and towns, thousands of kilometers of railway, highway, and irrigation canal, and a large number of reservoirs, dams, and hydraulic power stations due to sandstorms and dune movement. Since the early 1950s, there have been more than 70 heavy sandstorms and dust devils that have caused huge losses. In the sandstorm of May 1993 in northwest China, more than 12 million people were directly affected, 116 people were killed or missing, and more than 120,000 heads of livestock were lost. The direct economic loss was approximately $66 million (Asian Regional Network for Desertification Monitoring and Assessment, n.d.).
Finally, the Chesapeake Bay in the United States provides an example of major deterioration of an ecosystem through urbanization. Land use has changed considerably in the area. The population in the bay’s watershed increased 34% between 1970 and 2000 (Chesapeake Bay Program 2003b), while the number of households grew by 67% (Chesapeake Bay Foundation Report, 2004). The low-density, single-use development pattern was accompanied by infrastructure such as roads, parking lots, and shopping malls, which had a negative impact on water quality. Agriculture also expanded, and nitrogen runoff from agricultural land has been the largest contributor to pollution to the bay (Horton 2003). Chemical runoff from urban centers has also gone up (Chesapeake Bay Program 2003a, 2003b). Increased levels of air pollution have contributed to increased toxic pollution in the Chesapeake Bay.
Nitrogen pollution has depleted the oxygen levels of the waters (Cestti et al. 2003), which has resulted in increased dead zones, leading to a decline in the numbers of fish, crabs, and other aquatic life. The Chesapeake Bay has seen significant reductions in the water quality during the last decade. Declines in species like oysters and underwater grass have also accentuated the bay’s capacity to naturally purify the water. Sustained high levels of pollution may result in groundwater contamination, which is the source of potable water for most people in the region.
The high pollution levels affect both income and health. The Chesapeake has been a major source of seafood, but declines in biodiversity in the bay have led to loss of income for the fishing communities who depended on it for their livelihoods (Horton 2003). The Water Quality Improvement Act requires all farms with sales of at least $2,500 to develop nutrient management plans (Joint Legislative Audit and Review Commission of the Virginia General Assembly 2003). Traditionally, farmers would rely on animal manure generated in poultry and dairy farms in the area. Since manure contains more phosphorus than nitrogen, the government advises farmers to add commercial nitrogen fertilizer. This has increased costs for farms. The animal farms, on the other hand, must now dispose of their manure as required by the Maryland Water Quality Improvement Act.
References
- Asian Regional Network for Desertification Monitoring and Assessment, n.d.: Desertification Rehabilitation and Ecology Restoration in China Highlight. http://www.asia-tpn1.net/highlight.html.
- Ataniyazova, O. A., 2003: Health and ecological consequences of the Aral Sea crisis. Paper presented at the session of Regional Cooperation in Shared Water Resources in Central Asia, the 3rd World Water Forum, Kyoto.
- Ataniyazova, O.A., R.A. Baumann, A.K.D. Liem, U.A. Mukhopadhyay, E.F. Vogelaar, and E.R. Boersma, 2001: Perinatal exposure to environmental pollutants in the aral sea area, Acta Paediatrica, 90, 801–8.
- Awumbila, M., and J.H. Momsen, 1995: Gender and the Environment: Women’s Time Use as a Measure of Environmental Change, Global Environmental Change 5(4), 337–346.
- Bann, C., 1997: An Economic Analysis of Tropical Forest Land Use Options, Ratanakiri Province, Cambodia, Economy and Environment Program for Southeast Asia, International Development Research Centre, Ottawa.
- Barber, C.V., and J. Schweithelm, 2000: Trial by Fire: Forest Fires and Forest Policy in Indonesia’s Era of Crisis and Reform,World Resources Institute,Washington, DC, 76 pp.
- Barbier, E. B., and I. Strand, 1998: Valuing mangrove-fishery linkages: A case study of Campeche, Mexico, Environmental and Resource Economics 12, 151–66.
- Bardham, P.K., and D. Mookherjee, 2000: Capture and governance at local and national levels, American Economic Review, 90(2), 135–39.
- Baudrillard, J., 1998: The Consumer Society: Myth and Structure, Sage Publications, London, 208 pages.
- Beaudin, M., 2001: Towards Greater Value: Enhancing Eastern Canada’s Seafood Industry, Maritime Monograph Series, Canadian Institute for Research on Regional Development: Moncton, New Brunswick, 277 pages.
- Balmford, A., et al., 2002: Economic Reasons for Conserving Wild Nature, Science 297, 950–953.
- Bourne, J., 2000: Louisiana’s Vanishing Wetlands: Going, going. . . . Science 289, 1860–1863.
- Bruns, B., A. Mingat, and R. Rakotomalala, 2003: Achieving Universal Primary Education by 2015: A Chance for Every Child, World Bank, Washington, DC, 252 pages.
- Carret, J., and D. Loyer, 2003: Madagascar Protected Area Network Sustainable Financing: Economic Analysis Perspective, Paper contributed to the World Park’s Congress, Durban South Africa, September, Washington, DC: World Bank., 12 pages.
- Cesar, H., M. Öhman, P. Espeut, and M. Honkanen, 2000: Economic Valuation of an Integrated Terrestrial and Marine Protected Area: Jamaica’s Port- land Bight. In: Collected Essays on the Economics of Coral Reefs, H. Cesar (ed.), CORDIO, Kalmar University, Kalmar, Sweden.
- Cesar, H. and C.K. Chong, 2004: Economic valuation and socioeconomics of coral reefs: methodological issues and three case studies. In: Economic Valuation and Policy Priorities for Sustainable Management of Coral Reefs, Mahfuzuddin Ahmed, Chiew Kieok Chong, Herman Cesar (eds.), WorldFish Center, Malaysia, pp. 14–40.
- Cestti, R., J. Srivastava, and S. Jung, 2003: Agriculture Non-Point Source Pollution Control: Good Management Practices—The Chesapeake Bay Experience. World Bank Working Paper 7, World Bank, Washington, DC, 54 pages.
- Chesapeake Bay Foundation Report, 2004: Manure’s impact on the rivers, streams and the Chesapeake Bay: Keeping manure out of the water.
- Chesapeake Bay Program, 2003a: Managing Storm Water on State, Federal and District-owned Lands and Facilities. [online] Chesapeake Executive Council Directive No 01-1. Cited 22 October 2004. Available at http://www .chesapeakebay.net/pubs/stormwater_directive_120301.pdf.
- Chesapeake Bay Program, 2003b: Urban Storm Water Runoff. [online] Chesapeake Bay Program, Maryland. Cited 22 October 2004. Available at http://www.chesapeakebay.net/stormwater.htm.
- Cunningham, A.A., et al., 2003: Indian Vultures: Victims of an Infectious Disease Epidemic? Animal Conservation 6 189–197.
- Commission for Economic Cooperation, 2001: A North American Mosaic: State of the Environment Report, Commission for Economic Cooperation, Canada.
- Dasgupta, P. and I. Serageldin, 1999: Social Capital: A Multifaceted Perspective. World Bank, Washington DC, 424 pages.
- Dasgupta, P., and K-G Mäler, 2000: Net national product, wealth, and social well-being. Environment and Development Economics 5, Parts 1&2:69–93, February & May 2000.
- Deaton, A., 1997: The Analysis of Household Surveys: A Microeconometric Approach to Development Policy. Baltimore: Johns Hopkins University Press, 479 pages.
- Deaton, A., 2003: How to monitor poverty for millennium development goals, Journal of Human Development, 4 (3), 353–378.
- Deevey, E.S., D.S. Rice, M. Prudence, H.H. Vaughan, M. Breener, and M.S. Flannery, 1979: Mayan Urbanism—Impact on a Tropical Karst Environment. Science 206, 4416: 298–306.
- Diamond, J. 1997: Guns, Germs, and Steel: The Fates of Human Societies. New York: Norton, 480 pages.
- Emerton, L. and E. Bos, 2004: Value: Counting Ecosystems as an Economic Part of Water Infrastructure, World Conservation Union, Gland, Switzerland and Cambridge, UK. 88 pp.
- ESCAP (Economic and Social Commission for Asia and the Pacific), 1993: State of Urbanization in Asia and the Pacific. United Nations, New York.
- Fan, S., P. Hazzell, and S. Thorat, 2000: Government spending, agricultural growth and poverty in rural India, American Journal of Agricultural Economics 82(4):1038–51.
- FAO (Food and Agriculture Organization of the United Nations), 2003: The State of Food Insecurity in the World—2003. FAO, Rome, 40pp.
- FAO, UNEP, and UNDP (Food and Agriculture Organization, United Nations Environment Programme, and United Nations Development Programme), 1994. Land Degradation in South Asia: Its severity, causes and effects upon people. World Soil Resources Report, Rome.
- Flannery, T., 1994: The Future Eaters. Reed Books: Australia.
- Flenley, J.R. and S.M. King, 1984: Late Quarternary pollen records from Easter Island. Nature 307: 47–50.
- Gleditsch, N. P., P. Wallensteen, M. Eriksson, M. Sollenberg, and H. Strand, 2002: Armed conflict 1946–2001: A new dataset, Journal of Peace Research, 39: 615–637.
- Gleditsch, N. P. 1998: Armed conflict and the environment: A critique of the literature, Journal of Peace Research 35: 381–400.
- Gren, I,K.-H. Groth and M. Sylven, 1995: Economic values of Danube floodplains, Journal of Environmental Management 45, 333–345.
- Guha-Sapir, D. and R. Below, 2002: The quality and accuracy of disaster data: A comparative analyses of three global data sets, ProVention Consortium, The Disaster Management Facility, World Bank, Washington, DC.
- Hamilton, K., and M. Clemens, 1999, Genuine saving in developing countries. World Bank Economic Review, 13:2, 333–56.
- Hazell, P., 1998: Why invest more in the sustainable development of less-favored lands?. Report No. 20, International Food Policy Research Institute, Washington, DC Available at. http://www.ifpri.org/reports/0798RPT/0798RPTb .HTM
- Hazell, P. and S. Fan, 2000: Should developing countries invest more in lessfavored areas?: An empirical analysis of rural India. Economic and Political Weekly 35(17), pp. 1455–1464.
- Horton, T., 2003: Turning the tide: Saving the Chesapeake Bay. Washington D.C.: Island Press, 386 pages.
- Homer-Dixon, T., 1999: Environment, Scarcity, and Conflict. Princeton University Press, Princeton, 253 pages.
- IPCC (Intergovernmental Panel on Climate Change), 2002: Climate Change 2001: Impacts, Adaptation and Vulnerability. McCarthy, J., Canziani, O., Leary, N., Dokken, D., White, K., eds. Cambridge: Cambridge University Press.
- Irwin, E.G., 2002: The effects of open space on residential property values, Land Economics 78, 465–80.
- Jaggers, K. and T. R. Gurr, 1995: Transitions to democracy: Tracking democracy’s third wave with the polity III data, Journal of Peace Research 32 (November), 469–82.
- Joint Legislative Audit and Review Commission of the Virginia General Assembly, 2003: Implementation of the Chesapeake Bay Preservation Act.
- Kloor, K., 2000: Everglades restoration plan hits rough waters, Science, 288, 1166–1167.
- Kramer, R.A., and J.I. Eisen–Hecht, 1999: The Economic Value of Water Quality in the Catawba River Basin. Nicolas School of the Environment, Duke University, USA.
- Lange, G.M., R. Hassan, and K. Hamilton, 2003: Environmental Accounting in Action: Case Studies from Southern Africa, Cheltenham, UK: Edward Elgar Publishing Limited, 240 pages.
- Lynne, G.D., P. Conroy, and F. J. Prochaska, 1981: Economic valuation of marsh areas for marine production processes, Journal of Environmental Economics and Management 8, 175–186.
- Maddison A., 2001: The World Economy: A Millennial Perspective. OECD, Paris.
- Mather, A., 1999: Society and the services of forests. In: World Forests, Society and, Environment, M. Palo and J. Uusivori (eds.), Kluwer Academic Press, pp. 86–89.
- Mearns, R., 2001: Contextual factors in the management of common grazing lands: Lessons from Mongolia and Northwestern China. Proceedings of the XIX International Grassland Congress, Sa˜o Pedro, Brazil, February 11–21, 2001. Piracicaba: Brazilian Society of Animal Husbandry.
- Mearns, R., 2002: Taking stock: Policy, practice, and professionalism in rangeland development. Symposium on rangelands professionals and policy, February 2002, Kansas City, Missouri.
- Micklin, P.P., 1993: The shrinking Aral Sea. Geotimes, 38(4), 14–18.
- MA (Millennium Ecosystem Assessment), 2003: Ecosystems and Human Well- Being: A Framework for Assessment. Island Press, Washington, DC, 245 pp.
- Millennium Project, 2004: Task Force 7, Achieving the Millennium Development Goals for water and sanitation: what will it take? Interim full report. Task Force on Water and Sanitation Millennium Project, February (available at http://www.unmillenniumproject.org/documents/tf7interim.pdf ).
- Modelski, G., and G. Perry III, 1991: Democratization in long perspective. Technological Forecasting and Social Change, 39(1–2), 22–34.
- Modelski, G., and G. Perry, 2002: Democratization in long perspective. Technological Forecasting and Social Change, 69 (4), 359–376.
- Myers, N., 1993: Ultimate Security: The Environmental Basis of Political Stability. Island Press, Washington, DC., 308 pages.
- OECD (Organisation for Economic Co-operation and Development), 2001: The Well-Being of Nations: The Role of Human and Social Capital. OECD, Paris.
- Ojima, D., 2001: Critical drivers of global environmental and land use changes in temperate Asia. Paper presented at the Open Symposium on Change and Sustainability of Pastoral LandCentral Asia. Ulaanbaatar, Mongolia. Use Systems in Temperate and
- Ostrom, E., 1990: Governing the Commons: The Evolution of Institutions for Collective Action. Cambridge University Press, Cambridge, 279 pp.
- Ostrom, E., T. Dietz, N. Dolsak, P.C. Stern, S. Stonich, and E.U.Weber (eds.), 2002: The Drama of the Commons. National Academy Press, Washington, DC, 534 pp.
- Pagiola, S., 2002: Paying for Water Services in Central America: Learning from Costa Rica. In: S. Pagiola, J. Bishop, and N. Landell-Mills, eds., Selling Forest Environmental Services: Market-based Mechanisms for Conservation. London: Earthscan.
- Pagiola, S., N. Landell-Mills, and J. Bishop (eds.), 2002: Selling Forest Environmental Services: Market-based Mechanisms for Conservation and Development. London: Earthscan.
- Parkinson, J., 1999: Indigenous people and forests. In: World Forests, Society and Environment, M. Palo and J. Uusivori (eds.), Kluwer Academic Press, 90–91.
- Pearce, D.W., and J.W. Warford, 1993: World Without End: Economics, Environment, and Sustainable Development, Oxford: Oxford University Press.
- Ponting, C., 1991: A Green History of the World. The Environment and the Collapse of Great Civilizations. Penguin, Harmondsworth.
- Postel, S., 1993: Water and agriculture. In: Water in Crisis, a Guide to the World’s Fresh Water Resources, P. Gleik (ed.), Oxford University Press, New York, 56–66.
- Prescott-Allen, R., 2001: The Wellbeing of Nations: A Country-by-Country Index of Quality of Life and Environment. Island Press, Washington, 342 pp.
- Pretty, J.N., C. Brett, D. Gee, R.E. Hine, C.F. Mason, et al., 2000: An assessment of the total external costs of UK agriculture, Agricultural Systems, 65, 113–136.
- Pretty, J.N., C.F. Mason, D.B. Nedwell, R.E. Hine, S. Leaf, and R. Dils, 2003: Environmental costs of freshwater eutrophication in England and Wales. Environmental Science and Technology, 32, 201–208.
- Putnam, R., R. Leonardi, and R. Nanetti, 1993: Making Democracy Work: Civic Traditions in Modern Italy. Princeton University Press, Princeton.
- Rausser, G.C., and A.A. Small, 2000: Valuing research leads: Bioprospecting and the conservation of genetic resources, Journal of Political Economy, 108, 173–206.
- Reddy, S.G., and T.W. Pogge, 2002: ‘‘How Not to Count the Poor,’’ http:// www.socialanalysis.org/, 73 pages.
- Redman, C.L., 1999: Human Impact on Ancient Environments, Tucson: University of Arizona Press, 239 pages.
- Repetto, R., W. McGrath, M. Wells, C. Beer, and F. Rossini, 1989: Wasting Assets: Natural Resources and the National Income Accounts. Washington, DC: World Resources Institute, 68 pages.
- Ricketts, T.H., G.C. Daily, P.R. Ehrlich, and C.D. Michener, 2004: Economic value of tropical forest to coffee production. Proceedings of the National Academy of Sciences, 101(34), 12579–12582.
- Rodden, J., G.S. Eskeland, and J. Litvack, 2002. Decentralization and the Challenge of Hard Budget Constraints. MIT Press, Boston, 446 pages.
- Ruitenbeek, J. 1999: Indonesia. In D. Glover & T. Jessup (eds.): Indonesia’s Fires and Haze. The Cost of Catastrophe. Institute for Southeast Asian Studies, Singapore, 86–129.
- Sachs, J.D., J.W. McArthur, G. Schmidt-Traub, M. Kruk, C. Bahadur, M. Faye, and G.McCord. 2004: ‘‘Ending Africa’s Poverty Trap.’’ Brookings Papers on Economic Activity no. 2: 117–216.
- Schweithelm, J., and D. Glover, 1999: Causes and impacts of the fires. In D. Glover & T. Jessup (eds.): Indonesia’s Fires and Haze. The Cost of Catastrophe. Institute for Southeast Asian Studies, Singapore, 1–13.
- Schweithelm, J., T. Jessup, and D. Glover, 1999: Conclusions and policy recommendations. In D. Glover & T. Jessup (eds.): Indonesia’s Fires and Haze. The Cost of Catastrophe. Institute for Southeast Asian Studies, Singapore, 130– 143.
- Sen, A., 1999: Development as Freedom. New York, Knopf.
- Simpson, R.D., R.A. Sedjo, and J.W. Reid, 1996: Valuing biodiversity for use in pharmaceutical research, Journal of Political Economy, 104, 163–185.
- Stonich, S.C., J.R. Bort, and L.L. Ovares, 1997: Globalization of shrimp mariculture: The impact on social justices and environmental quality in Central America. Society and Natural Resources 10(2), 161–179.
- Swearingen, W. D., and A. Bencherifa (eds.), 1996: North African Environment at Risk: State, Culture and Society in Arab North Africa. Westview Press, Boulder, Colorado.
- Ter-Minassian, T. (ed.), 1997: Fiscal Federalism in Theory and Practice. International Monetary Fund, Washington, DC.
- Thorsnes, P., 2002: The value of a suburban forest preserve: Estimates from sales of vacant residential lots, Land Economics 78, 426–441.
- Tiffen, M., M. Mortimore, and F. Gichuki, 1994: More People, Less Erosion: Environmental Recovery in Kenya. John Wiley and Sons, Chichester.
- Turner, R.K., J. Paavola, P. Cooper, S. Farber, V. Jessamy, and S. Georgiou, 2003: Valuing nature: lessons learned and future directions. Ecological economics 46: 493–510.
- Turpie, J., and B. Heydenrych, 2000: Economic consequences of alien infestation of the Cape Floral Kingdom’s Fynbos vegetation. In: The Economics of Biological Invasions, C. Perrings, M. Williamson, and S. Dalmazzone (eds.), Edward Elgar, U.K., 152–182.
- United Nations Millennium Project, 2004: A Global Plan to Achieve the Millennium Development Goals. www.unmillenniumproject.org/
- UN (United Nations), 1953: UN Statistics Yearbook, United Nations, New York.
- UNDP (United Nations Development Programme), 2003: Human Development Report. New York.
- UNEP (United Nations Environment Programme), 1992: World Atlas of Desertification. Oxford University Press, New York.
- UNEP, 1997: World Atlas of Desertification. Oxford University Press, New York.
- van Andel, T.H., E. Zangger, and A. Demitrack, 1990: Land use and soil erosion in prehistoric and historic Greece; Journal of Field Archaeology 17: 379–396.
- van Beukering, P., and H. Cesar, 2004: Economic Analysis of Marine Managed Areas in the Main Hawaiian Islands. Cesar Environmental Economics Consulting, The Netherlands.
- Van Wilgen, B.A., D.C. le Maitre, and R.M. Cowling, 1998: Ecosystem services, efficiency, sustainability and equity: South Africa’s Working for Water Programme. Trends in Ecology and Evolution 13,9: 378.
- Van Wilgen, B.W., et al., 2002: Win-win-win: South Africa’s Working for Water Programme. In S.M. Pierce, R.M. Cowling, T. Sandwith, and K. Mac- Kinnon, eds., Mainstreaming Biodiversity in Development: Case Studies from South Africa, The World Bank, Washington, DC, 5–20.
- Van Wilgen, B., 2004: The largest environmental programme in Africa continues to tackle alien invasives, CSIR Technobrief 11, CSIR, South Africa (Online) Available at: www.csir.co.za/websource/ptl0002/pdf_files/technobrief/ sep2004/workingforwater.pdf ).
- Vincent, J., et al., 1997: Environment and Development in a Resource-Rich Economy: Malaysia under the New Economic Policy (Cambridge, MA: Harvard Institute for International Development).
- Wiebe, K. (ed.), 2003: Land Quality, Agricultural Productivity, and Food Security. Edward Elgar, Northampton, MA, 461 pages.
- Wood, S., F. Nachtergaele, D. Nielsen, and A. Dai, 1999: Spatial aspects of the design and targeting of agricultural development strategies [online], International Food Policy Research Institute, Washington, DC. Cited October 22, 2004. Available at http://www.ifpri.org/divs/eptd/dp/papers/eptdp44.pdf.
- Working for Water, 2004: Working for Water Annual Report 2003/4. Working for Water, Cape Town.
- World Bank, 2003: World Development Report 2003: Sustainable Development in a Dynamic World. Oxford: Oxford University Press.
- World Bank, 2004a: World Development Indicators 2004. World Bank, Washington, DC.
- World Bank, 2004b: State and Trends of the Carbon Market–2004. World Bank, Washington, DC.
- WHO (World Health Organization), 2002. World Health Report. Geneva.
- WHO, 2004. World Health Report. Geneva.
- Worster, D. 1979. Dust Bowl: The Southern Plains in the 1930s. Oxford University Press, New York.
- WRI (World Resources Institute), 2000: People and Ecosystems: The Fraying Web of Life. Washington, DC: World Resources Institute, 389 pages.
Terms of Use
The copyright for material on this page is the property of the World Resources Institute. Click here for the Terms of Use (Ecosystems and Human Well-Being: Volume 1: Current State and Trends: Ecosystem Change and Human Wellbeing).
Disclaimer: This chapter is taken wholly from, or contains information that was originally written for the Millennium Ecosystem Assessment as published by the World Resources Institute. The content has not been modified by the Encyclopedia of Earth.
|
|