Water profile of South Africa
Contents
- 1 Geography, Climate, and Population
- 2 Economy, Agriculture, and Food Security
- 3 Water Resources and Use
- 4 Irrigation and Drainage Development
- 5 Water Management, Policies, and Legislation Related to Water Use in Agriculture
- 6 Environment and Health
- 7 Perspectives for Agricultural Water Management
- 8 Further Reading
Geography, Climate, and Population
The water profile of South Africa is dominated by pressures of human overpopulation, combined with inadequate treatment of domestic sewage. The results are high incidence of waterborne diseases and shortages of water for farmland irrigation. South Africa is the southernmost country on the African continent. It measures almost 1600 kilometers (km) from north to south as well as from east to west and has an area of 1.22 million square kilometers (km2). South Africa is bordered by Botswana and Zimbabwe to the north, Mozambique and Swaziland to the northeast and east, the Indian Ocean to the southeast and south, the Atlantic Ocean to the southwest and west and Namibia to the northwest. Lesotho, an independent constitutional monarchy, is entirely surrounded by South African territory in the eastern part of the country. The four original provinces of South Africa - Cape of Good Hope, Orange Free State, Transvaal, and Natal - were reorganized in 1994 into nine new provinces: Western Cape, Northern Cape, Eastern Cape, North-West, Free State, Gauteng, Mpumalanga, Limpopo (formerly called Northern Province), and KwaZulu-Natal.
A plateau that covers the largest part of the country dominates the topography. It is separated from the surrounding areas of generally lower elevation by the Great Escarpment. The plateau consists almost entirely of very old rock of the Karoo System, which formed from the Late Carboniferous Epoch (320 to 286 million years ago) to the Late Triassic Epoch (230 to 208 million years ago). The plateau is generally highest in the east, dropping from elevations of 2400 meters (m) in the basaltic Lesotho region to 600 meters in the sandy Kalahari in the west. The central part of the plateau comprises the Highveld, which is between 1200 and 1800 m in elevation. South of the Orange River lies the Great Karoo region.
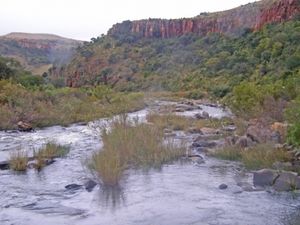
The Great Escarpment, known by a variety of local names, forms the longest continuous topographic feature in South Africa and provides scenery of great beauty. It runs southward from the far northeast, where it is generally known as the Drakensberg. Farther south it forms the boundary, first between KwaZulu-Natal and Free State provinces and then between the KwaZulu-Natal province and Lesotho, where it reaches heights of up to nearly 3,300 meters. The mountainous escarpment continues southwestward, dividing Lesotho from the Eastern Cape province. At lesser altitudes of 1,600 to 2,600 meters, it runs westward across Eastern province, where it is known as the Stormberg. Farther to the west, it forms the approximate boundary between Northern Cape and Western Cape provinces, with names such as the Nuweveld Range and the Roggeveld Mountains. At its western extreme, in the vicinity of Mount Bokkeveld and Mount Kamies (1,800 meters), the escarpment is not well defined.
On both sides of the Great Escarpment, the topography tends to be relatively broken. Open plains are relatively rare. Ridges, mountains, and deeply incised valleys are common, mainly left by the erosion of very old landforms. Between the escarpment and the sea there is little genuine coastal plain, with exceptions in northern KwaZulu-Natal, where it reaches 80 km in width, and in parts of Western Cape. For most of its 2,900 km length, the coastline is characterized by fairly steep slopes rising rapidly inland. Most of the coastline has experienced uplift or falling sea levels in the recent geologic past, with the result that few flooded river valleys or natural harbors occur. Long stretches of beach are common. In KwaZulu-Natal, long shore drift over many centuries has created spits and bluffs from beach sand; in a number of places these features have enclosed bays, which have provided both remarkable sanctuaries for wildlife (like the St. Lucia estuary) and, when the mouths are dredged, good harbors, as at Durban and Richard’s Bay.
An area of very old folded mountains, with altitudes between 1,000 and 2,500 meters, lies in the southwest of the country. It includes ranges such as the Tsitsikama, Outeniqua, Great Swart, Lange, Seder, Drakenstein, and Hottentots Holland Mountains, as well as Table Mountain and its associated features at Cape Town.
Based on annual rainfall, three climate zones can be distinguished:
- The eastern parts of the country, which are summer rainfall areas with an annual precipitation of 500 millimeters (mm) and more.
- The central and the western parts of the great plateau, which are semi-arid to arid and are characterized by late summer rains, varying from less than 100 mm to approximately 500 mm.
- The Cape fold mountains and the area between them and the sea have a winter rainfall season in the west and rainfall throughout the year in the more southeasterly parts. Rainfall in this region varies from about 300 mm to more than 900 mm.
The average annual rainfall is 495 mm, ranging from less than 100 mm/year in the western deserts to about 1,200 mm/year in the eastern part of the country. Only 35 percent of the country has a precipitation of 500 mm or more, while 44 percent has a precipitation of 200-500 mm and 21 percent has a precipitation of less than 200 mm. Therefore, 65 percent of the country does not receive enough rainfall for successful rainfed crop production and is used as grazing land. Crops grown in this area are grown under irrigation. Mild to severe frost occurs regularly on the great plateau limiting the choice of crops and resulting in strong seasonal patterns for most crops grown. Except for the Western Cape, with a Mediterranean climate and winter rainfall, the rest of the country is a summer rainfall area. Summer is from October to March with temperatures from 15 °C at night to 30 °C at noon. Winter is from April to September with temperatures from 0 °C at night to 18 °C at noon. Winter temperatures in the interior often drop below zero and frost is common. South Africa ranks very high as far as sunshine days are concerned.
Natural vegetation reflects the climatic zones of the country:
- In the eastern parts of the country vegetation varies from temperate grassland in the higher altitudes to savanna and bushveld in the middle altitudes and to forest in the lower altitudes.
- In the southwestern parts of the country with its Mediterranean climate, plant life consists of mainly fynbos types.
- The dry central and western parts of the plateau are covered by various combinations of short shrubs and desert type grasses.
Climate-soil combinations mean that only 12 percent of the total land area, or 14.6 million ha, could be considered as cultivable. The cultivated area, however, calculated as the sum of arable land and land under permanent crops, was about 15.7 million ha in 2002 (Table 1). The reason is that sometimes soils are cultivated that in fact are not really cultivable.
South Africa’s population is estimated at 45.4 million (2004), of which 42 percent is rural (Table 1). The annual growth rate is estimated at about 1.2 percent. The average population density is 37 inhabitants/km2, ranging from 21 in rural areas to more than 100 inhabitants/km2 in more densely populated areas. Eleven official languages are recognized, with isiZulu (23 percent), isiXhosa (18 percent), Afrikaans (14 percent), and English (9 percent) as the most prevalent. In 2002, 98 percent of the urban and 73 percent of the rural population were using improved drinking water sources, amounting to a national coverage of 87 percent (Table 1). Fewer than half (45 percent) of South African households have a water tap inside the dwelling.
The unemployment rate at the time of the 1996 population census was 34 percent. Four provinces had higher unemployment rates than the country as a whole; Eastern Cape (49 percent), Limpopo (46 percent), KwaZulu-Natal (39 percent), and North West (38 percent).
Economy, Agriculture, and Food Security
South Africa has a market economy that is largely based on services, manufacturing and mining. Economic policy has primarily been aimed at sustaining economic growth and achieving a measure of industrial self-sufficiency. The Gross Domestic Product (GDP) was US$159.9 billion (current US$) in 2003, with an annual growth of 3 percent. Agriculture contributed 3.8 percent to the GDP and employed 8 percent of the workforce. Maize is the chief staple and the nation’s chief farm export, but annual harvests fluctuate sharply because of the frequent droughts. Other major crops include sugar cane, wheat, potatoes, groundnuts, citrus fruits, and grapes. Natural pasture covers two thirds of the land and supports sheep, cattle, and other livestock.
Approximately 14 million South Africans, or one third of the total population, are vulnerable to food shortages. The reason for this is poverty and the lack of suitable infrastructures in the deep rural areas and not that too little food is produced, since South Africa is a net food exporter. While homegrown vegetables could alleviate this problem, this is only practised on a small scale because of the small portion of the country that gets enough and reliable rain for successful rainfed vegetable production. The seasonality and unreliability of rainfall results in dry periods during which the food security problem increases for many households. Intervention of the Government or nongovernmental organizations (NGOs) is often required to alleviate the situation. Irrigation could contribute to the mitigation of the problem, but the local topography in rural areas often prevents successful irrigation development, where streams and springs are available as a water source. High poverty and illiteracy levels preclude the installation and operation of sophisticated pumping equipment by the communities. The use of low-level technology like treadle pumps is limited by the low heights that these devices can pump to.
Rich fishing grounds exist mainly off the west coast and annual landings include anchovies, Cape hake, and herring, most of which are processed as canned or frozen foods by the fishing industry.
Mining accounts for 10 percent of the GDP and is dominated by the production of gold. South Africa is the world’s largest producer of gold, although its importance in the nation’s total mineral output has declined significantly since 1946. South Africa is also a leading producer and exporter of chromites, gem diamonds, platinum, and vanadium. Antimony, industrial diamonds, fluorite, manganese, and vermiculite are also produced in large quantities. Manufacturing accounts for 25 percent of the GDP and employs one sixth of the workforce. Principal manufactures include metal products, chemicals, food, and beverages, electrical machinery, motor vehicles, textiles, and printing and publishing. Electricity is generated mostly by using domestic coal.
South Africa’s chief suppliers are Germany, the United States, the United Kingdom, and Japan. Machinery, transport equipment, chemicals and foodstuffs are the major imports. Switzerland, the United Kingdom, the United States, Japan, and Germany are the chief markets for South African exports. Gold, the country’s largest export commodity, is followed by gem diamonds and other metals and metal products.
[[HIV]/AIDS is a serious and ever increasing problem. Recent news reports state that deaths due to this disease exceed 600 per day. The effect on agriculture has not been determined yet, but as the deaths seem to be mostly young to middle-age adults and children, it is expected to have a detrimental effect on agricultural production.
Water Resources and Use
Water Resources
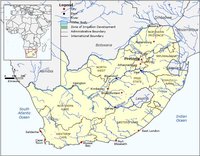
The drainage network of South Africa can be divided into four major systems:
- Approximately 48 percent of the country (606 000 km2) is drained to the Atlantic Ocean by the Orange River, which rises in the Lesotho Highlands, and its tributaries. Chief among these are the Caledon and the Vaal Rivers. Total mean annual runoff is 11.1 cubic kilometers (km3).
- North of the Witwatersrand ridge, the plateau is drained to the Indian Ocean by the Limpopo River system, with major tributaries such as the Crocodile and the Elephants River. This basin has a mean annual runoff of 5.1 km3 draining approximately 14 percent of the country.
- All other rivers draining into the Indian Ocean, the largest of which is the Tugela River, cover approximately 29 percent of the country with a mean annual runoff of 28 km3.
- Rivers draining the fold mountains of the south-western Cape into the Atlantic and Indian Oceans cover approximately 9 percent of the total area, with a mean annual runoff of 5 km3. The most important rivers in this area are the Olifants and the Breede Rivers.
River flows reflect the rainfall pattern. Rivers that have their origin on the eastern great escarpment and in the fold mountains of Western Cape normally have perennial flows. Rivers that originate in the immediate adjoining areas have periodic flows, whereas rivers that originate on the western great plateau have highly episodic flows.
The total annual surface runoff is estimated at 48.2 km3, or approximately 9 percent of annual rainfall. Of this amount, 5.2 km3 come from Lesotho and Swaziland. Of the 48.2 km3, an estimated 9.5 km3 are assumed to be required for the ecological reserve. However, much of the total runoff volume is lost through flood spillage and evaporation, so that in 2000 the available yield was estimated at 13.9 km3/year only. The total dam capacity is estimated at 28.5 km3. The dams command virtually all the runoff from the plateau, while the untapped resources are concentrated along the east and south [[coast]s].
About 4.8 km3 of groundwater is produced per year, of which an estimated 3 km3 is in turn drained by the rivers. Although groundwater is limited due to the geology of the country and large porous aquifers occur only in a few areas, it is extensively utilized in the rural and more arid areas. Available yields from these resources are estimated at 1 km3/year in 2000. It is foreseen that groundwater use for human consumption will increase, especially in the western part of the country which lacks perennial rivers.
|
| ||
| Sector | Water requirements in 2000 | |
| km3 | % | |
| Irrigation | 7.836 | 59 |
| Domestic- Urban | 3.332 | 25 |
| Domestic- Rural | 0.572 | 4 |
| Mining and Bulk Industrial | 0.756 | 6 |
| Sub-total | 12.496 | 94 |
| Afforestation | 0.488 | 4 |
| Power generation | 0.296 | 2 |
| Total | 13.280 | 100 |
Taking into consideration the overlap between surface water and groundwater, total internal renewable water resources are estimated at 44.8 km3/year out of the total actual renewable water resources, which include incoming water from other countries, at 50.0 km3/year (Table 2).
Estimates of still undeveloped resource potential show that the yield from surface water could be increased by approximately 5.6 km3 per year by the year 2025. Potential also still exists for further groundwater development, although on a smaller scale. A projection for 2025 by the Department of Water Affairs and Forestry (DWAF) shows that the total annual water withdrawal will be 14.5 km3 by then, against 12.5 km3 in 2000.
Desalination of seawater offers particular future opportunities for coastal users. Some desalination plants have been installed, which in 1990 had a capacity of 18 million m3/year. Some industries have demineralization plants, but these are used on reticulated municipal or borehole water and their capacities are usually relatively small. Although expensive, the trend is that desalination will become more competitive due to the continuous technological advances. It is not foreseen that importing water or other unconventional options will be economically competitive in the near future.
Water Use
In the northern parts of the country, both surface water and groundwater resources are nearly fully developed and utilized. Some over-exploitation occurs in localized areas, with little undeveloped resource potential remaining. On the contrary, in the well-watered southeastern regions of the country significant undeveloped and little-used resources exist.
The water requirements of different sectors of the economy, standardized to a 98 percent assurance of supply, are given in Table 2 and Table 3. Total water withdrawal was estimated at 12,496 million m3 in the year 2000, with irrigation accounting for 62 percent (Figure 1).
Substantial volumes of water from urban and industrial developments are returned to streams and are available for reuse, with specific potential in some coastal cities where wastewater is discharged into the sea. Total usable water return flows are close to double the current yield from groundwater.
International Water Issues
South Africa has signed and ratified the Shared Water Course System Protocol (SADC) and the Revised Protocol on Shared Water Courses that describes how the signatory parties will utilize and develop internationally shared water resources. Intergovernmental discussions and studies are underway on the sharing of Orange River water between South Africa and Namibia, as well as on the sharing of Limpopo River water between South Africa and the other three countries in the Limpopo River Basin: Botswana, Zimbabwe, and Mozambique.
The Lesotho Highlands Water Project (LHWP) was conceived principally to export water from Lesotho to the north of South Africa. This 30-year scheme will eventually consist of five vast reservoirs and more than 200 km of tunnels that will divert water from the natural southwesterly flow of rivers, arising in an upstream sub-basin of the Orange river basin in Lesotho highlands, northwards to deliver 70 cubic meters per second (m3/sec) to the Vaal river basin (which is another sub-basin of the Orange river basin) to secure future water supplies to South Africa’s industrial powerhouse in the Pretoria-Witwatersrand-Vereniging (PWV) area. Most of the construction will take place inside Lesotho. The 1991 cost estimate was US$5.2 billion.
Irrigation and Drainage Development
Evolution of Irrigation Development
The potential for full or partial control irrigation development, based on water availability and land suitability, is estimated at 1.5 million hectares (ha). In the central and western parts of the country, suitable soils are available for an increase in the irrigated area, but the expansion potential is limited by lack of water. In the eastern parts of the country steep slopes and a lack of suitable soils restrict an expansion of irrigable areas. Soils are classified for irrigation suitability on the basis of soil depth, clay content, structural development, and chemical characteristics. However, the importance of soil classification for irrigation purposes is somewhat reduced due the application of today’s highly sophisticated irrigation technology.
Irrigation development was sporadic before the first Irrigation and Water Conservation Act was passed in 1912, although some descriptions of irrigation development in the late 18th and early 19th Century are found in travel writings of that period. Between 1912 and the 1940s, irrigation development took place at a level that was never reached again afterwards. Much of the development in the 1930s and 1940s was done in an effort to alleviate the poverty problem that followed the great depression of the early 1930s and to accommodate returning soldiers after the Second World War. Some of these schemes developed a history of not being able to supply enough water for their irrigation areas, but this problem was partly solved by the development of inter-basin transfers, mainly between the 1960s and 1980s.
In 2002, an area of almost 1.5 million hectares was equipped for full or partial control irrigation, comprising surface irrigation on approximately 500 000 ha, mechanized and non-mechanized sprinkler irrigation on approximately 820,000 ha, and localized irrigation on approximately 178,000 ha (Table 4 and Figure 2).
Virtually no statistics are available at the national level on the use of wetlands. Although one study on the use of wetlands indicates some subsistence-level vegetable production in a wetland of about 395 ha, this information could not be confirmed.
A few individuals practice small-scale water harvesting and some research on different aspects of this practice is being done. In commercial farming practices in the marginal production areas, techniques such as planting low population densities with wide inter-row spacing and cropping every other year with at least a year-long fallow period to allow for a building-up of profile water content before the next crop is planted are used.
Role of Irrigation in Agricultural Production, the Economy, and Society
The main irrigated crops are fodder crops, wheat (average top-farmer yield of 5 tonnes/ha), maize (average top-farmer yield of 12 tonnes/ha), sugar cane (with yields of 160-210 tonnes/ha), vegetables, and pulses (Table 4 and Figure 3). On average, the yield of irrigated wheat is estimated at 3.5 tonnes/ha, the yield of irrigated maize at 7.5 tonnes/ha and the yield of other cereals at 2.5 tonnes/ha. However, total production is highly variable due to annual variations in climate.
The cost of installing irrigation systems is highly variable, but as a rough guide one could expect the capital outlay as shown in the following table. The annual cost for the farmer, which would pay for water, maintenance, and administration of a scheme, varies from US$300/ha to up to US$1,300/ha under exceptional circumstances (Table 5).
Accepted design efficiencies for the main irrigation techniques are as follows: a) 55-65 percent for surface irrigation; b) 75-85 percent for mechanized and non-mechanized sprinkler systems; and c) 85-95 percent for localized irrigation. Actual efficiencies seem to deviate from the default design values, although very little reported data are available to substantiate this. Surface (borderstrip) irrigation system efficiencies have been measured at 40 percent and up to 95 percent in a very few cases. One study indicated an overall efficiency of about 63 percent on some of the bigger irrigation schemes.
| Table 5. Approximate costs for installation of irrigated systems | |
| System type | Instalation cost (US$/ha) |
| Surface irrigation | 90-1,100 |
| Non-mechanized sprinkler irrigation | 500-2,500 |
| Mechanized sprinkler irrigation | 700-2,100 |
| Micro-irrigation and drip irrigation | 900-2,600 |
Status and Evolution of Drainage Systems
Drainage systems cover approximately 54,000 ha. These are mostly open, lined ditches in already existing government irrigation schemes, built in such a way that farmers could link their subsurface drainage systems to them. In virtually all cases drainage water is released into the river systems and adds to the irrigation water used by downstream irrigators as return flow.
Water Management, Policies, and Legislation Related to Water Use in Agriculture
Institutions
Three ministries are involved in water management and irrigation development:
- The Ministry of Water Affairs and Forestry, through the Department of Water Affairs and Forestry (DWAF), monitors surface water and groundwater resources, formulates the national water strategy, and is responsible for the implementation of the Water Act.
- The Ministry of Agriculture, through the National and Provincial Departments of Agriculture (NDA and PDA), promotes irrigation engineering concepts and is responsible for agricultural extension with the aim of improving irrigation efficiency.
- The Ministry of Land Affairs is responsible for the settlement of new farmers.
The development of new irrigation schemes and the upgrading of existing schemes for commercial agriculture are coordinated between the relevant departments by provincial liaison committees, known as the Irrigation Action Committees (IACs). Development and upgrading of irrigation schemes for non-commercial agriculture are coordinated by the Coordinating Committee on Small-Scale Irrigation Support (CCSIS).
Most of the research on the various aspects of water use is promoted, funded, and coordinated by the Water Research Commission (WRC), whose funds are generated by a levy on water use. Various institutes of the Agricultural Research Council (ARC) are to a greater or lesser degree involved in irrigation-related research, as are some of the universities. Very little irrigation-related research and extension is done by the departments of agriculture. This is offset by one private organization, the South African Sugar Association, which does some irrigation-related research and extension work.
Water Management
The Water Act stipulates water management by Water User Associations (WUA) at the local level. Each WUA will have all water users in an area as members, and the local management should eventually be the total responsibility of the WUA. Each WUA will have an elected management body, with all sectors of water users represented on the committee. Several WUAs will fall under an umbrella organization, the Catchment Management Agency (CMA). Each CMA will have an area of responsibility, which could be a catchment, a portion of a large catchment or a combination of small catchments. Nineteen such water management areas have been identified. The administrative procedures for converting irrigation board areas, private schemes, and government water schemes into WUAs are currently in progress. Until the CMAs are in place, the DWAF will carry out their function. The conditions for the use of water that the CMAs and WUAs must oversee include: i) equal access to water by all interested parties, ii) safeguards against water wastage and low efficiencies of water use, and iii) safeguards against pollution.
Construction of private reservoirs is restricted to a maximum capacity of 250,000 m3 and diversion of discharge must not exceed 110 litres/sec. Specifications on dam safety are also set.
Policies and Legislation
No definite policy is in place regarding natural disasters such as floods and droughts. Each case is judged on merit but experience has been that in most cases none or very little government aid is given. The baseline message seems to be that the prevalence of disasters should be part of the irrigator’s risk management strategy and that the irrigator should be as self-reliant as possible under all circumstances.
Major changes in policy are the shift from the previous practice of selling irrigation water on an area basis to selling it on a volumetric basis, and the initiation of a water market. This has opened the potential for efficient irrigators to save on their irrigation expense account and also for irrigators to sell surplus water to more efficient and productive irrigators.
One unfortunate result of changes in policy is that the agricultural extension services that were available to the commercial irrigation sector have been scaled down in favor of services for the previously disadvantaged communities where very little irrigation takes place. The result is that a large sector of the irrigation community is no longer advised on the latest developments in irrigation technology because those farmers can not afford irrigation consultants and, except for innovators and early adopters, are also not necessarily people who will actively and independently seek out and apply new irrigation technology.
The Water Act of 1998 determines that all water use, with the exception of reasonable domestic use, home garden use, and stock water requirements, must be licensed. This ends the era of a distinction between government irrigation schemes, irrigation boards, private irrigation schemes, as well as public and private water with all that it entailed. The Act also provides for stiff penalties if non-effective use of water can be proved. The Water Act is the result of various discussion papers that have been circulated and widely discussed. To ensure the involvement of all potential irrigators, these discussion papers were included as parts of discussion papers on other, but related, fields such as a discussion paper on an agricultural policy and discussions on a white paper on a national water policy.
Environment and Health
The DWAF acts against polluters, if they can be identified. Some cases have been taken to court, amongst others for herbicide pollution by some farmers and for pollution by industry. There is a general tendency that the salt content of rivers increase as one moves downstream, mainly through industrial, irrigation, and drainage return flows. Research on the negative effect of this on crop production is being funded by WRC, but to date no concerted extension programs to minimize this problem have been launched by the various departments of agriculture.
The Water Act specifies that a specific amount of water be kept earmarked to satisfy ecological requirements. All future water balance calculations must include a provision for this ecological reserve, although the application of this principle has not yet been described in full detail.
An estimated 260,000 ha of irrigated land in South Africa is affected by waterlogging and/or salinization. The salinization of about 15,000 ha is serious enough to limit the choice of crops to salt-tolerant species only and would require costly rehabilitation programs. On balance, salinity would suppress production levels of salt-sensitive crops, but the choice of crops is not seriously limited and treatment with ameliorants and leaching will usually suffice. Government extension personnel and consultants on remedial actions are on hand to advise farmers who experience salinization and/or waterlogging problems and ask for advice.
Rapid urbanization results in informal shanty towns that spring up near cities. In most of these cases waste management is at a very low level or absent. Pollution of water resources happens and the local population becomes threatened by waterborne diseases. Surveys are currently under way to identify high-risk areas and the number of high-risk inhabitants with the aim of launching information and other programs to reduce pollution.
The shifting of water management to the local level through WUAs also transfers the responsibility for the following advisory services to that level:
- Effective water use and measures to prevent misuse
- Environmentally friendly production practices
- Prevention of salinization and reclaiming salinized areas
- The management of water-borne diseases
Pilot studies on how this could be implemented are in process.
Sedimentation of dams is a problem, especially in the dams that impound parts of the Central Plateau that are covered by the very old rock of the Karoo (Karroo) System and its sediments. As a general rule the soils that develop from this material are prone to erosion and hence some dams in the central parts of the country have lost a substantial amount of their capacity. The exact dimensions of this problem have not been determined but some exceptional cases are known where dams have lost more than 25 percent of their capacity over the last 80 years.
Perspectives for Agricultural Water Management
Provisional estimates are that South Africa will run out of surplus usable water by 2025, or soon thereafter. Inter-basin transfers are in place and more are planned, but due to the high cost of this development, such water is seen as being used for industrial and public needs only and not for irrigation. It is foreseen that in the future the irrigation sector must sacrifice some of its water for public and industrial usage.
The DWAF has three pilot studies in progress to determine what steps WUAs could take to ensure more effective water use in the future. These include an increase in irrigation efficiency according to the benchmarks of crop irrigation requirements and more efficient dam and canal management.
New large-scale irrigation development is not possible because of the limited water availability and the shortage of good irrigable soils within economic distance of water sources. Irrigation development with government and donor funding is mainly limited to the development of community gardens and the revitalization of irrigation schemes in the previously black homelands.
Water demand projections indicated an annual growth of 1.5 percent between 1990 and 2010, ranging from 3.5 percent for urban and industrial use to 1 percent for irrigation. The moderate predicted growth for irrigation is caused by low economic returns on irrigation water and, since 1984, the sharp increase in costs of irrigation equipment compared with a modest increase in agricultural produce prices.
Further Reading
- Department of Agricultural Development. 1990. Food strategy database.
- Department of Agricultural Development. 1991. Spotlight on irrigation development in the RSA: the past, present and future.
- Department of Agriculture and Land Affairs. 2002. Food security policy for South Africa. Discussion document.
- Department of Water Affairs and Forestry. 1986. Management of the water resources of the Republic of South Africa.
- Encyclopaedia Britannica. 2002. South Africa. ISBN: 0852297874
- FAO. 1992. South Africa, Agricultural sector mission, Irrigation reconnaissance.
- Government Gazette. 2002. Proposed national water resources strategy. Department of Water Affairs and Forestry.
- Pelser, A.J., Redelinghuis, N., Viljoen, M.F., Coetsee, H., Steyn, M.S., Jankielsohn, R. 2001 (unpublished). Towards the development of guidelines for the evaluation of social, economic and political impacts of drought and water scarcity. Concept report for WRC project K8/375. Faculty of Natural and Agricultural Sciences, University of the Free State.
- Statistics South Africa. 1997. Rural statistical survey database.
- Thompson, M.W. 1999. South African national land cover database project. CSIR.
- Walton, Chr. (ed.). 1982. Reader’s Digest. Atlas of Southern Africa.
- Water Research Commission. 1985. Report on a situation study of irrigation return flow quantity and quality in river basins with extensive irrigation development in South Africa. Ninham Shand Consulting Engineers. WRC Report No 943/4061.
- Water Research Commission. 1991. Researching and applying measures to conserve natural irrigation resources.
- Water Research Commission. 1994. Irrigation development in southern Africa with special reference to South Africa.
| Disclaimer: This article is taken wholly from, or contains information that was originally published by, the Food and Agriculture Organization. Topic editors and authors for the Encyclopedia of Earth may have edited its content or added new information. The use of information from the Food and Agriculture Organization should not be construed as support for or endorsement by that organization for any new information added by EoE personnel, or for any editing of the original content. |