Permafrost in the Arctic
This is Section 6.6 of the Arctic Climate Impact Assessment.
Lead Author: John E.Walsh; Contributing Authors: Oleg Anisimov, Jon Ove M. Hagen,Thor Jakobsson, Johannes Oerlemans,Terry D. Prowse,Vladimir Romanovsky, Nina Savelieva,Mark Serreze, Alex Shiklomanov, Igor Shiklomanov, Steven Solomon; Consulting Authors: Anthony Arendt, David Atkinson, Michael N. Demuth, Julian Dowdeswell, Mark Dyurgerov, Andrey Glazovsky, Roy M. Koerner, Mark Meier, Niels Reeh, Oddur Sigur0sson, Konrad Steffen, Martin Truffer
Contents
Terrestrial Permafrost (6.6.1)
Background (6.6.1.1)
Permafrost is soil, rock, sediment, or other earth material with a temperature that has remained below 0°C for two or more consecutive years. Permafrost underlies most of the surfaces in the terrestrial Arctic. Permafrost extends as far south as Mongolia[1], and is present in alpine areas at even lower latitudes. Figure 6.21 shows the distribution of permafrost in the Northern Hemisphere, classified into continuous, discontinuous, and sporadic zones. In the continuous zones, permafrost occupies the entire area (except below large rivers and lakes). In the discontinuous and sporadic zones, the percentage of the surface underlain by permafrost ranges from 10 to 90%. Discontinuous permafrost underlies a larger percentage of the landscape than does sporadic permafrost, although there is not a standard definition of the boundary between the two zones (Fig. 6.21 uses 30% coverage as the boundary). In the Northern Hemisphere, permafrost zones occupy approximately 26 million square-kilomters (km2) or about 23% of the exposed land area, but permafrost actually underlies 13 to 18% of the exposed land area[2]. Distinctions are made between permafrost that is very cold (temperatures of -10°C and lower) and thick (500–1400 meters [m]), and permafrost that is warm (within 1 or 2°C of the melting point) and thin (several meters or less). Ground ice (0–20 m depth) in permafrost exhibits large spatial variability, with generally much more ice in lowland permafrost than in mountain permafrost[3].
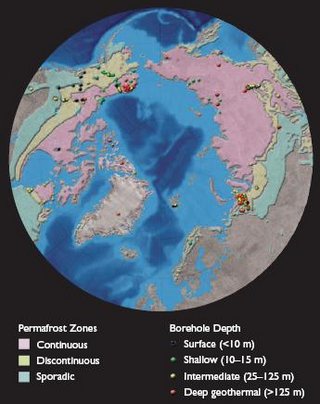 Fig. 6.21. Permafrost distribution in the Northern Hemisphere. Colored circles are locations of candidate boreholes for permafrost temperature monitoring by the GTN-P[4].
 The role of permafrost in the climate system is threefold[5]. First, because it provides a temperature archive, permafrost is a "geoindicator" of environmental change. At depths below 15 to 20 m, there is generally little or no annual cycle of temperature, so seasonality does not influence warming or cooling. Second, permafrost serves as a vehicle for transferring atmospheric temperature changes to the hydrological and biological components of the earth system. For example, the presence of permafrost significantly alters surface and subsurface water fluxes, as well as vegetative functions. Third, changes in permafrost can feed back to climate change through the release of trace gases such as CO2 and methane (CH4), linking climate change in the Arctic to global climate change[6].
The active layer is the seasonally thawed layer overlying permafrost. Most biogeochemical and hydrological processes in permafrost are confined to the active layer, which varies from several tens of centimeters to one to two meters in depth. The rate and depth of active-layer thaw are dependent on heat transfer through layers of snow, vegetation, and organic soil. Snow and vegetation (with the underlying organic layer) have low thermal conductivity and attenuate annual variations in air temperature.
During summer, the thermal conductivity of the organic layer and vegetation is typically much smaller than in winter. This leads to lower heat fluxes in summer and ultimately keeps permafrost temperatures lower than they would be in the absence of vegetation and the organic layer. The latent heat associated with evapotranspiration and with melting and freezing of water further complicates the thermodynamics of the active layer. Over longer timescales, the thawing of deep permafrost layers can lag considerably (decades or centuries) behind a warming of the surface because of the large latent heat of fusion of ice[7]. Moreover, thermal conductivity is typically 20 to 35% lower in thawed mineral soils than in frozen mineral soils. Consequently, the mean annual temperature below the level of seasonal thawing can be 0.5 to 1.5°C lower than on the ground surface.
Thawing of permafrost can lead to subsidence of the ground surface as masses of ground ice melt, and to the formation of uneven topography known as hermokarst. The development of thermokarst in some areas of warm and discontinuous permafrost in Alaska has transformed some upland forests into wetlands[8]. Recent thaw subsidence has also been reported in areas of Siberia[9] and Canada[10]. Climate-induced thermokarst and thaw subsidence may have detrimental impacts on infrastructure built upon permafrost[11], as Section 16.3 (Permafrost in the Arctic) discusses in more detail. Permafrost degradation can also pose a serious threat to arctic biota through either oversaturation or drying[12]. The abundance of ground ice is a key factor in subsidence, such that areas with little ice (e.g., the Canadian Shield or Greenland bedrock masses) will suffer fewer subsidence effects when permafrost degrades.
Seasonal soil freezing and thawing are the driving forces for many surficial processes that occur in areas with permafrost or seasonally frozen soils. Cryoturbation, a collective term for local vertical and lateral movements of the soil due to frost action, is one of these potentially important cryogenic processes (see Washburn[13] for a review). Cryoturbation typically occurs in the permafrost zone, but also occurs in soils that freeze only seasonally. Cryoturbation can cause the downward displacement of organic material from the near-surface organic horizons to the top of the permafrost table, resulting in sequestration of organic carbon in the upper permafrost layer[14]. During the past several thousand years, a significant amount of organic carbon has accumulated in permafrost due to this process.
Recent and ongoing changes (6.6.1.2)
 Fig. 6.22. Simulated mean annual ground temperature at Fairbanks (Bonanza Creek), Alaska, from 1930 to 2003[15].
 Because surface [[temperature]s] are increasing over most permafrost areas (Section 2.6.2 (Permafrost in the Arctic)), permafrost is receiving increased attention within the context of past and present climate variability. Measurements of ground temperature in Canada, Alaska, and Russia have produced a generally consistent picture of permafrost warming over the past several decades. Lachenbruch and Marshall[16] were among the first to document systematic warming by using measurements from permafrost boreholes in northern Alaska to show that the surface temperature increased by 2 to 4°C between the beginning of the 20th century and the mid-1980s. Measurements conducted by Clow and Urban[17] in the same Alaska borehole network indicated further warming of about 3°C since the late 1980s. Figure 6.22 confirms this warming with results from a site-specific permafrost model driven by observed air temperatures and snow depths for the period 1930 to 2003, calibrated using measurements of permafrost temperatures between 1995 and 2000. While warming has predominated since 1950, considerable interannual variability is also apparent.
Data from northwestern Canada, indicating that temperatures in the upper 30 m of permafrost have increased by up to 2°C over the past 20 years[18], provide further evidence of warming. Although cooling of permafrost in the Ungava Peninsula of eastern Canada in recent decades has been widely cited as an exception to the dominant warming trend, Brown J. et al.[19] and Allard et al.[20] indicated that shallow permafrost temperatures in the region have increased by up to nearly 2°C since the mid-1990s. Smith et al.[21] reported warming in the upper 30 m of permafrost in the Canadian High Arctic since the mid-1990s. Smaller temperature increases, averaging 1°C or less, have been reported in northwestern Siberia[22]. Measurements from a network of recently drilled boreholes in mountainous areas of Europe indicate warming of a degree or less[23], while Isaksen et al.[24] have reported warming of Scandinavian permafrost. Table 6.8 summarizes recent trends in permafrost temperatures in terms of region, time period, and the approximate temperature change over the period of record. In general, the changes in permafrost temperature are consistent with other environmental changes in the circumpolar Arctic[25].
Most of the boreholes mentioned in this section are included in an emerging system for comprehensive monitoring of permafrost [[temperature]s] (Fig. 6.21), the Global Terrestrial Network for Permafrost (GTN-P), established with the assistance of the International Permafrost Association. Burgess et al.[26] provide an overview of the GTN-P.
|
Table 6.8. Recent trends in permafrost temperature[27]. | ||||
|
Region |
Depth (m) |
Period of record |
Permafrost temperature changea (°C) |
Reference |
|
United States | ||||
|
Trans-Alaska pipeline route |
20 |
1983–2000 |
+0.6 to +1.5 |
|
|
Barrow Permafrost Observatory |
15 |
1950–2001 |
+1 |
|
|
Russia | ||||
|
East Siberia |
1.6–3.2 |
1960–1992 |
+0.03/yr |
|
|
Northwest Siberia |
10 |
1980–1990 |
+0.3 to +0.7 |
|
|
European north of Russia, continuous permafrost zone |
6 |
1973–1992 |
+1.6 to +2.8 |
|
|
European north of Russia, discontinuous permafrost zone |
6 |
1970–1995 |
up to +1.2 |
|
|
Canada | ||||
|
Alert, Nunavut |
15–30 |
1995–2000 |
+0.15/yr |
|
|
Northern Mackenzie Basin, Northwest Territories |
28 |
1990–2000 |
+0.1/yr |
|
|
Central Mackenzie Basin, Northwest Territories |
15 |
1985–2000 |
+0.03/yr |
|
|
Northern Québec |
10 |
late 1980s–mid-1990s |
-0.1/yr |
|
|
Norway | ||||
|
Juvvasshøe, southern Norway |
~5 |
past 60–80 years |
+0.5 to +1.0 |
|
|
Svalbard | ||||
|
Janssonhaugen |
~5 |
past 60–80 years |
+1 to +2 |
|
|
aTemperature change over period of record, unless otherwise noted. | ||||
Projected changes (6.6.1.3)
At present, land-surface parameterizations used in global climate models such as those designated by the Arctic Climate Impact Assessment (ACIA) (Section 4.2.7 (Permafrost in the Arctic)) do not adequately resolve the soil, and the models do not archive the soil output needed to assess changes in permafrost distribution and active-layer characteristics. The more viable approach to date has been the use of AOGCM output as input to soil modules run in an off-line mode, often in combination with baseline climatic data obtained from meteorological observations[40]. This section summarizes results from several studies that used this approach with output from the ACIA-designated models to show spatially distributed fields of projected changes in permafrost for three different times in the 21st century.
Circumpolar projections
At the circumpolar scale, climate change can be expected to reduce the area occupied by frozen ground and to cause shifts between the zones of continuous, discontinuous, and sporadic permafrost, comparable to the changes that occurred during warm epochs in the past[41]. Such changes can be projected using a relatively simple frost-index-based model of permafrost driven by scenarios of climate change. Anisimov and Nelson[42] used this method to calculate areas occupied by near-surface permafrost in the Northern Hemisphere under present-day climatic conditions and climatic conditions projected for the 2041– 2060 time slice. Scenarios of climate change used in these calculations were based on the results from several transient and equilibrium experiments with general circulation models. These results have been updated[43] using output from the five ACIA-designated models (Section 4.4 (Permafrost in the Arctic)). Table 6.9 presents projections of the area occupied by different permafrost zones in 2030, 2050, and 2080. Results for 2030 rather than 2020 are shown because the latter show little change from present-day distributions.
|
Table 6.9. Projected area occupied by permafrost zones in 2030, 2050, and 2080 calculated using output from the five ACIA-designated models. | |||||
|
Total permafrost |
Continuous permafrost | ||||
|
Area (106 km2) |
% of present-day value |
Area (106 km2) |
% of present-day value | ||
|
CGCM2 |
2030 |
23.72 |
87 |
9.83 |
79 |
|
2050 |
21.94 |
81 |
8.19 |
66 | |
|
2080 |
20.66 |
76 |
6.93 |
56 | |
|
ECHAM4/OPYC3 |
2030 |
22.30 |
82 |
9.37 |
75 |
|
2050 |
19.31 |
71 |
7.25 |
58 | |
|
2080 |
17.64 |
65 |
5.88 |
47 | |
|
GFDL-R30_c |
2030 |
24.11 |
89 |
10.19 |
82 |
|
2050 |
22.38 |
82 |
8.85 |
71 | |
|
2080 |
20.85 |
77 |
7.28 |
59 | |
|
HadCM3 |
2030 |
24.45 |
90 |
10.47 |
84 |
|
2050 |
23.07 |
85 |
9.44 |
76 | |
|
2080 |
21.36 |
78 |
7.71 |
62 | |
|
CSM_1.4 |
2030 |
24.24 |
89 |
10.69 |
86 |
|
2050 |
23.64 |
87 |
10.06 |
81 | |
|
2080 |
21.99 |
81 |
9.14 |
74 | |
The projected reductions in the area occupied by near-surface permafrost (the uppermost few meters of frozen ground; conditions in the deeper layers are not addressed in these projections) vary substantially depending on the scenario used, indicating that the uncertainties in the forcing data are large. Among the five model scenarios, the two outliers are the ECHAM4/OPYC3-based scenario, which projects the greatest contraction of the area occupied by near-surface permafrost, and the CSM_1.4 scenario that projects only modest changes. Projections from the three other scenarios (CGCM2, GFDL-R30_c, and HadCM3) are relatively close to each other. According to the "median" GFDL-R30_c-based scenario, the total area occupied by near-surface permafrost is projected to decrease by 11, 18, and 23% by 2030, 2050, and 2080, respectively. The projected contractions of the continuous near-surface permafrost zone for the same years are 18, 29, and 41%, respectively. Figure 6.23 shows the projected changes in the distribution of permafrost zones (continuous and sporadic/discontinuous) calculated using output for 2030, 2050, and 2080 from the five ACIA-designated models.
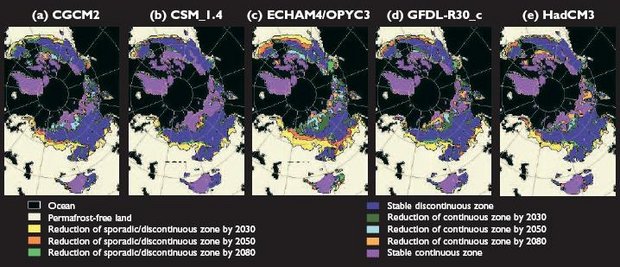 Fig. 6.23. Projected circumpolar change in the distribution of permafrost zones (sporadic/discontinuous and continuous) based on scenarios from the five ACIA-designated models: (a) CGCM2; (b) CSM_1.4; (c) ECHAM4/OPYC3; (d) GFDL-R30_c; and (e) HadCM3[44].
 A progressive increase in the depth of seasonal thawing could be a relatively short-term reaction to climate change in permafrost regions, since it does not involve any lags associated with the thermal inertia of the climate/permafrost system. One of the most successful and frequently used approaches to active-layer mapping is based on semi-empirical methods developed primarily for the practical needs of cold-regions engineering, but adjusted for use at the hemispheric scale. The fundamentals of these methods were formulated by Russian geocryologists[45] and have been used by other investigators[46]. Monthly temperature and precipitation simulated by the ACIA-designated models for baseline (1981–2000) and year 2050 climate conditions were used as input to the Kudryavtsev[47] model to calculate projected changes in seasonal thaw depth during the first half of the 21st century (Fig. 6.24). The projected increases in active-layer depth range from 0 to 20% to more than 50%.
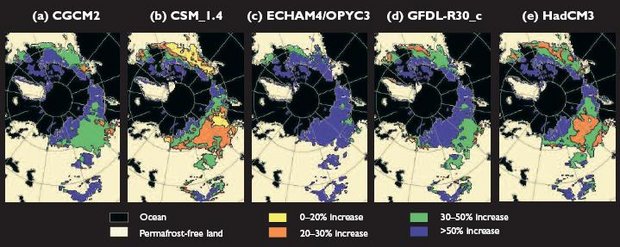 Fig. 6.24. Projected change in active-layer depth between 1981–2000 and 2050, calculated using output from the five ACIA-designated models: (a) CGCM2; (b) CSM_1.4; (c) ECHAM4/OPYC3; (d) GFDL-R30_c; and (e) HadCM3[48].
 The calculations require several assumptions about soil, organic layer, vegetation, and snow-cover properties[49]. Digital representation of soil properties for each cell was obtained from the Global Ecosystems Database[50]. Over much of the permafrost area, the calculations were made for silt covered with a 10 cm organic layer. The calculations assume that vegetation does not change as temperatures increase, although a study by Anisimov and Belolutskaia[51] indicates that climate-induced vegetation changes are likely to both largely offset the effects of warming in the northernmost permafrost regions and enhance the degradation of sporadic and discontinuous permafrost. The projected changes represent the behavior of permafrost with highly generalized properties averaged over 0.5° by 0.5° grid cells. Owing to the effects of local environmental factors, including topography and vegetation variations, seasonal thaw depth is characterized by pronounced spatial and temporal variability that cannot be resolved at the scale of the model calculations. More details on the spatial variability of environmental features, including low-level vegetation, would improve the spatial accuracy of the projected changes in permafrost[52].
The maps in Fig. 6.24 provide a broad picture of the projected hemispheric-scale changes in seasonal thaw depth under changing climate conditions. These projections are generally consistent with the results obtained from the more detailed regional studies for Alaska and Siberia. Although the results of the calculations are model-specific, there is a general consensus among the models that seasonal thaw depths are likely to increase by more than 50% in the northernmost permafrost locations (including much of Siberia, the Far East, the North Slope of Alaska, and northern Canada) and by 30 to 50% in most other permafrost regions. Table 6.10 shows, by region, the range of changes in mean annual air temperature, permafrost temperature, and depth of seasonal thaw projected to occur between 1981–2000 and 2050 by the ACIA-designated models.
|
Table 6.10. Projected regional increases in mean annual air temperature (?Ta), permafrost temperature (?Ts), and depth of seasonal-thaw (?Z) between 1981–2000 and 2050, calculated using output from the five ACIA-designated models. | |||
|
?Ta (°C) |
?Ts (°C) |
?Z (%) | |
|
Arctic coast of Alaska and Canada |
2.0–3.0 |
2.0–2.5 |
?50 |
|
Central Canada |
1.5–2.5 |
1.0–2.0 |
?30 |
|
West coast of Canada |
1.0–2.0 |
0.5–1.5 |
?10 |
|
Northern Scandinavia |
1.5–2.0 |
1.0–2.0 |
?10 |
|
Siberia |
2.0–3.0 |
2.0–2.5 |
?50 |
|
Yakutia |
1.5–2.5 |
1.5–2.0 |
?30 |
|
Russian Arctic coast |
2.0–3.0 |
2.0–2.5 |
?50 |
Regional projections
This section describes regional projections that were generated by soil models run at high resolution for an area in which relatively detailed information on soil properties was available. The soil information included soil temperatures used for model calibration. While this section presents results for northern Alaska, model-based evaluations of the sensitivities of permafrost to warming in other areas, including Canada, are also available[53].
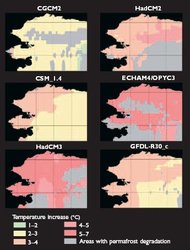 Fig. 6.25. Mean annual ground temperature increase in northern Alaska between 2000–2010 and 2100 projected by a soil model forced with output from the ACIA-designated models. A reference case using forcing from the HadCM2 model is shown at the upper right[54].
 Detailed projections of future changes in permafrost in northern Alaska were obtained from a soil model[55] calibrated using observational data from three sites on the North Slope of Alaska. The two major types of vegetation in northern Alaska are tundra and taiga (boreal forest). Permafrost is continuous north of the Brooks Range and discontinuous in much of Interior Alaska to the south. Permafrost is >600 m thick in northern areas but is only one to several meters thick near its southern limits. In the lowlands of the southern discontinuous zone, where the mean annual air temperature ranges from -7 to 0°C, the temperature of the permafrost below the layer of seasonal temperature variation ranges from -5 to -1°C. In the continuous permafrost zone north of the Brooks Range, permafrost temperatures typically range from -11 to -4°C.
Surface air temperature and snow-cover projections from the five ACIA-designated climate models and the older HadCM2 model[56], forced with the B2 emissions scenario (Section 4.4.1 (Permafrost in the Arctic)), were used as input to the soil model to project the active-layer and mean annual ground-temperature dynamics in northern Alaska between 2000 and 2100. The across-model average projected increase in mean annual air temperature between 2000 and 2100 ranges from 8 to 10°C in the north to 4 to 6°C in the southern part of the region.
In the central and northern areas of Alaska, projected increases in mean annual ground [[temperature]s] between 2000–2010 and 2100 range from 1 to 2°C using the CGCM2 climate scenario to 5°C using the HadCM3 and ECHAM4/OPYC3 scenarios (Fig. 6.25). The HadCM3, HadCM2, and ECHAM4/OPYC3 scenarios generate significant projected increases in mean annual ground temperatures over the entire area.
An analysis of the maximum active-layer thickness was also performed. All the scenarios project that, by 2100, the active-layer thickness is likely to increase by up to 1 m in areas occupied by coarse-grained material and rocks with high thermal conductivity, and by up to 0.5 m throughout the rest of the region (Fig. 6.26). The HadCM2, HadCM3, and ECHAM4/OPYC3 scenarios generate the greatest projected increases in active-layer thickness.
By 2100, all the scenarios except for the CSM_1.4 project that a zone with permafrost degradation (failure of some portion of the former active layer to refreeze during winter) will exist in northern Alaska (Fig. 6.26). The HadCM2 and GFDL-R30_c scenarios project that this zone will occupy the southeastern part of the modeled area. The HadCM2 scenario projects a relatively constant increase in this zone throughout the years, with almost one-third of the modeled area degraded by 2100. The ECHAM4/OPYC3 scenario projects the second largest zone of degradation by 2100, but the development of this zone throughout the century is not uniform. The CGCM2 scenario projects that this zone will be located in the southeastern and central parts of the modeled area and in the Brooks Range. The HadCM3 and ECHAM4/OPYC3 scenarios project that the zone will occupy the southeastern and southwestern parts of the modeled area and some parts of the Brooks Range (the eastern part in HadCM3, the western part in ECHAM4/OPYC3). The GFDL-R30_c scenario projects that the zone of permafrost degradation will occupy less than 5 to 7% of the modeled area. The CSM_1.4 scenario is an outlier in that it projects no permafrost degradation between 2000 and 2100.
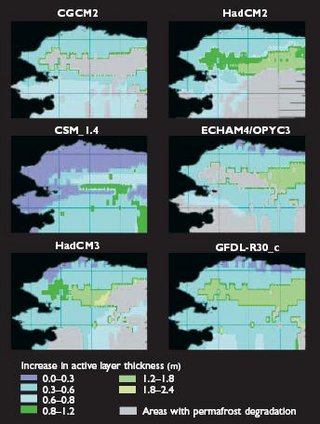 Fig. 6.26. Increase in active-layer thickness in northern Alaska between 2000 and 2100 projected by a soil model forced with output from the ACIA-designated models. A reference case using forcing from the HadCM2 model is shown at the upper right[57].
 Similar dependencies on climate model forcing scenarios have been found by Malevsky-Malevich et al.[58], who used output from the same climate models to drive a different type of soil model. The results of these simulations showed that the projected active-layer response in Siberia would be greater in southern and western regions than in eastern and northern regions, indicating the potential importance of snow cover to projections of permafrost change[59]. The decrease in snow-cover duration is projected to be greater in southern and western Siberia than in northern and eastern Siberia, and greater in the spring season (Section 6.4 (Permafrost in the Arctic)) when insolation is relatively high.
The scenarios of permafrost change clearly vary with the choice of climate model, and they contain many examples of decadal-scale variations that can complicate the detection of change. Nevertheless, the projected changes are substantial in nearly all cases, and terrestrial permafrost is likely to remain one of the more useful indicators of global change because large regions of the arctic terrestrial system now have mean annual [[temperature]s] close to 0°C.
Impacts of projected changes (6.6.1.4)
On other parts of the physical system
Projected climate change is very likely to increase the active-layer thickness and the thawing of permafrost at greater soil depths. The impacts of permafrost degradation include changes in drainage patterns and surface wetness resulting from subsidence and thermokarst formation, especially where soils are ice-rich. Thawing of ice-rich permafrost can trigger mass movements on slopes, and possibly increase sediment delivery to water-courses. Thawing of permafrost in peatlands and frozen organic matter sequestered by cryoturbation is likely to accelerate biochemical decomposition and increase the GHGs released into the atmosphere.
On ecosystems
Changes in surface drainage and wetness are likely to result in vegetative changes (e.g., shallow-rooted versus deeper-rooted vegetation, changes in plant density); the development of thermokarst has transformed some upland forests into extensive wetlands. Microbial, insect, and wildlife populations are likely to evolve over time as soil drainage and wetness change (Section 7.4.1 (Permafrost in the Arctic)). Changes in drainage resulting from changes in the distribution of permafrost are also likely to affect terrestrial ecosystems, and will determine the response of peatlands and whether they become carbon sources or sinks (section 7.5.3]).
On people
Permafrost degradation is likely to cause instabilities in the landscape, leading to surface settlement and slope collapse, which may pose severe risks to infrastructure (e.g., buildings, roads, pipelines). The possibilities for land use change with soil wetness. Offshore engineering (e.g., for resource extraction) is highly affected by coastal permafrost and its degradation (Section 16.3.10 (Permafrost in the Arctic)). Containment structures (e.g., tailing ponds, sewage lagoons) often rely on the impermeable nature of frozen ground; thawing permafrost would reduce the integrity of these structures. Over the very long term, the disappearance of permafrost coupled with infrastructure replacement will eliminate many of the above concerns.
Critical research needs (6.6.1.5)
In order to improve the credibility of model projections of future permafrost change throughout the Arctic, the soil/vegetation models must be validated in a more spatially comprehensive manner. In particular, there is a need for intercomparison of permafrost models using the same input parameters and standardized measures for quantifying changes in permafrost boundaries. Global models do not yet use such regionally calibrated permafrost models, nor do they treat the upper soil layers in sufficient detail to resolve the active layer. The need for additional detail is particularly great for areas with thin permafrost (e.g., Scandinavia). Enhanced model resolution, and validation and calibration at the circumpolar scale, will be necessary before fully coupled simulations by global models will provide the information required for assessment activities such as the ACIA.
There is likely to be a significant linkage between changes in terrestrial permafrost and the hydrology of arctic drainage basins. Long-term field data are required to increase understanding of permafrost–climate interactions and the interaction between permafrost and hydrological processes, and for model improvement and validation. The active-layer measurements from the Circumpolar Active Layer Monitoring Program and the borehole measurements from the GTN-P will be especially valuable in this regard, if the numbers of sites are increased.
Coastal and subsea permafrost (6.6.2)
Background (6.6.2.1)
The terms subsea (or offshore) and coastal permafrost refer to geological materials that have remained below 0°C for two or more years and that occur at or below sea level. At present, the thermal regime of subsea permafrost is controlled partially or completely by seawater temperature. Subsea permafrost has formed either in response to negative mean annual sea-bottom temperatures or as the result of inundation of terrestrial permafrost. Coastal permafrost includes the areas of permafrost that are near a coastline (offshore or onshore) and that are affected, directly or indirectly, by marine processes. Direct marine influences include seawater temperature, sea-ice action, storm surges, wave action, and tides. Indirect marine influences include the erosion of cliffs and bluffs. This review focuses on those parts of the permafrost environment found below the storm tide line, since the thermal and chemical environments that affect them are substantially different from those affecting terrestrial permafrost.
The development and properties of subsea permafrost are largely dependent on the detailed history of postglacial relative sea level. Coastal permafrost conditions are influenced by a range of oceanographic and meteorological processes, ranging from sea-ice thickness to storm-surge frequency. During the transition from terrestrial to submarine, permafrost is subjected to a set of intermediary environments that affect its distribution and state.
Based on the strict definition above, not all permafrost is frozen, since the freezing point of sediments may be depressed below 0°C by the presence of salt or by capillary effects in fine-grained material. In the marine environment, non-frozen materials do not present serious problems for engineering activities, so modifiers are used to further define frozen permafrost as either ice-bonded, ice-bearing, or both[60]. Ice-bearing material refers to permafrost or seasonally frozen sediments that contain some ice. Ice-bonded sediments are mechanically cemented by ice. While the ice component of permafrost usually consists of pore or interstitial ice that fills the small spaces between individual grains of sand, silt, or gravel, it sometimes occurs in much larger forms referred to as "massive ice". Unfrozen fluids may be present in the pore spaces in both ice-bearing and ice-bonded materials. As with terrestrial permafrost, some subsea permafrost has an active (seasonally thawed) layer. Hubberten and Romanovskii[61] discussed the characteristics of permafrost in one particular offshore environment, the Laptev Sea.
 Fig. 6.27. Subsea permafrost distribution in the Arctic[62].
 While the stability of terrestrial permafrost depends directly on atmospheric forcing (temperature and precipitation), the effect of atmospheric forcing on the stability of subsea permafrost is a second- or third-order impact mediated through oceanographic and sea-ice regimes. Most subsea permafrost formed during past glacial cycles, when continental shelves were exposed to low mean annual temperatures during sea-level lowstands, thus it is restricted to those parts of the Arctic that were not subjected to extensive glaciation during the Late Quaternary Period[63]. Permafrost that developed on exposed continental shelves during glacial epochs subsequently eroded when sea-level rise submerged the shelves during interglacial warm intervals and regraded the land surface to a quasi-equilibrium seabed profile. Positive mean annual sea-bottom temperatures degrade upland permafrost as it passes through the coastal zone, but with continued sea-level rise, the sea-bottom water temperature falls to negative values and permafrost degradation slows. Thus, in any locality, the distribution of relict subsea permafrost is a function of its original distribution on land, and the depth to ice-bonded or ice-bearing permafrost is a function of the time spent in the zone of positive sea-bottom temperatures along with other variables (e.g., volumetric ice content, salt content, etc.)[64].
Subsea relict permafrost is thought to contain or overlie large volumes of CH4 in the form of gas hydrates at depths of up to several hundred meters. Degradation of gas hydrates resulting from climate change (See Projected changes section below) could increase the flux of CH4 to the atmosphere[65].
A combination of observations and models has been used to estimate the distribution of subsea permafrost (Fig. 6.27). The distribution is largely inferred from glacial extent during the last glacial maximum, water temperature, and the location of the 100 m depth contour (approximate minimum sea level during the past 100,000 years). Narrow zones of coastal permafrost are probably present along most arctic coasts.
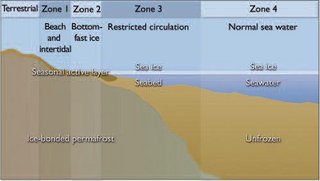 Fig. 6.28. The coastal and offshore permafrost zones[66].
 Coastal and subsea permafrost can be subdivided into four zones (Fig. 6.28), based primarily on water depth and on the dominant processes that operate in those depth zones[67]. Zone 1 covers the inter- and supra-tidal environments of the beaches and flats. Seaward of the intertidal zone, in Zone 2, the seasonal ice cover freezes to the seabed each year, allowing cold winter temperatures to penetrate the water column and reach the sediments. This occurs in water depths of 1.5 to 2 m. Zone 3 covers areas where water depths are too great for the sea ice to freeze to the seabed; however, under-ice circulation may be restricted, with attendant higher salinities and lower seabed temperatures. In Zone 4, "normal" seawater salinity and temperatures prevail, providing a more or less constant regime. Sea-bottom temperatures on the arctic shelves range from -1.5 to -1.8°C; salinities range from 30 to 34[68].
Recent and ongoing changes (6.6.2.2)
There are no ongoing programs to monitor the state of coastal and subsea permafrost, although some effort is being devoted to monitoring the forcing variables and coastal erosion[69] (Table 16.8). Therefore, most publications addressing changes in the state of subsea permafrost are model-based and speculative. Zones 1 and 2 are the most dynamic, especially in locations where erosion is rapid (e.g., the Laptev and Beaufort Sea coasts). In these areas, erosion rates of several meters per year cause a rapid transition from terrestrial to nearshore marine conditions. High rates of erosion caused by exposure to waves and storm surges during the open water season lead to deep thermal notch development in cliffs, block failure in the backshore (area reached only by the highest tides), melting of sea-level-straddling massive ice, and possible offshore thermokarst development[70]. The rate at which destabilization of permafrost in these zones occurs is dependent on the erosion rate, which in turn varies according to storm frequency and severity[71] and the presence or absence of sea ice. The degree to which permafrost destabilization affects erosion remains conjectural. Thaw subsidence in Zones 2 and 3 that accompanies melting of excess ice (ice that is not in thermal equilibrium with the existing soil–ice–air configuration) in the nearshore provides accommodation space for sediments produced by erosion. Thus, there is a potential feedback between high erosion rates and thaw subsidence, but there are few observations to support this hypothesis. An analysis of time series of erosion measurements and environmental forcing (e.g., weather, storms, freeze-thaw cycles) in the Beaufort Sea area did not reveal any trends, but showed pronounced interannual and decadal-scale variability[72].
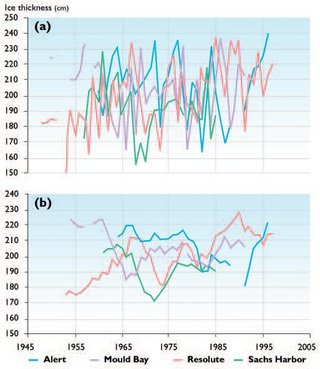 Fig. 6.29. Maximum thickness of landfast ice measured at four coastal locations in the Canadian Arctic, plotted as (a) annual values and (b) five-year moving averages[73].
 Sea-ice thickness plays a major role in the development of subsea permafrost within Zone 2. However, none of the recent analyses of historic data on sea-ice thickness in the Arctic[74] (Section 6.3.2 (Permafrost in the Arctic)) addresses the state of the sea ice that forms very close to the coast[75], since the coastal waters are too shallow for submarines. Time series of ice thickness measurements from several coastal locations extending back to the late 1940s are available from the Canadian Ice Service[76]. Polyakov et al.[77] describe a similar dataset from Russia. Neither dataset shows any trend over the period of record, which is dominated by large interannual fluctuations. Figure 6.29 illustrates the variability in the annual maximum thickness of landfast ice measured at four coastal locations in the Canadian Arctic. Smoothing the data with a five-year moving average reveals some similarities between the stations.
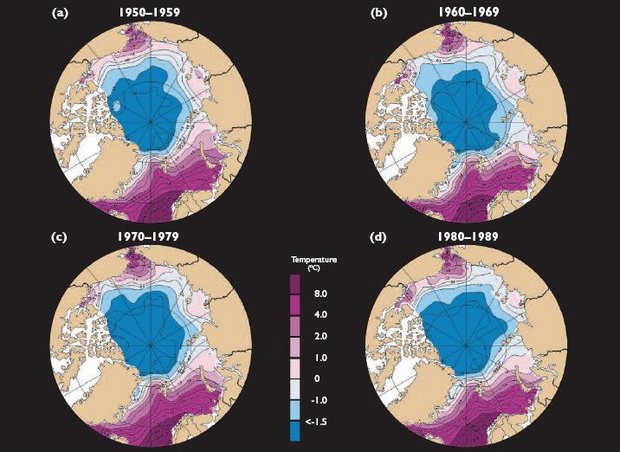 Fig. 6.30. Average decadal summer ocean temperature at 10 m depth from (a) the 1950s to (d) the 1980s[78].
 Air-temperature changes in the Arctic are well documented, and many studies have examined the impact of these changes on the active-layer thickness and temperature of terrestrial permafrost, however, there are no equivalent multi-year studies for coastal permafrost.
Seabed temperature is a critical upper boundary condition for subsea permafrost. Decadally averaged temperatures (1950s–1980s) for various water depths in the Arctic Ocean are available from the National Snow and Ice Data Center in Boulder, Colorado[79]. These data indicate that there have been decadal-scale changes of a degree or more in the temperatures of shallow water, and smaller changes in deeper water (Fig. 6.30). Interdecadal variability is apparent along the Beaufort Shelf (warmer in the 1960s and 1980s) and the Laptev Sea Shelf (cooler in the 1980s).
Projected changes (6.6.2.3)
The stability of coastal and subsea permafrost in a changing climate depends directly on the magnitude of changes in water temperature and salinity, air temperature, sea-ice thickness, and coastal and seabed stability. It is difficult to extract the relevant projections of environmental forcing (subsurface and seabed water temperatures in particular) from any of the scenarios generated by climate models. In general terms:
- The projected increase in air temperature (Section 4.4.2 (Permafrost in the Arctic)) is likely to increase backshore thermokarst development, resulting in more rapid input of material to, and sediment deposition in, the coastal environment. Increased air temperatures will also tend to increase permafrost instability in Zone 1, especially in the supra-tidal environment, and will probably result in increased coastal water temperatures. These factors, coupled with decreased sea-ice thickness, are likely to cause more rapid warming of permafrost in Zones 1 and 2.
- Projected increases in sea level (Section 6.9.3 (Permafrost in the Arctic)) are likely to shift the location of Zones 1 and 2 to higher elevations, resulting in increased rates of erosion and attendant increases in instability of coastal permafrost.
- Longer open-water seasons, resulting from projected decreases in sea ice cover (Section 6.3.3 (Permafrost in the Arctic)), are likely to expose coastal environments to more storms, resulting in increased rates of backshore erosion. This will lead to higher rates of nearshore deposition in localized areas, with attendant possible permafrost aggradation[80]. However, rapid backshore erosion is also likely to increase the rate at which terrestrial permafrost is exposed to coastal conditions, leading to warming of terrestrial permafrost in the backshore environment.
- Projected changes in fluvial inflow patterns (Section 6.8.3 (Permafrost in the Arctic)) are likely to change the nearshore and coastal salinity and temperature regimes. Lower flow rates and changes in the timing and duration of floods will affect rates of erosion and deposition, and also the salinity and temperature of the coastal ocean. Higher water temperatures will increase permafrost destabilization; lower flow rates could result in higher coastal salinity, which also would increase rates of permafrost thaw.
- Changes in the thickness and extent of sea ice are likely to affect Zone 3 in that there may be less restriction of circulation as sea-ice conditions become less severe. This would inhibit brine formation in bays, reducing rates of permafrost thawing by an unknown amount. Changing sea-ice regimes will also affect pressure-ridge development, which will change under-ice circulation, but the direction of change is uncertain. It is likely that the effects will be local.
- Changes in sea-bottom water temperature and salinity could possibly occur in Zones 3 and 4, although most AOGCMs do not explicitly project values for these variables. Thawed sediments above the permafrost surface will buffer the effect: a change of 1°C would take several decades to propagate from the seabed surface to the upper permafrost boundary 10 to 100 m below the seabed surface[81]. Gas hydrates within and beneath the subsea permafrost will also be buffered from the immediate effects of changing seabed conditions and in the near term may be relatively unaffected. Over longer time periods (100 years or more), there is potential for increased instability of subsea gas hydrates in shallow waters of the Arctic. In water deeper than 200 m, other gas hydrates (unrelated to permafrost) that are also susceptible to destabilization by increased bottom:water temperatures may exist close to the seabed surface.
Impacts of projected changes (6.6.2.4)
On other parts of the physical system
Decreases in the stability of coastal permafrost are likely to result in greater nearshore thaw subsidence and increased rates of coastal erosion. This will introduce greater sediment loads to the coastal system; higher levels of suspended sediment and changes in depositional patterns may ensue. Increased erosion rates will also result in greater emissions of CO2 from coastal and nearshore sources, and increased emission rates of CH4 from terrestrial permafrost. Over the long-term, destabilization of intra-permafrost gas hydrates is likely to enhance climate change.
On ecosystems
Changing deposition patterns and suspended sediment loads along the coast are likely to have impacts on marine ecosystems, including anadromous fish migration, phytoplankton blooms, and benthic communities. Negative or positive impacts are possible. Increased suspended material may increase nutrients, resulting in higher productivity in nutrient-limited systems. Conversely, increased suspended material lowers light levels, resulting in lower productivity. The potential impacts of changes in subsea and coastal permafrost on marine ecosystems are discussed further in Chapter 9 (Permafrost in the Arctic).
On people
Decreases in the stability of coastal permafrost will have an impact on coastal infrastructure. Increased erosion rates, caused in part by nearshore thaw subsidence, are likely to affect communities and industrial facilities situated close to the coast. Permafrost thawing and subsidence could affect pipelines in nearshore and coastal environments in excess of their design specifications. Warming and/or thawing permafrost is likely to reduce the foundation strength of wharves and associated pilings.
In deeper water (Zones 3 and 4), permafrost warming could affect design considerations for hydrocarbon production facilities, including casing strings and platforms anchored to the seabed. Chapter 16 addresses specific infrastructure issues associated with changes in coastal permafrost.
Critical research needs (6.6.2.5)
A circumpolar program to monitor changes in the coastal and offshore cryosphere is required, as is a better understanding of the processes that drive those changes. The Arctic Coastal Dynamics (ACD) project, sponsored by the International Arctic Science Committee and the International Permafrost Association, is promoting the need for such studies. At present, there is no monitoring of coastal and subsea permafrost, and this lack represents a critical gap in the understanding of coastal stability in the Arctic. The absence of monitoring is a result of the difficulty in working in arctic coastal environments, particularly in Zones 1 and 2. Equipment for measuring temperatures throughout the year must be placed in such a way that cables are not jeopardized by storms and sea ice. The technology exists, but it is more expensive than that used for similar measurements on land.
A comprehensive understanding of coastal permafrost processes, including the interaction between storms and permafrost, is needed. Heat convection is thought to play a major role in coastal permafrost thawing during storms after the thawed overlying material is removed[82]. However, given the difficulty of making measurements at the shoreline under storm conditions, there are no observations supporting this hypothesis. Laboratory studies could play a role in this regard. Thaw subsidence rates can exceed the rate of eustatic sea-level rise (rise due to changes in the mass of ocean water, see Section 6.9.1 (Permafrost in the Arctic)), and are therefore thought to contribute to coastal erosion, at least at a local scale. However, there are few documented observations of the magnitude of thaw subsidence and/or its role in coastal erosion.
The role of brine exclusion and convection in enhancing coastal and subsea permafrost degradation requires further investigation.
Finally, the gas hydrates in coastal and subsea permafrost require further study in order to evaluate their stability over the range of future climate change scenarios produced by climate models.
Chapter 6: Cryosphere and Hydrology
6.1. Introduction (Permafrost in the Arctic)
6.2. Precipitation and evapotranspiration
6.3. Sea ice (Sea ice in the Arctic)
6.4. Snow cover
6.5. Glaciers and ice sheets
6.6. Permafrost
6.7. River and lake ice
6.8. Freshwater discharge
6.9. Sea-level rise and coastal stability
References
Citation
Committee, I. (2012). Permafrost in the Arctic. Retrieved from http://editors.eol.org/eoearth/wiki/Permafrost_in_the_Arctic- ↑ Sharkhuu, N., 2003. Recent changes in permafrost of Mongolia. Proceedings of the Eighth International Conference on Permafrost, pp. 1029–1034.
- ↑ Anisimov, O. A. and F.E. Nelson, 1997. Permafrost zonation and climate change: Results from transient general circulation models. Climatic Change, 35:241–258.–Zhang,T., J. A. Heginbottom, R.G. Barry and J. Brown, 2000. Further statistics on the distribution of permafrost and ground ice in the Northern Hemisphere. Polar Geography, 24(2):125–131.
- ↑ Brown, J., O.J. Ferrians Jr., J. A. Heginbottom and E.S. Melnikov, 1998. Circum-Arctic Map of Permafrost and Ground-Ice Conditions. National Snow and Ice Data Center/World Data Center for Glaciology, Boulder, Colorado. Digital Media.
- ↑ Romanovsky, V.E., M. Burgess, S. Smith, K. Yoshikawa and J. Brown, 2002. Permafrost temperature records: Indicators of climate change. Eos,Transactions, American Geophysical Union, 83:589–594.
- ↑ Anisimov, O. A. and B. Fitzharris, 2001. Polar Regions (Arctic and Antarctic). In: J. McCarthy, O. Canziani, N. A. Leary, D.J. Dokken and K.S. White (eds.). Climate Change 2001: Impacts, Adaptation, and Vulnerability, pp. 801–841. Contribution of Working Group II to the Third Assessment Report of the Intergovernmental Panel on Climate Change. Cambridge University Press.
- ↑ Anisimov, O. A. and F.E. Nelson, 1997. Permafrost zonation and climate change: Results from transient general circulation models. Climatic Change, 35:241–258.–Fukuda, M., 1994. Methane flux from thawing Siberian permafrost (ice complexes) results from field observations. Eos,Transactions, American Geophysical Union, 75:86.
- ↑ Riseborough, D. W., 1990. Soil latent heat as a filter of the climate signal in permafrost. In: Proceedings of the Fifth Canadian Permafrost Conference, Université Laval, Quebec, Collection Nordicana No. 54, pp. 199–205.
- ↑ Osterkamp, T.E., L. Viereck, Y. Shur, M. T. Jorgenson, C. Racine, A. Doyle and R.D. Boone, 2000. Observations of thermokarst and its impact on boreal forests in Alaska, U.S. A. Arctic, Antarctic and Alpine Research, 32:303–315.
- ↑ Fedorov, A.N., 1996. Effects of recent climate change on permafrost landscapes in central Sakha. Polar Geography, 20:99–108.
- ↑ Smith, S.L., M.M. Burgess and F.M. Nixon, 2001. Response of active-layer and permafrost temperatures to warming during 1998 in the Mackenzie Delta, Northwest Territories and at Canadian Forces Station Alert and Baker Lake, Nunavut. Geological Survey of Canada Current Research 2001-E5, 8pp.
- ↑ Anisimov, O. A. and M. A. Belolutskaia, 2002. Assessment of the impacts of climate change and degradation of permafrost on infrastructure in the northern Russia. Meteorology and Hydrology, 9:15–22. (In Russian)–Nelson, F.E., 2003. Geocryology: (Un)frozen in time. Science, 299:1673–1675.–Nelson, F.E., O. A. Anisimov and N.I. Shiklomanov, 2001. Subsidence risk from thawing permafrost. Nature, 410:889–890.
- ↑ Callaghan, T. V. and S. Jonasson, 1995. Implications for changes in Arctic plant biodiversity from environmental manipulation experiments. In: F.S. Chapin III and C.H. Korner (eds.). Arctic and Alpine Biodiversity: Patterns, Causes and Ecosystem Consequences, pp. 151–164. Springer-Verlag.
- ↑ Washburn, A.L., 1956. Classification of patterned ground and review of suggested origins. Geological Society of America Bulletin, 67:823–865.
- ↑ Williams, P.J. and M. W. Smith, 1989. The Frozen Earth: Fundamentals of Geocryology. Cambridge University Press, 306pp.
- ↑ Romanovsky,V., 2003, 2004. Geophysical Institute, University of Alaska, Fairbanks.
- ↑ Lachenbruch, A.H. and B. V. Marshall, 1986. Changing climate: geothermal evidence from permafrost in the Alaskan Arctic. Science, 234:689–696.
- ↑ Nelson, F.E., 2003. Geocryology: (Un)frozen in time. Science, 299:1673–1675.
- ↑ Couture, R., S. Smith, S.D. Robinson, M.M. Burgess and S. Solomon, 2003. On the hazards to infrastructure in the Canadian North associated with thawing of permafrost. Proceedings of Geohazards 2003, Third Canadian Conference on Geotechnique and Natural Hazards, pp. 97–104. Canadian Geotechnical Society.–Nelson, F.E., 2003. Geocryology: (Un)frozen in time. Science, 299:1673–1675.
- ↑ Brown, J., K.M. Hinkel and F.E. Nelson, 2000. The Circumpolar Active Layer Monitoring (CALM) program: Research designs and initial results. Polar Geography, 24:163–258.
- ↑ Allard, M., B. Wang and J. A. Pilon, 1995. Recent cooling along the southern shore of Hudson Strait, Quebec, Canada, documented from permafrost temperature measurements. Arctic and Alpine Research, 27:157–166.–Nelson, F.E., 2003. Geocryology: (Un)frozen in time. Science, 299:1673–1675.
- ↑ Smith, S.L., M.M. Burgess and A.E. Taylor, 2003. High Arctic permafrost observatory at Alert, Nunavut – analysis of a 23-year data set. Proceedings of the Eighth International Conference on Permafrost, 1073–1078.
- ↑ Chudinova, S.M., S.S. Bykhovets, V. A. Sorokovikov, D. A. Gilichinsky, T-J. Zhang and R.G. Barry, 2003. Could the current warming endanger the status of frozen ground regions of Eurasia? In: W. Haeberli and D. Brandova (eds.). Permafrost. Extended Abstracts reporting current research and new investigation, pp. 21–22. Eighth International Conference on Permafrost, University of Zurich.–Pavlov, A. V. and N.G. Moskalenko, 2002. The thermal regime of soils in the north of western Siberia. Permafrost and Periglacial Processes, 13:43–51.
- ↑ Harris, C. and W. Haeberli, 2003. Warming Permafrost in the Mountains of Europe. World Meteorological Organization Bulletin, 52(3), 6pp.
- ↑ Isaksen, K., P. Holmlund, J.L. Sollid and C. Harris, 2001. Three deep alpine-permafrost boreholes in Svalbard and Scandinavia. Permafrost and Periglacial Processes, 12:13–25.
- ↑ Anisimov, O. A., M. A. Beloloutskaia and V. A. Lobanov, 2003. Observed climatic and environmental changes in the high latitudes of the Northern Hemisphere. Meteorology and Hydrology, 2:18–30. (In Russian)–Serreze, M.C., J.E. Walsh, F.S. Chapin III, T. Osterkamp, M. Dyurgerov,V. Romanovsky,W.C. Oechel, J. Morison,T. Zhang and R.G. Barry, 2000. Observational evidence of recent changes in the northern high-latitude environment. Climatic Change, 46:159–207.
- ↑ Burgess, M.M., S.L. Smith, J. Brown, V. Romanovsky and K. Hinkel, 2000. Global Terrestrial Network for Permafrost (GTNet-P): Permafrost monitoring contributing to global climate observations. Geological Survey of Canada, Current Research 2000-E14, 8pp.
- ↑ Romanovsky,V.E., M. Burgess, S. Smith, K.Yoshikawa and J. Brown, 2002. Permafrost temperature records: Indicators of climate change. Eos,Transactions, American Geophysical Union, 83:589–594.
- ↑ Osterkamp, T.E., 2003. A thermal history of permafrost in Alaska. Proceedings of Eighth International Conference on Permafrost, Zurich, pp. 863–868.–Osterkamp, T.E. and V.E. Romanovsky, 1999. Evidence for warming and thawing of discontinuous permafrost in Alaska. Permafrost and Periglacial Processes, 10(1):17–37.
- ↑ Romanovsky, V.E., M. Burgess, S. Smith, K. Yoshikawa and J. Brown, 2002. Permafrost temperature records: Indicators of climate change. Eos,Transactions, American Geophysical Union, 83:589–594.
- ↑ Romanovsky,V., 2003, 2004. Pers. comm. Geophysical Institute, University of Alaska,Fairbanks.
- ↑ Pavlov, A. V., 1994. Current changes of climate and permafrost in the Arctic and Sub-Arctic of Russia. Permafrost and Periglacial Processes, 5:101–110.
- ↑ Pavlov, A. V., 1994. Current changes of climate and permafrost in the Arctic and Sub-Arctic of Russia. Permafrost and Periglacial Processes, 5:101–110.
- ↑ Oberman, N.G. and G.G. Mazhitova, 2001. Permafrost dynamics in the north-east of European Russia at the end of the 20th century. Norwegian Journal of Geography, 55:241–244.
- ↑ Smith, S.L., M.M. Burgess and A.E. Taylor, 2003. High Arctic permafrost observatory at Alert, Nunavut – analysis of a 23-year data set. Proceedings of the Eighth International Conference on Permafrost, 1073–1078.
- ↑ Couture, R., S. Smith, S.D. Robinson, M.M. Burgess and S. Solomon, 2003. On the hazards to infrastructure in the Canadian North associated with thawing of permafrost. Proceedings of Geohazards 2003, Third Canadian Conference on Geotechnique and Natural Hazards, pp. 97–104. Canadian Geotechnical Society.
- ↑ Couture, R., S. Smith, S.D. Robinson, M.M. Burgess and S. Solomon, 2003. On the hazards to infrastructure in the Canadian North associated with thawing of permafrost. Proceedings of Geohazards 2003, Third Canadian Conference on Geotechnique and Natural Hazards, pp. 97–104. Canadian Geotechnical Society.
- ↑ Allard, M., B. Wang and J. A. Pilon, 1995. Recent cooling along the southern shore of Hudson Strait, Quebec, Canada, documented from permafrost temperature measurements. Arctic and Alpine Research, 27:157–166.
- ↑ Isaksen, K., P. Holmlund, J.L. Sollid and C. Harris, 2001. Three deep alpine-permafrost boreholes in Svalbard and Scandinavia. Permafrost and Periglacial Processes, 12:13–25.
- ↑ Isaksen, K., P. Holmlund, J.L. Sollid and C. Harris, 2001. Three deep alpine-permafrost boreholes in Svalbard and Scandinavia. Permafrost and Periglacial Processes, 12:13–25.
- ↑ Anisimov, O. A. and V. Yu. Poliakov, 2003. GIS assessment of climate-change impacts in permafrost regions. Proceedings of the Eighth International Permafrost Conference, vol. 1, pp. 9–14.
- ↑ Anisimov, O. A., A. A. Velichko, P.F. Demchenko, E. V. Eliseev, I.I. Mokhov and V.P. Nechaev, 2002. Impacts of climate change on permafrost in the past, present, and future. Proceedings of Russian Academy of Science, Physics of Atmosphere and Ocean, 38(7): 23–51.
- ↑ Anisimov, O. A. and F.E. Nelson, 1997. Permafrost zonation and climate change: Results from transient general circulation models. Climatic Change, 35:241–258.
- ↑ Anisimov, O., 2003. Unpubl. data. State Hydrological Institute, St. Petersburg, Russia.
- ↑ Anisimov, O. A. and M. A. Belolutskaia, in press a. Impacts of changing climate on permafrost: predictive modeling approach and evaluation of uncertainties. In: Yu. Izrael (ed.). Problems of Ecological Monitoring and Ecosystems Modeling. Moscow. (In Russian)
- ↑ Garagulya, L.S., 1990. Application of Mathematical Methods and Computers in Investigations of Geocryological Processes. Moscow State University Press, Moscow, 124pp.–Kudryavtsev, V. A., 1974. Fundamentals of Frost Forecasting to Geological Engineering Investigations. Nauka, Moscow, 222pp.
- ↑ Anisimov, O. A., N.J. Shiklomanov and F.E. Nelson, 1997. Effects of global warming on permafrost and active layer thickness: results from transient general circulation models. Global and Planetary Change, 15:61–77.–Romanovsky, V.E. and T.E. Osterkamp, 1995. Interannual variations of the thermal regime of the active layer and near-surface permafrost in northern Alaska. Permafrost and Periglacial Processes, 6:313–335.–Sazonova, T.S. and V.E. Romanovsky, 2003. A model for regional-scale estimation of temporal and spatial variability of active-layer thickness and mean annual ground temperatures. Permafrost and Periglacial Processes, 14(2):125–139.
- ↑ Kudryavtsev, V. A., 1974. Fundamentals of Frost Forecasting to Geological Engineering Investigations. Nauka, Moscow, 222pp.
- ↑ Anisimov, O. A., N.J. Shiklomanov and F.E. Nelson, 1997. Effects of global warming on permafrost and active layer thickness: results from transient general circulation models. Global and Planetary Change, 15:61–77.
- ↑ Anisimov, O. A., N.J. Shiklomanov and F.E. Nelson, 1997. Effects of global warming on permafrost and active layer thickness: results from transient general circulation models. Global and Planetary Change, 15:61–77.
- ↑ Staub, B. and C. Rosenzweig, 1987. Global Gridded Data Sets of Soil Type, Soil Texture, Surface Slope and Other Properties. National Center for Atmospheric Research, Boulder, Colorado. (In digital format available on Global Ecosystem's Database CD, version 1, 1991)
- ↑ Anisimov, O. A. and M. A. Belolutskaia, in press b. Modeling climate-permafrost interaction: effects of vegetation. Meteorology and Hydrology. (In Russian)
- ↑ Smith, S.L. and M.M. Burgess, 1999. Mapping the sensitivity of Canadian permafrost to climate warming. In: M. Tranter, R. Armstrong, E. Brun, G. Jones, M. Sharp and M. Williams (eds.). Interactions Between the Cryosphere, Climate and Greenhouse Gases, pp. 71–80. IAHS Publication No. 256.
- ↑ Smith, S.L. and M.M. Burgess, 1999. Mapping the sensitivity of Canadian permafrost to climate warming. In: M. Tranter, R. Armstrong, E. Brun, G. Jones, M. Sharp and M. Williams (eds.). Interactions Between the Cryosphere, Climate and Greenhouse Gases, pp. 71–80. IAHS Publication No. 256.–Wright, J.F., M. W. Smith and A.E. Taylor, 2000. Potential changes in permafrost distribution in the Fort Simpson and Norman Wells Area. In: L.D. Dyke and G.R. Brooks (eds.). The Physical Environment of the Mackenzie Valley, Northwest Territories: A Base Line for the Assessment of Environmental Change, pp. 197–207. Geological Survey of Canada Bulletin 547.
- ↑ Sazonova, T.S., V.E. Romanovsky, J.E. Walsh and D.O. Sergueev, 2004. Permafrost dynamics in the 20th and 21st centuries along the East Siberian transect. Journal of Geophysical Research, 109, doi:10.1029/2003JD003680.
- ↑ Zhuang, Q., V.E. Romanovsky and A.D. McGuire, 2001. Incorporation of a permafrost model into a large-scale ecosystem model: Evaluation of temporal and spatial scaling issues in simulating soil thermal dynamics. Journal of Geophysical Research, 106(24):33649–33670.
- ↑ Sazonova, T.S. and V.E. Romanovsky, 2003. A model for regional-scale estimation of temporal and spatial variability of active-layer thickness and mean annual ground temperatures. Permafrost and Periglacial Processes, 14(2):125–139.
- ↑ Sazonova, T.S., V.E. Romanovsky, J.E. Walsh and D.O. Sergueev, 2004. Permafrost dynamics in the 20th and 21st centuries along the East Siberian transect. Journal of Geophysical Research, 109, doi:10.1029/2003JD003680.
- ↑ Malevsky-Malevich, S.P., E.K. Molkentin, E.D. Nadyozhina, T. V. Pavlova and O.B. Shklyarevich, 2003. Possible changes of active layer depth in the permafrost areas of Russia in the 21st century. Russian Meteorology and Hydrology, (12):80–88.
- ↑ Stieglitz, M., S.J. Dery, V.E. Romanovsky and T.E. Osterkamp, 2003. The role of snow cover in the warming of arctic permafrost. Geophysical Research Letters, 30(13), doi:10.1029/2003GL017337.
- ↑ Sellman, P. V. and D.M. Hopkins, 1984. Subsea permafrost distribution on the Alaskan Shelf. In: Final Proceedings of the Fourth International Permafrost Conference, 17–22 July 1983, pp. 75–82. National Academy Press,Washington, D.C.
- ↑ Hubberten, H.-W. and N.N. Romanovskii, 2003. The main features of permafrost in the Laptev Sea, Russia – a review. In: M. Phillips (ed.). ICOP 2003: Permafrost. Proceedings of the Eighth International Permafrost Conference, Zurich. pp. 431–436. A. A. Balkema.
- ↑ Brown, J., O.J. Ferrians Jr., J. A. Heginbottom and E.S. Melnikov, 1998. Circum-Arctic Map of Permafrost and Ground-Ice Conditions. National Snow and Ice Data Center/World Data Center for Glaciology, Boulder, Colorado. Digital Media.
- ↑ Mackay, J.R., 1972. Offshore permafrost and ground ice, Southern Beaufort Sea, Canada. Canadian Journal of Earth Sciences, 9:1550–1561.
- ↑ Mackay, J.R., 1972. Offshore permafrost and ground ice, Southern Beaufort Sea, Canada. Canadian Journal of Earth Sciences, 9:1550–1561.–Osterkamp, T.E. and W.D. Harrison, 1977. Sub-sea permafrost regime at Prudhoe Bay, Alaska, U.S. A. Journal of Glaciology, 19:627–637.–Vigdorchik, M.E., 1980. Arctic Pleistocene History and the Development of Submarine Permafrost. Westview Press, Colorado, 286pp.
- ↑ Judge, A.S. and J. A. Majorowicz, 1992. Geothermal conditions for gas hydrate stability in the Beaufort-Mackenzie area: the global change aspect. Palaeogeography, Palaeoclimatology, Palaeoecology (Global and Planetary Change Section), 98:251–263.–Kvenvolden, K. A., 1988. Methane hydrates and global climate. Global Biogeochemical Cycles, 2:221–229.
- ↑ Osterkamp, T.E., 2001. Sub-sea permafrost. In: Encyclopedia of Ocean Sciences, pp. 2902–2912. Academic Press.
- ↑ Osterkamp, T.E., 2001. Sub-sea permafrost. In: Encyclopedia of Ocean Sciences, pp. 2902–2912. Academic Press.
- ↑ Arctic Climatology Project, 1997. Environmental Working Group Joint U.S.-Russian Atlas of the Arctic Ocean - Winter Period. L. Timokhov and F. Tanis (eds.). Environmental Research Institute of Michigan in association with the National Snow and Ice Data Center, Ann Arbor, Michigan. CD-ROM.–Arctic Climatology Project, 1998. Environmental Working Group Joint U.S.-Russian Atlas of the Arctic Ocean - Summer Period. L. Timokhov and F. Tanis (eds.). Environmental Research Institute of Michigan in association with the National Snow and Ice Data Center, Ann Arbor, Michigan. CD-ROM.
- ↑ Brown, J. and S.M. Solomon, 1999. Arctic Coastal Dynamics. Report of an International Workshop. Geological Survey of Canada, Open File 3929.–Rachold, V., J. Brown and S.M. Solomon, 2002. Arctic Coastal Dynamics. Report of an International Workshop, Potsdam (Germany) 26–30 November 2001. Report on Polar Research 413, 27 extended abstracts, 103 pp.
- ↑ Dallimore, S.R., S. A. Wolfe and S.M. Solomon, 1996. Influence of ground ice and permafrost on coastal evolution, Richards Island, Beaufort Sea, N. W. T. Canadian Journal of Earth Sciences, 33: 664–675.–Mackay, J.R., 1986. Fifty years (1935 to 1985) of coastal retreat west of Tuktoyaktuk, District of Mackenzie. Geological Survey of Canada, Paper 86-1A:727–735.–Wolfe, S. A, S.R. Dallimore and S.M. Solomon, 1998. Coastal permafrost investigations along a rapidly eroding shoreline, Tuktoyaktuk, N. W. T. In: A.G. Lewkowicz and M. Allard (eds.). Proceedings of the Seventh International Conference on Permafrost, pp. 1125–1131.
- ↑ Solomon, S.M., D.L. Forbes and B. Kierstead, 1994. Coastal Impacts of Climate Change: Beaufort Sea Erosion Study. Geological Survey of Canada, Open File 2890, 85pp.
- ↑ Solomon, S.M., D.L. Forbes and B. Kierstead, 1994. Coastal Impacts of Climate Change: Beaufort Sea Erosion Study. Geological Survey of Canada, Open File 2890, 85pp.
- ↑ Canadian Ice Service.
- ↑ Rothrock, D. A., Y. Yu and G. A. Maykut, 1999. Thinning of the Arctic sea-ice cover. Geophysical Research Letters, 26:3469–3472.–Winsor, P., 2001. Arctic sea ice thickness remained constant during the 1990s. Geophysical Research Letters, 28(6):1039–1041.
- ↑ Manson, G.K., S.M. Solomon, J.J. van der Sanden, D.L. Forbes, I.K. Peterson, S.J. Prinsenberg, D. Frobel, T.L. Lynds and T.L. Webster, 2002. Discrimination of nearshore, shoreface and estuarine ice on the north shore of Prince Edward Island, Canada, using Radarsat-1 and airborne polarimetric c-band SAR. In: Proceedings of the Seventh International Conference on Remote Sensing for Marine and Coastal Environments. Miami, Florida. 20–22 May 2002. Document 0043, 7pp.
- ↑ Wilson, K.J., 2003. Pers. comm. Canadian Ice Service.
- ↑ Polyakov, I., G. Alexeev, R. Bekryaev, U.S. Bhatt, R. Colony, M. Johnson, V. Karklin, D. Walsh and A. Yulin, 2003. Long-term variability of ice in the arctic marginal seas. Journal of Climate, 16:2078–2085.
- ↑ Arctic Climatology Project, 1998. Environmental Working Group Joint U.S.-Russian Atlas of the Arctic Ocean - Summer Period. L. Timokhov and F. Tanis (eds.). Environmental Research Institute of Michigan in association with the National Snow and Ice Data Center, Ann Arbor, Michigan. CD-ROM.
- ↑ Arctic Climatology Project, 1997. Environmental Working Group Joint U.S.-Russian Atlas of the Arctic Ocean - Winter Period. L. Timokhov and F. Tanis (eds.). Environmental Research Institute of Michigan in association with the National Snow and Ice Data Center, Ann Arbor, Michigan. CD-ROM.–Arctic Climatology Project, 1998. Environmental Working Group Joint U.S.-Russian Atlas of the Arctic Ocean - Summer Period. L. Timokhov and F. Tanis (eds.). Environmental Research Institute of Michigan in association with the National Snow and Ice Data Center, Ann Arbor, Michigan. CD-ROM.
- ↑ Dyke, L.D. and S. Wolfe, 1993. Ground temperatures and recent coastal change at the north end of Richards Island, Mackenzie Delta, Northwest Territories. In: Current Research, Part E, Geological Survey of Canada Paper 93-1E, pp. 83–91.
- ↑ Taylor, A.E., 2002. Pers. comm. Geological Survey of Canada.
- ↑ Kobayashi, N., J.C. Vidrine, R.B. Nairn and S.M. Solomon, 1999. Erosion of frozen cliffs due to storm surge on the Beaufort Sea Coast. Journal of Coastal Research, 15:332–344.