Glaciers and ice sheets in the Arctic
This is Section 6.5 of the Arctic Climate Impact Assessment.
Lead Author: John E.Walsh; Contributing Authors: Oleg Anisimov, Jon Ove M. Hagen,Thor Jakobsson, Johannes Oerlemans,Terry D. Prowse,Vladimir Romanovsky, Nina Savelieva,Mark Serreze, Alex Shiklomanov, Igor Shiklomanov, Steven Solomon; Consulting Authors: Anthony Arendt, David Atkinson, Michael N. Demuth, Julian Dowdeswell, Mark Dyurgerov, Andrey Glazovsky, Roy M. Koerner, Mark Meier, Niels Reeh, Oddur Sigur0sson, Konrad Steffen, Martin Truffer
Contents
Background (6.5.1)
Dowdeswell and Hagen[1] estimated that the total volume of land ice in the Arctic is about 3.1 million cubic-kilometers (km3), which corresponds to a sea-level equivalent of about 8 meters (m). In terms of volume and area, the largest feature is the Greenland Ice Sheet, which covers about four times the combined area of the glaciers and ice caps of Alaska, the Canadian Arctic, Iceland, Svalbard, Franz Josef Land, Novaya Zemlya, Severnaya Zemlya, and northern Scandinavia (Table 6.7). However, unlike most small glaciers and ice caps, more than half the surface of the Greenland Ice Sheet is at altitudes that remain well below freezing throughout the year. Hence, relative to the Greenland Ice Sheet, the smaller ice caps and glaciers are susceptible to greater percentage changes of mass and area in response to changes in temperature and precipitation.
Fig. 6.15. Ice-covered areas and the location of glaciers and ice caps for which mass balance data are available. Wo: Wolverine Glacier, Gu: Gulkana Glacier, Mc: McCall Glacier, MSI: Melville South Ice Cap, Ba: Baby Glacier, Me: Meighen Ice Cap, DI: Devon Ice Cap, Dr: Drambui Glacier, Ho: Hofsjökull, Tu:Tungnarjökull, Br:Austre Brøggerbreen, Ko: Kongsvegen, En: Engabreen, Sg: Storglaciären, IG: Igan, Ob: Obruchev, Va: Vavilov, Ha:Hansbreen,Wh:White, Be: Bear Bay, Fi: Finsterwalderbreen, Ma: Storglaciären, Sts: Storstrommen[2].
The arctic glaciers and ice caps are irregularly distributed in space (Fig. 6.15), and are located in very different climatic regimes. The glaciers in southern Alaska and Iceland are subject to a maritime climate with a relatively small annual temperature range and high precipitation rates (a few meters per year). Conversely, the glaciers in the Canadian High Arctic are in a very continental climate. The summer is short, the annual temperature range is very large, and precipitation is about 0.25 m/yr. The conditions on Svalbard and the Russian Arctic islands fall between these two climatic regimes.
The Greenland Ice Sheet covers a wide latitude belt. The climate is dry and cold in the north, although summer [[temperature]s] can be high, with mean July temperatures of up to 5–6°C[3]. The North Atlantic storm track directly influences the southeastern part of the ice sheet. Maritime air masses are pushed onto the ice sheet and release large amounts of moisture. The accumulation rates are greatest in this part of the Greenland Ice Sheet.
The morphology of arctic glaiers shows great variety[4]. Some ice caps are dome-shaped, with lobes and outlet glaciers in which the ice drains away from the accumulation area to the melting regions or calving bays. Examples occur in the Canadian Arctic, Iceland, and the Russian Arctic islands. In other regions, large glaciers originate from ice fields that cover the area between mountain ranges (e.g., in southern Alaska). Many regions (e.g., Svalbard) also have a large number of individual valley glaciers.
There are many surging glaciers in the Arctic. In a surging event, glacier fronts can move forward many kilometers (sometimes more than 10 km) in a matter of years. After a surge, a build-up phase starts and the glacier accumulates mass for the next surge. Depending on the size of the glacier, the duration of the build-up phase ranges from a few decades to a few centuries. Surging glaciers occur in Alaska, Canada, Svalbard, and Iceland, and have also been observed in other areas of the Arctic. A surge event may change the flow and geometry of the glacier. While an individual surge is not directly related to climate change, increased melting may have an effect on the periodicity of surging.
Glaciers, ice caps, and ice sheets respond to climate changes over very different timescales depending on their size, shape, and temperature condition. The smaller glaciers are likely to respond quickly, with shape, flow, and front position changing over a few years or a few decades, while the Greenland Ice Sheet responds to climate changes over timescales of up to millennia. Parts of the Greenland Ice Sheet may still be responding to climate variations that occurred thousands of years ago.
Many glaciers in dry regions have low accumulation rates. Consequently, it takes a long time before the climate signal penetrates into these glaciers, and over a 100-year timescale, the effects are unlikely to be very large. However, in areas where meltwater penetration increases, the effect of latent heat release is likely to cause a faster response in the thermal regime.
Because arctic glaciers have such a wide variety of morphological and climatic regimes, the most difficult task in this assessment is to extrapolate results for a few glaciers and ice caps to all ice masses in the Arctic. Mass-balance measurements have been conducted on some glaciers for shorter or longer periods (Fig. 6.15), but only a small fraction of the glaciated area is monitored. Attempts have been made to extrapolate measurements, parameters, and models from a small number of glaciers to obtain regional estimates[5], although extrapolation introduces considerable uncertainty into conclusions about ongoing and future changes in the area and volume of land ice and associated changes in sea level ( see Projected changes section below).
|
Table 6.7. Ice coverage in arctic regions with extensive glaciation[6]. | |
|
Glacier area (103 km2) | |
|
Greenland Ice Sheet |
1,640.0 |
|
Canadian Arctic (>74° N) |
108.0 |
|
Canadian Arctic (<74° N) |
43.4 |
|
Alaska |
75.0 |
|
Iceland |
10.9 |
|
Svalbard |
36.6 |
|
Franz Josef Land |
13.7 |
|
Novaya Zemlya |
23.6 |
|
Severnaya Zemlya |
18.3 |
|
Norway/Sweden |
3.1 |
Glaciers gain mass from snowfall and lose mass mainly through iceberg calving, surface melting and runoff, and melting under floating ice shelves. The specific net balance is the net annual change in mass per square meter, often expressed in kg/m2 or meter water equivalent (mwe). The mass balance is positive in the accumulation zone and negative in the ablation zone. The equilibrium line separates the accumulation and ablation zones.
Meltwater formed at the surface may percolate into the snowpack and refreeze to form ice lenses and glands. Eventually the meltwater freezes onto the ice surface below the snowpack to form superimposed ice. Part of this ice subsequently melts in the summer, but the remainder survives. Refreezing and the formation of superimposed ice can have a significant influence on the energy budget of the melt process[7] and can decrease the altitude of the equilibrium line. The quantitative effects of refreezing on the mean specific balance of a glacier are not well understood, and are rarely treated well in mass-balance models. With respect to relatively rapid climate change, an important question is whether the increasing amounts of meltwater will add to runoff or be retained in cold firn (compact, granular snow that is over one year old) fields.
Iceberg calving is another process for which a universal model does not exist. For many glaciers in the Arctic, the amount of ice lost by meltwater runoff is larger than the amount lost by calving, but calving is significant for many glaciers (typically 15 to 40% of the total mass loss for glaciers on the islands in the Eurasian Arctic sector)[8]. For the Greenland Ice Sheet, the IPCC[9] estimated that the losses from meltwater runoff and calving are of the same order of magnitude. Researchers have attempted to determine a linear relationship between the calving rate and water depth or ice thickness at the glacier front. This seems to work for many individual glaciers, but the coefficients show large spatial variation.
The mass-balance sensitivities vary widely among glaciers. Differences in the sensitivity to annual anomalies of temperature and precipitation reach one order of magnitude. In the high Arctic, where winter temperatures are consistently below freezing, only the summer temperature affects the mass balance. In a maritime climate such as for Iceland, sensitivity to temperature change is much greater, and temperature anomalies in other seasons are also important. For all glaciers in maritime climates, where most of the summer precipitation falls as rain, the sensitivity to precipitation anomalies shows a marked seasonality.
The sensitivity of a glacier to atmospheric forcing can be estimated using a mass-balance model and the field measurements that are required for calibrating the model. The potential contribution to sea-level rise from an entire region is obtained by multiplying the annual climate sensitivities (expressed in millimeters) by the total glacier area in the region. However, the mass-balance sensitivity for a region must be extrapolated from the calculations for specific glaciers. Figure 6.16 summarizes mass-balance sensitivities to temperature for the Arctic regions in Table 6.7 and shows the corresponding consequences for global sea level.
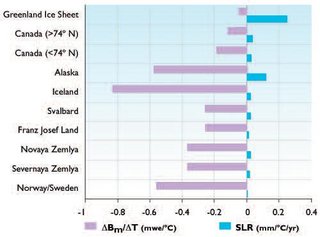 Fig. 6.16. Mass-balance sensitivity to temperature change (lavender) and potential sea-level rise (blue) for the arctic regions with extensive glaciation listed in Table 6.7. Dbm/DT is the change in mass balance (meter water equivalent) per °C of temperature change; SLR is sea-level rise[10].
 Recent events have demonstrated the potential for calving glaciers to undergo very rapid change. Calving glaciers that have retreated over large distances during the last hundred years, or even the last few decades, exist throughout the Arctic and subarctic. Well-documented examples include Jakobshavn Isbrae, West Greenland[11], Breidamerkurjökull, Iceland[12], Columbia Glacier, Alaska[13], and Kronebreen and Hansbreen in Svalbard[14].
Although understanding of the processes that control calving have not been fully quantified[15], a clear relation to climatic forcing is evident in some cases where thinning leads to greater flotation of the terminus region and increased calving such as Jakobshavns Glacier and Columbia Glacier [15]. Many internal mechanisms play a role, including sedimentary and erosive processes below and in front of a glacier tongue. During retreat, some calving glaciers tend to "jump" from pinning point to pinning point; other glaciers retreat steadily over a rather simple bed. Pinning points provide stability for the calving tongue, as they provide a backforce. If thinning of the tongue occurs, the glacier tongues connection with the pinning points is reduced, allowing the glacier to accelerate and calve rapidly as has happened recently on several Greenland outlet glaciers[21]. While climatic factors will detremine the extent of calving glaciers over the long term, the short term response of many glaciers is of an irregular and episodic nature, and is therefore unpredictable.
Recent and ongoing changes (6.5.2)
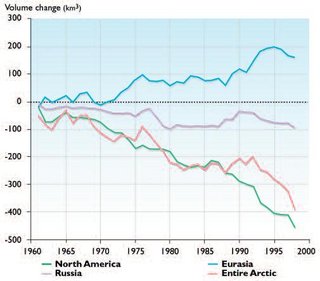 Fig. 6.17. Accumulated annual volume change in ice caps and glaciers in the North American Arctic, the Russian Arctic, the Eurasian Arctic, and the entire Arctic[16].
 The general pattern of glacier and ice-cap variations in the Arctic (apart from the Greenland Ice Sheet) is a retreat of glacier fronts, indicating a volume decrease since about 1920 that follows a period of general temperature increase throughout the Arctic. However, there are large regional variations in the magnitude of this retreat, and it is not known whether thickening in the accumulation areas may be compensating for some or all of the frontal retreat. Long-term mass-balance investigations have been conducted for only a few glaciers (Fig. 6.15), which occupy less than 0.1% of the total glaciated area in the Arctic. For the measured glaciers, no clear trends are discernible in the mass-balance parameters, winter accumulation, or summer melting prior to 1990[17]. Several of the glaciers had a negative mass balance, but with no acceleration in the melt rate. However, changes in these trends since 1990 have been observed. Arendt et al.[18] observed increased and accelerating melting of Alaskan glaciers, and the same trend has been reported for the Devon Ice Cap in northern Canada[19]. In other parts of the Arctic (e.g., Svalbard), no accelerated melting has been observed[20]. In subarctic areas (i.e., Scandinavia), increased precipitation and positive mass balance were observed from 1988 to 1998, although the mass balances have generally been negative since 1998[21].
Figure 6.17 presents a spatially integrated picture of arctic ice caps and mountain glaciers, obtained by grouping glaciers into geographic regions and assuming that glaciers in the same region have similar mass balances[21]. The figure shows the accumulated ice volume change since 1960 in three areas: the North American Arctic (Alaska and Canada); the Russian Arctic (arctic islands, northeast Siberia, and polar Urals); and the European Arctic (Scandinavia, Svalbard, Iceland, and Jan Mayen). The arctic-wide volume change, which is negative and dominated by changes in the North American Arctic, is also shown. The net accumulation in the European Arctic (primarily Scandinavia) is due to the increased precipitation accompanying the northward shift of the Atlantic storm track in recent decades, when the North Atlantic Oscillation (NAO) has been in a predominantly positive phase.
Alaska (6.5.2.1)
The total area of Alaskan glaciers is approximately 75,000 km2. The largest glaciers in Alaska occur along the southern and western shores of the Pacific Mountain System. Despite the vast number and size of Alaskan glaciers, mass-balance data are available for only a very few.
Arendt et al.[22] estimated the volume changes in 67 Alaskan glaciers between the mid-1950s and the mid-1990s using airborne laser altimetry measurements, and found that the glaciers had thinned at an average rate of 0.52 m/yr. Extrapolating this thinning rate to all glaciers in Alaska results in an estimated volume change of -52±15 km3/yr, which is equivalent to a sea-level rise of 0.14±0.04 mm/yr. Additional measurements from 28 of these glaciers between the mid-1990s and 2000–2001 indicate that the rate of thinning has increased to -1.8 m/yr. When this rate of thinning is extrapolated to all Alaskan glaciers, the equivalent sea-level rise is 0.27±10 mm/yr, which is nearly double the estimated contribution from the Greenland Ice Sheet during the same period[23]. This rapid wastage of Alaskan glaciers represents about half the estimated loss of mass by glaciers worldwide[24], and the largest glacial contribution to sea-level rise yet deduced from measurements[25].
Canadian Arctic (6.5.2.2)
The mass-balance records in the eastern Canadian Arctic are among the longest in existence, with many covering more than 40 years. The larger ice masses had slightly negative mass balances between the early 1960s and the mid-1980s[26], although the balances became increasingly negative both with diminishing size of the ice caps and/or with a more westerly location. No persistent trends were observed in any of the data prior to the mid-1980s. However, the mass balances have become increasingly negative since the mid- 1980s[27]. Summer mass-balance trends determine the annual balance trends; the winter balances have shown no significant trend over the entire 40-year period. This indicates that, as in other parts of the Arctic, summer temperature drives variations in the annual mass balance. At present, there are no systematic observations of mass balance in the western Canadian Arctic.
Ice core records show that, while the present mass balance is negative, it was more negative in the early part of the present interglacial, when substantial glacier retreat occurred[28]. Balances that were more positive occurred over the past 3,000 years, terminating with the onset of the modern warming period about 150 years ago.
In the subarctic areas of the Canadian Cordillera, Demuth et al.[29] found a period of declining glacier-derived discharge during the last half of the 20th century, despite a general warming trend. This decline appears to be due to the substantial contraction of outlet glaciers since the Neoglacial maximum stage (ca. 1850).
Greenland Ice Sheet (6.5.2.3)
The Greenland Ice Sheet (1,640,000 km2) is the largest ice mass in the Arctic. Two factors contribute to the difficulty of measuring the total mass balance of the Greenland Ice Sheet: short-term (interannual to decadal) fluctuations in accumulation and melt rate cause variations in surface elevation that mask the long-term trend; and climate changes that occurred hundreds or even thousands of years ago still influence ice flow, as do changes that are more recent.
The geological and historical records show that the marginal zone of the Greenland Ice Sheet has thinned and retreated over the past hundred years[30]. Whether this mass loss was compensated, partly or fully, by thickening in the interior is unknown. Although several expeditions have crossed the ice sheet since the late 19th century, the earliest measurements of sufficient precision to permit calculation of surface-elevation change are those made by the British North Greenland Expedition (BNGE), which crossed the ice sheet during 1953 and 1954. Height measurements repeated in 1959, 1968, and 1992 along a profile across the ice sheet in central Greenland showed thickening on the western slope between 1959 and 1968, but subsequent thinning between 1968 and 1992[31], probably reflecting decadal-scale fluctuations in accumulation rates.
The IPCC[32] provides estimated of the individual terms of the mass budget of the Greenland Ice Sheet, consisting of: accumulation (520±26 km3/yr); runoff (329±32 km3/yr); and iceberg calving (235±33 km3/yr). There are large uncertainties in these estimates, but they show that calving and surface melting are of the same order of magnitude.
Rignot and Thomas[33] mapped estimated thickening rates in Greenland by synthesizing airborne laser altimeter and satellite-borne radar altimeter surveys, mass-budget calculations, and direct measurements of changes in surface elevation. The higher-elevation areas appear to be in balance to within 1 cm/yr, although temporal variations in snow accumulation rates create local thickening or thinning rates of up to 30 cm/yr. In contrast, the coastal regions appear to have thinned rapidly between the 1993–1994 and 1998–1999 laser altimeter surveys[34]. A conservative estimate of the rate of net ice loss (~50 km3/yr) corresponds to a sea-level rise of 0.13 mm/yr. Since variations in summer temperatures do not explain the rapid thinning of many outlet glaciers, the coastal thinning is apparently a result of glacier dynamics rather than a response to atmospheric warming[34]. Alternatively, Zwally et al.[35] suggested that increased basal lubrication, due to additional surface meltwater reaching the glacier beds via crevasses and moulins, may play a role in outlet glacier thinning leading to an acceleration of up to 15%. An acceleration of this type would be seasonal in nature and be greatest near the equilbrium line. The observed acceleration began at the calving front, and was a year round acceleration, indicating that it is a change in calving processes, not meltwater that caused the recent acceleration of Jakobshavns, and Helheim Glacier [36]
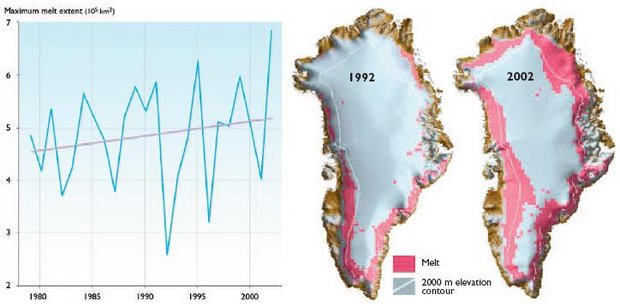 Fig. 6.18. Time series of maximum summer melt extent over Greenland from 1979 to 2002 (left) and the melt extent in 1992 and 2002 (right)[37].
 The extent of surface melt over Greenland increased between 1979 and 2002, although large interannual variations are superimposed on this increase. Figure 6.18 shows the time series of the maximum summer melt extent, together with maps of the melt areas in 1992 (year of minimum melt) and 2002 (year of maximum melt).
Iceland (6.5.2.4)
Most Icelandic glaciers are subject to a maritime climate, with annual precipitation of up to 7 m at the highest elevations. Annual glacier-front variations are monitored at about 50 sites, and complete records from 1930 to the present exist for some of the glaciers[36], which show a clear response to variations in climate during this period[38]. Mass-balance measurements have been made annually at several ice caps for 10 to 15 years[39]. The glaciers in Iceland, particularly those on the south and southeast coasts, have a very great annual turnover of freshwater. During a year of strongly negative mass balance the glaciers can add more than 10 km3 (equivalent to 0.03 mm global sea-level rise) to the normal precipitation runoff from the glaciated areas. Between 1991 and 2001, Vatnajökull Ice Cap lost 0.6% of its mass[40], equivalent to 24 km3 of runoff or a global sea-level rise of 0.06 mm.
Icelandic glaciers advanced almost continuously during the Little Ice Age (c.1400–1900), and reached a maximum extent about 1890[41]. During the first quarter of the 20th century, glacier fronts retreated slightly. The rate of retreat increased significantly in the 1930s, but decreased after 1940. About 1970, most nonsurging glaciers in Iceland started advancing. This period of advance was more or less continuous until the late 1990s. By 2000, all Icelandic glaciers were retreating, owing to consistently negative mass balances after 1995[42].
Svalbard (6.5.2.5)
The ice masses of Svalbard cover an area of approximately 36,600 km2. Annual mass-balance measurements have been made on several Svalbard glaciers for up to 30 years[43]. No significant changes in mass balance have been observed during the past 30 years. The measured mean net mass balance has been negative, with no discernible change in trend. The winter accumulation is stable, and annual variations are small. The mean summer ablation is also stable with no significant trend. However, there are large interannual variations, and summer ablation drives the variations in the annual net mass balance. The low-altitude glaciers are shrinking steadily but with a slightly smaller negative net balance than those observed three decades ago. Glaciers with high-altitude accumulation areas have mass balances close to zero.
Glaciers in the western maritime region of southern Scandinavia grew slowly between 1960 and 1988. Mass balances became even more positive (or less negative) between 1988 and 1998. The increase in net mass balance was due to greater winter snowfall, in contrast to Svalbard where summer ablation drives the variability in net balance. Positive mass balances due to greater winter snowfall were also observed in northern Scandinavia, at least at latitudes below 68° N. Norwegian glaciers have decreased significantly since the 1990s. By 2005 only 1 of the 25 glaciers monitored in Norway was advancing, two were stationary and 22 were retreating. In 2006 glacier mass balances were very negative in Norway and of the 26 glaciers examined, 24 were retreating with one stationary and one advancing [44]. The Norwegian Engabreen Glacier has retreated 185 m (603 ft) since 1999, while the Brenndalsbreen and Rembesdalsskåka glaciers have retreated 276 m (905 ft) and 250 m (820 ft), respectively, since 2000. The Briksdalsbreen glacier retreated 96 m (314 ft) in 2004 alone—the largest annual retreat recorded for this glacier since monitoring began in 1900. This figure was exceeded in 2006 with five glaciers retreating over 100 m from the fall of 2005 to the fall of 2006. Four outlets from the Jostedalsbreen ice cap, Kjenndalsbreen, Brenndalsbreen, Briksdalsbreen and Bergsetbreen had a frontal retreat of more than 100 metres. Gråfjellsbrea, an outlet from Folgefonna, had a retreat of almost 100 metres. Overall, from 1999 to 2005, Briksdalsbreen retreated 336 m (1102 ft) [44].
However, low accumulation rates and high ablation rates resulted in negative mass balances for all Scandinavian glaciers between 1999 and 2003. Reichert et al.[44] used model-based calculations to show that natural variability (e.g., the NAO) can explain many of the shorter-term variations in the mass balance of Scandinavian glaciers.
Novaya Zemlya (6.5.2.7)
The glacier area of Novaya Zemlya is about 23,600 km2[45]. No direct mass-balance measurements have been made on Novaya Zemlya, but several studies of glacier extent indicate a general retreat and thus negative mass balance. Koryakin[46] reported reductions in glacier area on Novaya Zemlya during each of four periods spanning 1913 to 1988. Zeeberg and Forman[47] reported that tidewater calving glaciers on north Novaya Zemlya receded rapidly (>300 m/yr) during the first half of the 20th century. However, 75 to 100% of the net 20th-century retreat occurred by 1952; between 1964 and 1993, half the studied glaciers were stable, while the remainder retreated <2.5 km.
Mass losses from calving appear to be greater than mass losses from recession. The annual iceberg flux from the 200 km of calving fronts on Novaya Zemlya has been estimated to be about 2 km3/yr[48].
Franz Josef Land (6.5.2.8)
The primary measurements available for the Franz Josef Land archipelago (glacier area 13,700 km2) are of glacier extent rather than mass balance. Franz Josef Land glaciers receded between 1953 and 1993, resulting in an estimated change in glacier area of -210 km2, and a corresponding volume change of -42 km3[49]. The largest changes appear to have occurred in southern parts of the ice caps on the different islands of the archipelago.
Severnaya Zemlya (6.5.2.9)
Very few measurements of mass balance have been made in the Russian Arctic islands[50]. The only comprehensive data are those from the Vavilov Ice Cap (1,820 km2) on October Revolution Island (79° N) in Severnaya Zemlya, where the mass balance did not differ significantly from zero over a ten-year period beginning in 1975. Observations of changing ice-front positions suggest that the glaciers of the Vavilov Ice Cap have generally been retreating during the 20th century, providing a qualitative indication that the mean mass balance has been negative over this period, but less negative than in the other Russian Arctic islands.
Projected changes (6.5.3)
In view of the limited knowledge of arctic glaciers and the uncertainties discussed in Recent and ongoing changes section above, a mass-balance sensitivity approach[51] was used to project future change in glaciers and ice sheets. The monthly anomalies in surface temperature and precipitation generated by the five ACIA-designated models (Section 4.4 (Glaciers and ice sheets in the Arctic)) were used to calculate projected changes in glacier mass balance. Projected regional changes were extrapolated from the sensitivities of glaciers for which mass-balance data exist. These projections assume that the glaciers are in balance with the baseline climates (temperature and precipitation) simulated by the models, although this assumption is unlikely to be correct (see Critical research needs section below).
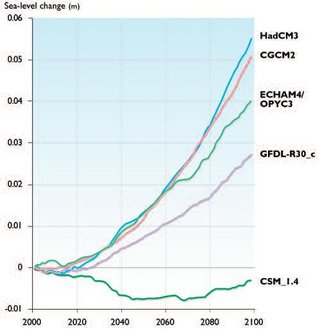 Fig. 6.19. Projected contribution of arctic land ice to sea-level change between 2000 and 2100, calculated using output from the five ACIA-designated models[52].
 This approach to projecting changes in mass balance does not include glacier or ice-sheet dynamics, calving, or an explicit treatment of internal accumulation (refreezing of meltwater that percolates into the glacier); other types of mass-balance models would provide different results. Nevertheless, the use of a single mass-balance model implies that the range in projected mass-balance changes described in this section can be attributed solely to differences in the projections of temperature and precipitation generated by the five ACIA-designated models.
The output from each mass-balance model run (using input from the different ACIA-designated models) was first averaged over the regions listed in Table 6.7 (the Greenland Ice Sheet was split into four parts). The results are summarized in Fig. 6.19, which shows the projected contribution of arctic land ice to sea-level rise between 2000 and 2100. The results from the different models diverge significantly over time, ranging from close to zero to almost six centimeters by 2100. The result using output from the CSM_1.4 model is an outlier. This model projects a large increase in precipitation for the Arctic, which compensates for the enhanced ablation associated with the modest temperature rise projected by the model. The effects of temperature on glacier and ice cap mass balances projected by the different models are generally similar. The differences in the projected changes in sea level are therefore primarily due to differences in the modeled precipitation rates.
If the CSM_1.4 outlier is not included, the mean of the projected changes in sea level is an increase of approximately 4 cm between 2000 and 2100. This change is somewhat smaller than the 70-year (2000–2070) increase of 5.7 cm estimated by Van de Wal and Wild[53]. However, the model used by Van de Wal and Wild was forced with doubled CO2 concentrations throughout the 70-year simulation, rather than the gradual increase of GHGs in the B2 emissions scenario used to force the ACIA-designated models (Section 4.4.1 (Glaciers and ice sheets in the Arctic)). In addition, the 70-year simulation used prescribed sea surface temperatures, while the coupled ACIA-designated models generate sea surface temperatures as part of the simulation process.
At a regional scale, the differences between the model projections are even greater. The projections do not even agree on the sign of the contribution of arctic land ice to sea-level change resulting from precipitation changes in some regions (e.g., Svalbard), indicating that model projections of changes in glacier mass balance at a regional scale are highly uncertain.
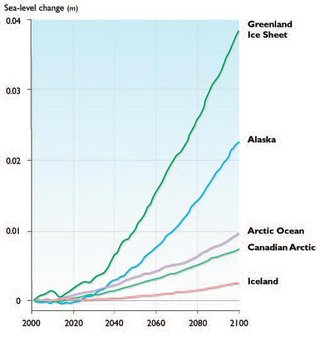 Fig. 6.20. Projected contribution of arctic land ice to sea-level change between 2000 and 2100 for various regions, calculated from ECHAM4/OPYC3 model output using temperature effects only[54].
 Of the five ACIA-designated models, the ECHAM4/ OPYC3 model projects the greatest temperature effects on the mass balance of glaciers and ice caps. Earlier versions of this model were used by Ohmura et al.[55] to assess possible changes in the Greenland Ice Sheet driven by climate change, and by Van de Wal and Wild[56] as noted previously. Figure 6.20 compares the projected contributions to sea-level change (due to temperature effects alone) from various regions using output from the ECHAM4/OPYC3 model. The Greenland Ice Sheet is projected to make the largest contribution, which is a direct consequence of its size. Although the glaciers in Alaska cover a much smaller area, they are also projected to make a large contribution, in agreement with recent analyses[57]. For Alaskan glaciers, the relatively large sensitivity to temperature change drives the regional changes. Glaciers and ice caps in the Eurasian Arctic Ocean (Svalbard, Franz Josef Land, Severnaya Zemlya, and Novaya Zemlya) are projected to contribute about the same amount as those in the Canadian Arctic. Section 6.9 (Glaciers and ice sheets in the Arctic) reviews all of the variables that may contribute to future sea-level change.
Impacts of projected changes (6.5.4)
On other parts of the physical system
The greatest impact of changes in the mass of arctic land ice over decade-to-century timescales is likely to be a change in the freshwater input to the high-latitude oceans, which will change ocean stratification in sensitive areas such as the Greenland and Labrador Seas. Sea-ice production and export are also likely to be affected if more freshwater goes into the oceans and stabilizes the water column (Section 9.2.3.1 (Glaciers and ice sheets in the Arctic)). In some areas, increased freshwater flux is likely to increase the formation of sea ice. Over longer timescales, changes in glacial ice (especially the Greenland Ice Sheet) may affect the geoid and the rotation rate of the earth.
On ecosystems
To the extent that changes in freshwater influx affect upper-ocean stratification (and possibly sea ice), impacts on marine ecosystems are likely. Riparian ecosystems are also likely to be affected by changes in river flow and aufeis (ice formed when water from a stream emerges and freezes on top of existing ice) production. Any significant change in sea level will have impacts on ecosystems in low-lying coastal areas.
On people
The greatest direct impacts on humans from changes in arctic land ice are likely to result from changes in global sea level, which will affect coastal communities in many parts of the Arctic. Other possible impacts include changes in hydropower production and water supply from glacier-fed lakes and reservoirs. Changes in iceberg production will increase or decrease hazards to shipping and navigation.
Critical research needs (6.5.5)
The compilation of an up-to-date global glacier inventory is a critical research need. For some regions, existing inventories are sparse; inventories also need to be updated where glacier areas have changed. A global satellite-derived dataset of exposed ice areas is a minimum requirement. Ideally, a complete glacier database describing individual glacier locations, areas, and geometries should be compiled, so that mass-balance measurements on individual benchmark glaciers can be extrapolated to unmeasured glaciers with greater certainty.
For future projections, it would be useful to develop additional mass-balance models so that spatial variations can be better depicted and so that the records can be extended back in time at locations for which atmospheric data are available. For this purpose, additional mass-balance observations should be obtained in regions where existing data are particularly sparse, in order to provide credibility and a sense of the uncertainties in model projections of future trends. It is also important to continue the ongoing monitoring of glacier mass balance with in situ measurements on selected glaciers in order to improve understanding of the response of glaciers to climate change, improve model projections of future change, and calibrate remote-sensing data.
Improved climate model projections of temperature and precipitation over ice-covered regions are a top priority for improving projections of changes in glaciers, ice sheets, and sea level. As the results in Section 6.5.3 (Glaciers and ice sheets in the Arctic) imply, the ranges in the projected changes in temperature and precipitation among the ACIA-designated models are far greater than the mean changes projected for glaciated areas. The application of the mass-balance sensitivity approach described in Projected changes section (above) also requires analyses of the likely discrepancies between mass balances calculated from the models’ baseline simulations of temperature and precipitation and the present- day glacier mass balances.
With regard to sea level, a critical need is to determine whether the recent negative mass balance and increasing summer melt area of the Greenland Ice Sheet (equivalent to at least 0.13 mm/yr sea-level rise) are part of a long-term trend[58]. Continued monitoring of the ice sheet, using, for example, radar and laser altimeters such as those planned for the Cryosphere Satellite (CryoSat) and the Ice, Cloud and Land Elevation Satellite (ICESat), is likely to improve understanding of the current mass balance of the Greenland Ice Sheet.
In order to improve projections of future mass-balance changes, the following studies should be given high priority:
- improving understanding of albedo changes and feedback mechanisms;
- studies of outlet glacier dynamics with emphasis on their potential for triggering persistent, rapid changes in ice-sheet volume;
- improving ice-dynamic models for determining the long-term response of the ice sheet to past climate change;
- improving parameterization and verification of internal-accumulation models; and
- improving understanding of the relationships between climate change, meltwater penetration to the bed, and changes in iceberg production.
Future changes in mass balance are strongly dependent on future changes in climate. Consequently, the ability to project changes in the mass balance of the Greenland Ice Sheet is linked closely to the ability of atmosphere–ocean general circulation models (AOGCMs) to project changes in regional climate over Greenland. For example, recent AOGCM model runs project a greater increase in the accumulation rate over Greenland associated with a temperature increase than did previous studies[59]. If the latest projections prove to be accurate, increases in accumulation would largely compensate for the increased runoff resulting from projected temperature increases.
Chapter 6: Cryosphere and Hydrology
6.1. Introduction (Glaciers and ice sheets in the Arctic)
6.2. Precipitation and evapotranspiration
6.3. Sea ice (Sea ice in the Arctic)
6.4. Snow cover
6.5. Glaciers and ice sheets
6.6. Permafrost (Permafrost in the Arctic)
6.7. River and lake ice
6.8. Freshwater discharge
6.9. Sea-level rise and coastal stability
References
- ^ Howat, I., Joughin, I., and Scambos, T.: Rapid Changes in Ice Discharge from Greenland Outlet Glaciers, Science, 315, 1559–1561, 2007.
 Public Domain Image
Citation
Committee, I. (2013). Glaciers and ice sheets in the Arctic. Retrieved from http://editors.eol.org/eoearth/wiki/Glaciers_and_ice_sheets_in_the_Arctic- ↑ Dowdeswell, J. A. and J.O. Hagen, 2004. Arctic ice masses. Chapter 15. In: J.L. Bamber and A.J. Payne (eds.). Mass Balance of the Cryosphere. Cambridge University Press, 712pp.
- ↑ Dowdeswell, J. A., J.O. Hagen, H. Bjornsson, A.F. Glazovsky, W.D. Harrison, P. Holmlund, J. Jania, R.M. Koerner, B. Lefauconnier, C.S.L. Ommanney and R.H. Thomas, 1997. The mass balance of circum-Arctic glaciers and recent climate change. Quaternary Research, 48:1–14.
- ↑ Ohmura, A., 1997. New temperature distribution maps for Greenland. Zeitschrift fur Gletscherkunde und Glazialgeologie, 23:1–45.
- ↑ Williams, R.S. Jr. and J.G. Ferrigno (eds.), 2002. Satellite Image Atlas of Glaciers of the World: Glaciers of North America. U.S. Geological Survey, Washington, D.C., 405pp.
- ↑ Dyurgerov, M.B. and M.F. Meier, 1997. Year-to-year fluctuations of global mass balance of small glaciers and their contribution to sea-level change. Arctic and Alpine Research, 29:392–401.
- ↑ Dowdeswell, J. A. and J.O. Hagen, 2004. Arctic ice masses. Chapter 15. In: J.L. Bamber and A.J. Payne (eds.). Mass Balance of the Cryosphere. Cambridge University Press, 712pp.
- ↑ Ambach,W., 1979. Zur Wärmehaushalt des Grönlandischen Inlandeises:Vergleichende Studie im Akkumulationsgebiet- und Ablationsgebiet. Polarforschung, 49:44–54.
- ↑ Dowdeswell, J. A. and J.O. Hagen, 2004. Arctic ice masses. Chapter 15. In: J.L. Bamber and A.J. Payne (eds.). Mass Balance of the Cryosphere. Cambridge University Press, 712pp.
- ↑ IPCC, 2001. Climate Change 2001:The Scientific Basis. Contribution of Working Group I to the Third Assessment Report of the Intergovernmental Panel on Climate Change. J. T. Houghton, Y. Ding, D.J. Griggs, M. Noguer, P.J. van der Linden, X. Dai, K. Maskell and C. A. Johnson (eds.). Cambridge University Press, 881pp.
- ↑ Oerlemans, J., 2003. Utrecht University, the Netherlands.
- ↑ Weidick, A., C.E. Bøggild and O.B. Olesen, 1992. Glacier Inventory and Atlas of West Greenland. Report 158. Grønlands Geologiske Undersøgelse, 194pp.–Williams, R.S. Jr., 1986. Glaciers and glacial landforms. Chapter 9. In: N.M. Short and R. W. Blair Jr. (eds.). Geomorphology from Space. A Global Overview of Regional Landforms. NASA Special Publication SP-486, pp. 521–596.
- ↑ Björnsson, H., F. Pálsson and S. Gudmundsson, 2001. Jökulsárlón at Breidamerkursandur,Vatnajökull, Iceland: 20th century changes and future outlook. Jökull, 50:1–18.
- ↑ Pfeffer, W. T., J. Cohn, M.F. Meier and R.M. Krimmel, 2000. Alaskan glacier beats a rapid retreat. Eos,Transactions, American Geophysical Union, 81:48.
- ↑ Jania, J. and M. Kaczmarska, 1997. Hans Glacier – a tidewater glacier in southern Spitsbergen: summary of some results. In: C.J. Van der Veen (ed.). Calving Glaciers: Report of a workshop, February 28–March 2, 1997, pp. 95–104. Byrd Polar Research Center, Report No. 15. Ohio State University.–Lefauconnier, B., J.O. Hagen and J.P. Rudant, 1994. Flow speed and calving rate of Kongsbreen Glacier, 79° N, Spitsbergen, Svalbard, using SPOT images. Polar Research, 13(1):59–65.
- ↑ 15.0 15.1 Van der Veen, C.J., 1996. Tidewater calving. Journal of Glaciology, 41:375–385.–Van der Veen, C.J. (ed.), 1997. Calving Glaciers: Report of a workshop, February 28 – March 2, 1996. BPRC Report No. 15. Byrd Polar Research Center, Ohio State University, 194pp.
- ↑ Oerlemans, J., 2003. Utrecht University, the Netherlands.
- ↑ Dowdeswell, J. A., J.O. Hagen, H. Bjornsson, A.F. Glazovsky, W.D. Harrison, P. Holmlund, J. Jania, R.M. Koerner, B. Lefauconnier, C.S.L. Ommanney and R.H. Thomas, 1997. The mass balance of circum-Arctic glaciers and recent climate change. Quaternary Research, 48:1–14.–Jania, J., and J.O. Hagen (eds.), 1996. Mass Balance of Arctic Glaciers. International Arctic Science Committee Report No. 5, 62pp.
- ↑ Arendt, A. A., K.E. Echelmeyer, W.D. Harrison, C. A. Lingle and V.B. Valentine, 2002. Rapid wastage of Alaska glaciers and their contribution to rising sea level. Science, 297:382–386.
- ↑ Koerner, R.M., 2003. Pers. comm. Geological Survey of Canada. National Snow and Ice Data Center, Boulder, Colorado.
- ↑ Hagen, J.O. and O. Liestøl, 1990. Long term glacier mass balance investigations in Svalbard 1950–1988. Annals of Glaciology, 14:102–106.–Lefauconnier, B., J.O. Hagen, J.B. Ørbeck, K. Melvold and E. Isaksson, 1999. Glacier balance trends in the Kongsfjorden area, western Spitsbergen, Svalbard, in relation to the climate. Polar Research, 18(2):307–313.
- ↑ 21.0 21.1 Dowdeswell, J. A. and J.O. Hagen, 2004. Arctic ice masses. Chapter 15. In: J.L. Bamber and A.J. Payne (eds.). Mass Balance of the Cryosphere. Cambridge University Press, 712pp.–Dyurgerov, M.B. and M.F. Meier, 1997. Year-to-year fluctuations of global mass balance of small glaciers and their contribution to sea-level change. Arctic and Alpine Research, 29:392–401.–Jania, J., and J.O. Hagen (eds.), 1996. Mass Balance of Arctic Glaciers. International Arctic Science Committee Report No. 5, 62pp.
- ↑ Arendt, A. A., K.E. Echelmeyer, W.D. Harrison, C. A. Lingle and V.B. Valentine, 2002. Rapid wastage of Alaska glaciers and their contribution to rising sea level. Science, 297:382–386.
- ↑ Rignot, E. and R.H. Thomas, 2002. Mass balance of the polar ice sheets. Science, 297:1502–1506.
- ↑ Meier, M.F. and M.B. Dyurgerov, 2002. How Alaska affects the world. Science, 297:350–351.
- ↑ Arendt, A. A., K.E. Echelmeyer, W.D. Harrison, C. A. Lingle and V.B. Valentine, 2002. Rapid wastage of Alaska glaciers and their contribution to rising sea level. Science, 297:382–386.
- ↑ Koerner, R.M., 1996. Canadian Arctic. In: J. Jania and J.O. Hagen (eds.). Mass Balance of Arctic Glaciers. International Arctic Science Committee, Rep. No. 5.
- ↑ Koerner, R.M. and L. Lundgaard, 1995. Glaciers and global warming. Geographie physique et Quaternaire, 49:429–434.
- ↑ Koerner, R.M., 2002. Glaciers of the High Arctic Islands. In: R.S. Williams and J.G. Ferrigno (eds.). Satellite Image Atlas of Glaciers of the World: Glaciers of North America, pp. J111–J146. U.S. Geological Survey Professional Paper 1386–J.
- ↑ Demuth, M.N., A. Pietroniro,T. Ouarda and J.Yetter, 2002. The Impact of Climate Change on the Glaciers of the Canadian Rocky Mountain Eastern Slopes and Implications for Water Resource Adaptation in the Canadian Prairies. Geological Survey of Canada Open File 4322.
- ↑ Weidick, A., 1968. Observation on some Holocene glacier fluctuations in West Greenland. Meddelelser om Grønland, 165(6) 202pp.
- ↑ Möller, D., 1996. Die Höhen und Höhenänderungen des Inlandeises. Die Weiterfürung der geodätischen Arbeiten der Internationalen Glaziologischen Grönland-Expedition (EGIG) durch das Institut für Vermessungskunde der TU Braunschweig 1987–1993. Deutsche Geodätische Kommission bei der Bayrischen Akademie der Wissenschaften, Reihe B, Angewandte Geodäsie, Heft Nr. 303. Verlag der Bayrischen Akademie der Wissenschaften: 49–58.
- ↑ Rignot, E. and R.H. Thomas, 2002. Mass balance of the polar ice sheets. Science, 297:1502–1506.
- ↑ Krabill,W.,W. Abdalati, E. Frederick, S. Manizade, C. Martin, J. Sonntag, R. Swift, R. Thomas,W. Wright and J.Yungel, 1999. Greenland Ice Sheet: High-elevation balance and peripheral thinning. Science, 289:428–430.
- ↑ 34.0 34.1 Rignot, E. and R.H. Thomas, 2002. Mass balance of the polar ice sheets. Science, 297:1502–1506.
- ↑ Zwally, H.J., W. Abdalati, T. Herring, K. Larson, J. Saba and K. Steffen, 2002. Surface melt-induced acceleration of Greenland ice-sheet flow. Science, 297:218–222.
- ↑ 36.0 36.1 Sigurôsson, O., 1998. Glacier variations in Iceland 1930–1995 – From the database of the Iceland Glaciological Society. Jökull, 45:3–25.
- ↑ Steffen, K., 2003. Cooperative Institute for Research in Environmental Sciences, University of Colorado.
- ↑ Jóhannesson,T. and O. Sigurôsson, 1998. Interpretation of glacier variations in Iceland 1930–1995. Jökull, 45:27–33.
- ↑ Björnsson, H., F. Pálsson and H.H. Haraldsson, 2002. Mass balance of Vatnajökull (1991–2001) and Langjökull (1996–2001), Iceland. Jökull, 51:75–78.–Sigurôsson, O., 2002. Jöklabreytingar 1930–1960,1960–1990 og 1999–2000. (Glacier variations 1930–1960, 1960–1990 and 1999–2000.) Jökull, 51:79–86.
- ↑ Björnsson, H., F. Pálsson and H.H. Haraldsson, 2002. Mass balance of Vatnajökull (1991–2001) and Langjökull (1996–2001), Iceland. Jökull, 51:75–78.
- ↑ Sigurôsson, O., 2005. Variations of termini of glaciers in Iceland in recent centuries and their connection with climate. In: C. Caseldine, A. Russell, J. Hardardóttir and O. Knudsen (eds.). Iceland - Modern Processes and Past Environments, pp. 180–192. Elsevier.
- ↑ Sigurôsson, O., 2002. Jöklabreytingar 1930–1960,1960–1990 og 1999–2000. (Glacier variations 1930–1960, 1960–1990 and 1999–2000.) Jökull, 51:79–86.
- ↑ Hagen, J.O. and O. Liestøl, 1990. Long term glacier mass balance investigations in Svalbard 1950–1988. Annals of Glaciology, 14:102–106.–Lefauconnier, B., J.O. Hagen, J.B. Ørbeck, K. Melvold and E. Isaksson, 1999. Glacier balance trends in the Kongsfjorden area, western Spitsbergen, Svalbard, in relation to the climate. Polar Research, 18(2):307–313.
- ↑ 44.0 44.1 44.2 Bjarne Kjøllmoen (Ed.), Liss M. Andreassen, Hallgeir Elvehøy, Miriam Jackson, Arve M. Tvede, Tron Laumann and Rianne H. Giesen. "Glaciological investigations in Norway 2006" (pdf). NVE Report 1 2007. Retrieved on 2007-08-29.
- ↑ Glazovsky, A.F., 1996. Russian Arctic. In: J. Jania and J.O. Hagen (eds.). Mass Balance of Arctic Glaciers, pp. 44–53. International Arctic Science Committee Report No. 5.–Koryakin,V.S., 1997. Glaciers of Novaya Zemlya. Zemlya i Vselennaya (Earth and Universe), 1:17–24. (In Russian)
- ↑ Koryakin,V.S., 1997. Glaciers of Novaya Zemlya. Zemlya i Vselennaya (Earth and Universe), 1:17–24. (In Russian)
- ↑ Zeeberg, J.J. and S.L. Forman, 2001. Changes in glacier extent on north Novaya Zemlya in the twentieth century. The Holocene, 11(2):161–175.
- ↑ Glazovsky, A.F., 2003. Pers. comm. Russian Academy of Sciences.
- ↑ Glazovsky, A.F., 1996. Russian Arctic. In: J. Jania and J.O. Hagen (eds.). Mass Balance of Arctic Glaciers, pp. 44–53. International Arctic Science Committee Report No. 5.
- ↑ Glazovsky, A.F., 1996. Russian Arctic. In: J. Jania and J.O. Hagen (eds.). Mass Balance of Arctic Glaciers, pp. 44–53. International Arctic Science Committee Report No. 5.
- ↑ Dyurgerov, M.B. and M.F. Meier, 1997. Year-to-year fluctuations of global mass balance of small glaciers and their contribution to sea-level change. Arctic and Alpine Research, 29:392–401.–Óerlemans, J. and B.K. Reichert, 2000. Relating glacier mass balance to meteorological data using a Seasonal Sensitivity Characteristic (SSC). Journal of Glaciology, 46:1–6.
- ↑ Oerlemans, J., 2003. Utrecht University, the Netherlands.
- ↑ Van de Wal, R.S. W. and M. Wild, 2001. Modelling the response of glaciers to climate change by applying volume-area scaling in combination with a high-resolution GCM. Climate Dynamics, 18:359–366.
- ↑ Oerlemans, J., 2003. Utrecht University, the Netherlands.
- ↑ Ohmura, A., M. Wild and L. Bengtsson, 1996. A possible change in mass balance of Greenland and Antarctic ice sheets. Journal of Climate, 9:2124–2137.
- ↑ Van de Wal, R.S. W. and M. Wild, 2001. Modelling the response of glaciers to climate change by applying volume-area scaling in combination with a high-resolution GCM. Climate Dynamics, 18:359–366.
- ↑ Arendt, A. A., K.E. Echelmeyer, W.D. Harrison, C. A. Lingle and V.B. Valentine, 2002. Rapid wastage of Alaska glaciers and their contribution to rising sea level. Science, 297:382–386.–Meier, M.F. and M.B. Dyurgerov, 2002. How Alaska affects the world. Science, 297:350–351.
- ↑ Rignot, E. and R.H. Thomas, 2002. Mass balance of the polar ice sheets. Science, 297:1502–1506.
- ↑ Van de Wal, R.S. W., M. Wild and J. de Wolde, 2001. Short-term volume changes of the Greenland ice sheet in response to doubled CO2 conditions. Tellus, 53B:94–102.
- ↑ Church, J. A., J.M. Gregory, P. Huybrechts, M. Kuhn, L. Lambeck, T. Nhuan, M.Y. Qin and P.L. Woodworth, 2001. Changes in sea level. In: J. T. Houghton,Y. Ding, D.J. Griggs, M. Nogeur, P.J. Van der Linden, X.Dai, K. Maskell, C. A. Johnson (eds). Climate Change 2001. The Scientific Basis, pp. 641–693. Intergovernmental Panel on Climate Change, Cambridge University Press.–Dyurgerov, M.B. and M.F. Meier, 1997. Year-to-year fluctuations of global mass balance of small glaciers and their contribution to sea-level change. Arctic and Alpine Research, 29:392–401.
- ↑ IPCC, 2001. Climate Change 2001:The Scientific Basis. Contribution of Working Group I to the Third Assessment Report of the Intergovernmental Panel on Climate Change. J. T. Houghton, Y. Ding, D.J. Griggs, M. Noguer, P.J. van der Linden, X. Dai, K. Maskell and C. A. Johnson (eds.). Cambridge University Press, 881pp.