Energy from Fossil Fuels (historical)
| Topics: |
Originally Published As:
Title: Energy from Fossil Fuels
Author: M. King Hubbert
Source: Science, volume 109, pages 103-109
Year published: 1949
EDITOR'S NOTE: M. King Hubbert (1903-1989) was an American geophysicist best known for his accurate prediction of the peak in oil production in the lower 48 United States. In a 1956 paper, he published what is now known as the Hubbert Curve, a simple mathematical model of oil supply; he used this to predict that the peak of crude-oil production in the United States would occur between 1966 and 1971. It actually occurred in 1970. The foundations of the Hubbert Curve were laid down in this 1949 paper that describes the production growth cycle for fossil fuels.
The earth may be regarded as a material system whose gain or loss of matter over the period of our interest is negligible. Into and out of this system, however, there occurs a continuous flux of energy, in consequence of which the material constituents of the surface of the earth undergo continuous or intermittent circulation. For the present discussion we shall restrict our attention to nonradioactive materials. The preponderance of the energy involved in this process is that derived from solar radiation, and a small fraction of the material at or near the surface of the earth occurs in the peculiar aggregates known living organisms. From geological evidence, organisms have existed upon the earth for probably as long as a billion years, and it appears that evolution had preceded far enough that a species recognizable as man must have existed roughly a million years ago. The population of this species at that stage is unknown but evidently was not large. It existed in some sort of ecological adjustment with the rest of the organic complex for a share of solar energy essential to its existence. At that hypothetical stage its sole capacity for the utilization of energy consisted in the food it was able to eat—the order of 2,000 kilogram-calories per capita per day.
Emancipation from this dependence upon contemporary solar energy was not possible until some other and hitherto unknown source of energy became available. This had its beginning about the thirteenth century when some of the inhabitants of Britain made the discovery that certain black rocks found along the shoe of the East Coast, and thereafter known as “sea coles” would burn. From this discovery there followed in almost inevitable succession the mining of coal and its use for the smelting of metals, the development of the steam engine, locomotive, the steamship and steam-electric power.
This development was further augmented when, about a century ago, the second large source of fossil energy—petroleum and natural gas—was tapped, leading to the internal combustion engine, the automobile, the aeroplane, and Diesel-electric power.
A third source of fossil energy, oil shale, although exploited on a small scale for almost a century, is only now approaching its phase of rapid development.
Contents
Rates of production
It is to the rate of increase and the magnitude of the consumption of energy from fossil fuels that I now wish to direct your attention.
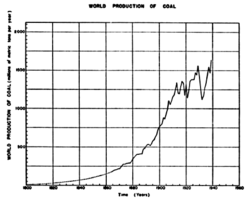
Consider coal. Although production statistics for the earlier periods are not available, it is known that from the initial discover and use of “sea coles” to the present there has been a continuous increase in the rate of consumption of this commodity. During the eighteenth century the need for power for the coal mines led to the development of the steam engine, and the demand for better means of transportation led first to the railroad and then to the steam locomotive. We know also that before the end of the eighteenth century the employment of this new source of energy had reached such a magnitude in Britain as to produce the major social and economic disturbances referred to as the “Industrial Revolution.”
By 1864[1][2], from which date annual world production statistics are available, the annual production of coal in the world had reached about 180 million metric tons per year, and from that date until 1914, when it had reached a rate of 1,300 million tons per year, it continued to increase geometrically at the rate of 4 percent per year, or at a rate such that the annual production was doubling every 17 years.
The length of time during which coal has been mined is likely to be misleading. To appreciate the magnitude of what is happening and the brevity of time during which most of it has occurred, consider these facts; By the end of 1947 the cumulative production of coal during all past human history amounted to approximately 81 billion metric tons. Of this, 40 billion, or approximately on half, has been mined and consumed since 1920. Sixty-two billion, or more than three-quarters, has been produced since 1900.
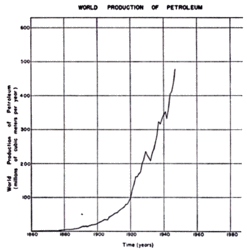
The world production of petroleum is shown graphically in Fig. 2.[3] The first commercial production of petroleum was begun in 1857 in Rumania. Two years later the first oil well in the United States was completed. From the beginnings, with only an occasional setback, the world production of petroleum has increased spectacularly, reaching by the end of 1947 an annual rate of 477 million cubic meters. From 1860 to 1929 the rate of production doubled, on the average, every 7.5 years, or at an average annual rate of increase of slightly more than 9 percent. Since 1929 the rate of increase has declined somewhat and the doubling period increased to about 15 years.
Again, to emphasize the brevity of time during which most of this has occurred, the cumulative production by the end of 1947 was 9.17 billion cubic meters (57.7 billion U.S. barrels). Of this, one-half has been produced and consumed since 1937, or during the last 10 years, and 97 percent since 1900.
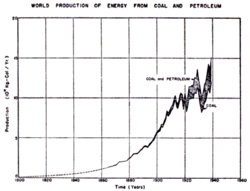
The energy content of the coal and petroleum, which has been consumed, expressed in kilogram-calories, is shown in Fig 3. From these two sources the energy per year amounted in 1939 to 15 x 1015, or 15 thousand trillion, kilogram-calories per year, of which approximately four-fifths and one-fifth were contributed by coal and petroleum respectively.
Because of the lack of world production statistics, the energy from natural gas has not been included. In the United States about 400 cubic meters of natural gas are produced for each cubic meter of oil, with an energy content of about four-tenths that of oil. Since oil and gas are genetically related it may be presumed that this approximate ratio is valid for the rest of the world also. Hence, the energy from the natural gas that has been produced may be assumed to be at least 40 percent of that of petroleum.
Growth of population
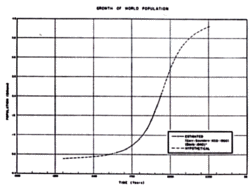
One of the most disturbing ecological influences of recent millennia is the human species’ proclivity for the capture of energy, resulting in a progressive increase of the human population.[4][5] This is borne out by the growth curve of human population since 1650, shown in Fig. 4, based on the studies of Carrie Saunders[6], and the recent estimate of Davis[7]. According to these estimates, the world population has increased from about 545 million in 1650 to 2,171 million by 1940. The greatest rate of increase during this period has been that of the last half-century, during which the world population has been increasing at such a rate as to double itself every century, or at an annual rate of increase of 0.7 percent.
Such a rate is not “normal,” as can be seen by backward extrapolation. If it had prevailed throughout human history, beginning with the mythical Adam and Eve, only 3,300 years would have been required to reach present population. If, on the contrary, we assume the human race to have been in existence for a million years, and to have increased at a uniform exponential or geometrical rate, starting with a single pair, the present population would have been reached in the time by a rate of increase of 2.1 x 10⁻⁴ percent per year, or a rate of growth that would require 33,000 years for the population to double. At such a rate it is doubtful whether any census could detect a change in the population during one man’s lifetime.
That the present rate of growth cannot long continue is also evident when we consider that at this rate only 200 more years would be required to reach a population of nearly 9 billion—about the maximum number of people the earth can support. In fact, at such a rate, only 1600 years would be required to reach a population density of one person for each square meter of the land surface of the earth.
Prior to 1800 most of the energy available to man was that derivable from his food, the labor of his animals, and the wood he used for fuel. On a world-wide basis it is doubtful if the sum of these exceeded 10,000 kilogram-calories per man per day, and this was a severalfold increase over the energy from food alone.
After 1800 there was superposed on top of these sources the energy from fossil fuels. From a world average of 300 kilogram-calories per capita per day in 1800 the energy from coal and petroleum increased to 9,880 by 1900 and to 22,100 by 1940. In the areas of high industrialization this quantity is much larger. In the United States, for example, the energy from coal and petroleum consumed per day per capita amounted in 1940 to 114,000 kilogram-calories[8]; and from coal, petroleum and natural gas, to 129,000.
Physical limits to expansion
From the foregoing data it should be clear that while we are concerned with a progression of ancient origin, the developments within the last century, and especially within the last few decades, are decidedly exceptional. One cannot refrain from asking, “Where is it taking us? How long can we keep it up?”
This leads us to consider what physical limitations there may be upon the various types of energy whose expansion we have noted. In the case of the fossil fuels the answer is simple. As remarked before, these fuels represent an accumulation over 500 million years of geologic time, and any additional accumulation that may be expected within the next 10,000 years is negligible. When these fuels are burned (Combustion), their material content remains upon the earth in a relatively useless form, but the precious energy, after undergoing a sequence of degradations, finally leaves the earth as spent, long-wavelength, low-temperature radiation. Hence, we deal with an essentially fixed storehouse of energy, which we are drawing upon at a phenomenal rate. The amount, which remains at any given time, equals the amount initially present less that which has been consumed already.
The amount consumed up to any given time is proportional to the area under the curve of annual production plotted against time. This area may approach but can never quite equal the amount initially present. Thus we may announce with certainty that the production curve of any given species of fossil fuel will rise, pass through one or several maxims, and then decline asymptotically to zero. Hence, while there is an infinity of different shapes that such a curve may have, they all have this in common: that the area under each must be equal to or less than the amount initially present.
Amounts of fossil fuels
While the quantities of fuels upon the earth are not known precisely, their order of magnitude is pretty definitely circumscribed. The most accurately known is coal. At the Twelfth International Geological Congress at Ottawa in 1913 a world review of coal was made and the amount capable of being mined was estimated to be about 8 x 10¹² metric tons. Since that time some adjustments in the estimates have been made, giving us a present figure of about 6.3 x 10¹² metric tons of coal initially present.
Within the last few years this figure has been criticized by mining engineers[9][10] on the grounds that while the estimated amount of coal may in fact be present, the amount recoverable by practical mining operations is by a fraction—possibly as small as one-tenth—of the forgoing estimate. The degree of validity of this criticism still remains to be determined.
For petroleum the estimation is considerably less accurate than that for coal but still it is probably reliable as to the order of magnitude. The method of estimation in this case is that of sampling. In the better-known areas the amount of petroleum produced per unit volume of certain classes of rocks has been determined. The areas and volumes (within drillable depths) of similar rocks over he earth are fairly well known. By application of the same factor for the undrilled areas as for those now well known, an order of magnitude of the petroleum that may exist may be obtained.
The most comprehensive studies so far made public appear to be those of Weeks, which are cited by Wallace E. Pratt[11][12][13]. According to these studies, in a volume of 10-12.5 million cubic kilometers (2.5-3.0 million cubic miles) of sediments in the United States there have already been discovered 8.4 x 10⁹ cubic meters (53 x 109 barrels) of oil. This represents about 10 percent of the total volume of such sediments of the land areas throughout the world. Hence, it is estimated that for the world there should have been present initially about ten times as much oil as for the United States. A similar volume of sediments occurs on the continental shelves, which may contain about as much oil as the land sediments.
Assuming that the land areas of the United States will produce 16 x 109 cubic meters (100 billion barrels), then a reasonable estimate for the world would be:
- Land: 160 x 109 cubic meters </dd>
- Continental Shelves: 160 x 109 cubic meters </dd>
- Total: 320 x 109 cubic meters </dd>
These figures are regarded as being somewhat liberal and the quantity of oil may actually be considerably less. Not included in the figures are the Athabasca Tar Sands[14], estimated to contain about 30 x 109 cubic meters of oil. The amount of natural gas may be estimated at 400 cubic meters of gas for one of oil, or at an energy content of 40 percent that of oil.
The oil shales of the world, are less well known. Those of the United States, especially the Green Rive shales, are estimated to contain at least 55 x 109 cubic meters of oil. Assuming that the rest of the world about three times the amount of oil shales in the United States, we would obtain, for an order of magnitude, 160 x 109 (1,000 billion barrels) of oil from this source.
The results of these estimates are given in Table 1. and shown graphically in Fig. 5. It will be noted that 92 percent of the estimated total is represented by coal—a figure which will not be greatly altered by any reasonable adjustments of the estimates of the remaining fuels, but may be considerably altered if the minable amount of coal is less than usually assumed.
The amount of the initial coal already consumed is 1.35 percent; that of oil and natural gas, inclusive of the Athabasca Tar Sands, about 5 percent. The fraction of shale oil already produced is negligible. From these data the estimated initial supply of energy stored in fossil fuels is of the order of 50 x 1018 kilogram-calories, of which 0.7 x 10¹⁸, or 1.5 percent, has already been consumed.
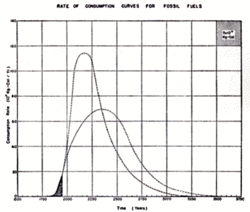
With this information we are prepared to consider what the future consumption of fossil energy may be. In Fig. 6 is shown the production of fossil energy up to the present, and two possible projections into the future. One production curve rises to a high peak and descends steeply: the second rises more slowly to a lower maximum and descends gently. The area under each curve, however, is approximately the same each of which represents 5 x 10¹⁸ kilogram-calories.
If, as the coal mining engineers intimate, the amount of coal is much less than herein assumed, the area under the curve will be that much smaller and the approach to exhaustion that much sooner. How soon the decline may set in, it is not possible to say. Nevertheless, the higher the peak of the production curve, the sooner and sharper will be the decline.
Water power
The exploitation of water power, like that of coal, is of fairly ancient origin, but also like coal, until the last half-century its utilization has been small. Unlike fossil fuels, however, water power represents a fraction of current solar energy which changes but slowly with time, and is being continuously degraded into waste heat irrespective of whether it is utilized or not.
A growth curve of utilization of water power, therefore, should rise in a manner similar to those of the fossil fuels, but instead of then declining to zero, it should level off asymptotically to a maximum as all available water power is brought into use. At least this is physically possible.
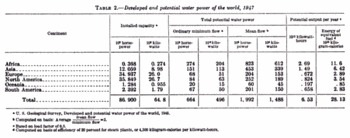
In view of the eventual exhaustion of fossil fuels, it is of interest to know what extent water power can be depended upon to replace them. In Table 2 are listed the installed water power capacities of the various continents for year 1947 and estimates of their total potential capacities[15], the number of kilowatt-hours of energy that such capacity should produce per year, and finally, the energy, expressed in heat units, of the amount of fuel that would be required to produce an equivalent amount of power.
In these calculations the potential installed capacity is taken to be equal approximately to the power at a mean rate of flow and 100 percent efficiency. The estimated output is based on a load factor of 0.5, and the fuel equivalent of the power produced is based upon a thermodynamic efficiency of steam plants of 20 percent—figures which characterize installations in the United States at the present time.
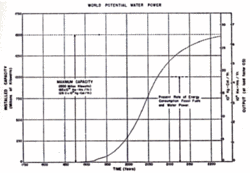
The present and potential water power for the world is summarized graphically in Fig. 7. The potential capacity is about 1,500 million kilowatts of which present installations amount to only 65 million, or 43 percent.
The energy content of the equivalent fuel which would be required to produce the potential water power output is about 28 x 1015 kilogram-calories per year, or one and half times the present rate of consumption of energy from fossil fuels.
Hence, with maximum utilization, it would b possible with water power to supply to the earth an amount of energy comparable to that currently obtained from the use of fossil fuels.
Time perspective
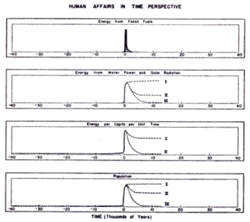
The present state of human affairs can best be appreciated in the light of a time perspective, minus and plus, of some tens of thousands of years from the present, as depicted in Fig. 8. On such a time scale the phenomena we have discussed are represented by abrupt, nearly vertical rises from zero or near zero to maximum values. The consumption of energy from fossil fuels is thus seen but a “pip”, rising sharply from zero to a maximum, and almost as sharply declining, and thus representing but a moment in the total of human history.
The rate of consumption of energy from water power and solar radiation also rises almost vertically. It is physically capable of leveling off asymptotically to a maximum value as shown in Curve I and being held there more or less indefinitely. However, it is also possible that it may decline to some lower intermediate value as shown by Curve II, or to zero, as in Curve III, depending upon the state of human culture during the next few thousand years.
Likewise the consumption of energy per capita, after having risen very gradually from 2,000 to possibly 10,000 kilogram-calories per day, is seen to increase suddenly to a maximum value of several times the highest previous value. Again it is physically possible to maintain a high value, as indicated by Curve I, on a stable basis for an indefinite period of time from current energy sources, particularly direct and indirect solar radiation. It also is possible, however, that through cultural degeneration this curve may decline, as in Curve II, to the subsistence level of our agrarian ancestors.
Viewed on such a time scale, the curve of human population would be flat and only slightly above zero for all preceding human history, and then it too would be seen to rise abruptly and almost vertically to a maximum value of several billion. Thereafter, depending largely upon what energy supplies are available, it might stabilize at a maximum value, as in Curve I, or more probably to a lower and more nearly optimum value, as in Curve II. However, should cultural degeneration occur so that the available energy resources should not be utilized, the human population would undoubtedly be reduced to a number of appropriate to an agrarian existence, as in Curve III.
These sharp breaks in all the foregoing curves can be ascribed quite definitely, directly or indirectly, to the tapping of the large supplies of energy stored up in the fossil fuels. The release of this energy is a unidirectional and irreversible process. It can only happen once, and the historical events associated with this release are necessarily without precedent, and are intrinsically incapable of repetition.
It is clear, therefore, that our present position on the nearly vertical front slopes of these curves is a precarious one, and that the events which we are witnessing and experiencing, far from being “normal,” are among the most abnormal and anomalous in the history of the world. Yet we cannot turn back; neither can we consolidate our gains and remain where we are. In fact, we have no choice but to proceed into a future which we may be assured will differ markedly from anything we have experienced thus far.
Among the inevitable characteristics of this future will be the progressive exhaustion of the mineral fuels, and the accompanying transfer of the material elements of the earth from naturally occurring deposits of high concentration to states of low concentration dissemination. Yet despite this, it will still be physically possible to stabilize the human population at some reasonable figure, and by means of the energy from sunshine alone to utilize low-grade concentrations of materials and still maintain a high-energy industrial civilization indefinitely.
Whether this possibility shall be realized, or whether we shall continue as at present until a succession of crises develop—overpopulation, exhaustion of resources and eventual decline—depends largely upon whether a serious cultural lag can be overcome. In view of the rapidity with which the transition to our present state has occurred it is not surprising that such a cultural lag should exist, and that we should continue to react to the fundamentally simple physical, chemical, and biological needs of our social complex with the sacred-cow behavior patterns of our agrarian and pre-scientific past. However, it is upon our ability to eliminate this lag and to evolve a culture more nearly in conformity with the limitations imposed upon us by the basic properties of matter and energy that the future of our civilization largely depends.

