Nuclear Energy and the Fossil Fuels (historical)
Originally Published As:
Title: Nuclear Energy and the Fossil Fuels
Author: M. King Hubbert
Source: Presented before the Spring Meeting of the Southern District Division of Production, American Petroleum Institute, San Antonio, Texas, March 8, 1956. Publication No. 95. Houston: Shell Development Company, Exploration and Production Research Division, 1956.
Year published: 1956
EDITOR'S NOTE: M. King Hubbert (1903-1989) was an American geophysicist best known for his accurate prediction of the peak in oil production in the lower 48 United States. In this paper, he published what is now known as the Hubbert Curve, a simple mathematical model of oil supply, and he used this to predict that the peak of crude-oil production in the United States would occur between 1966 and 1971. It actually occurred in 1970. The foundations of the Hubbert Curve were laid down in a 1949 paper that describes the production growth cycle for fossil fuels.
The evolution of our knowledge of petroleum since Colonel Drake's discovery of oil in Titusville, Pennsylvania, nearly a century ago, resembles in many striking respects the evolution of knowledge of world geography which occurred during the century following Columbus' discovery of America. During that period several continents, a number of large islands, and numerous smaller islands were discovered, but how many more might there be? Also during that period geographical charts had to be continuously revised in order to incorporate the new discoveries that were repeatedly being made, and also to correct some earlier speculations which had proved to be seriously in error. In addition, more detailed knowledge of the shore lines and other features of the areas discovered earlier was rapidly accruing, which also had to be added to the charts.
Then, as now, a voyager starting out on a major expedition of discovery needed to equip himself with charts of two kinds. He needed the large-scale detailed charts for piloting along known shores, and the comprehensive charts of whole oceans, or even of the known world, as a guide for his major navigations.
Likewise, for the petroleum industry the last century has been a period of bold adventure and discovery. Whole petroleum provinces analogous to the continents have been discovered and partly explored; a few tens of very large fields, corresponding to the large islands, and hundreds of small fields, the small islands, have been discovered. But how far along have we come on our way to complete exploration?
In the petroleum industry, for the last several decades – particularly in the United States – we have been conscious of a need for charting our progress, and thanks to the services of the American Petroleum Institute, the American Gas Association, the Petroleum Branch of the American Institute of Mining, Metallurgical, and Petroleum Engineers, the American Association of Petroleum Geologists, the United States Geological Survey and Bureau of Mines, we have been able to chart with considerable accuracy our past accomplishments, and our present status with regard to a short-term outlook. Longer-range reviews have had to be made with respect to specific problems, such as whether to build a given pipeline or refinery. But for the most part our outlook has been dominantly contemporary with concern principally for the next few years, and with only occasionally[2] a bolder adventure into the more distant future.
To continue the navigation analogy, what we seem to have achieved is an abundance of detailed charts of local areas, with only an occasional attempt to construct, shall we say, a map of the whole world which, despite its inherent imperfections, is still necessary if we are to have even an approximate idea of where we are now, and where we are going. The object of this discourse will be to see what can be done in this direction with the information presently available.
As a general orientation, let us consider that the petroleum industry is primarily an energy industry and secondarily a chemical industry. As an energy industry it utilizes the energy content of certain naturally occurring chemicals, namely the liquid and gaseous hydrocarbons. As a chemical industry it utilizes the material content of these same resources as constituting a complex array of organic molecules which have already been synthesized and are therefore available as the starting point of a series of enormously complex organic chemical products. In this respect it is again only one aspect of a much broader chemical industry utilizing coal, inorganic minerals, and plant and animal raw materials, in addition to petroleum.
The fossil fuels, which include coal and lignite, oil shales, and tar and asphalt, as well as petroleum and natural gas, have all had their origin from plants and animals existing upon the earth during the last 500 million years. The energy content of these materials has been derived from that of the contemporary sunshine, a part of which has been synthesized by the plants and stored as chemical energy. Over the period of geological history extending back to the Cambrian, a small fraction of these organisms have become buried in sediments under conditions which have prevented complete deterioration, and so, after various chemical transformations, have been preserved as our present supply of fossil fuels. When we consider that it has taken 500 million years of geological history to accumulate the present supplies of fossil fuels, it should be clear that, although the same geological processes are still operative, the amount of new fossil fuels that is likely to be produced during the next few thousands of years will be inconsequential. Therefore, as an essential part of our analysis, we can assume with complete assurance that the industrial exploitation of the fossil fuels will consist in the progressive exhaustion of an initially fixed supply to which there will be no significant additions during the period of our interest.
Throughout all human history until about the thirteenth century, the human race, in common with all other members of the plant and animal complex, had been solely dependent upon the contemporary solar energy which it had been able to command. This comprised the energy from the food it was able to consume, that of the wood burned (Combustion) for fuel, and a trivial amount of power obtained from beasts of burden, from wind, and from flowing water.
The episode of our present concern began when the inhabitants of northeast England discovered that certain black rocks found along the seashore, and thereafter known as "sea coles," would burn. Thus began the mining of coal and the first systematic exploitation of the earth's supply of fossil fuels. Its greatest significance, however, lay in the fact that for the first time in human history mankind had found a huge supply of concentrated energy by means of which the energy that could be commanded by one person could be greatly increased. The industrialization of the world with its concomitant consequences for the human population has been the direct result of that initial discovery.
To the energy obtained from coal there has been added, since about the middle of the last century, that from petroleum and natural gas, and a limited amount from oil shale.
Time does not permit of even a summary of the major consequences of the utilization of these two sources of energy, but as history shows, the immensity of human operations has been increased by several orders of magnitude.
Contents
Rise of Production of Fossil Fuels
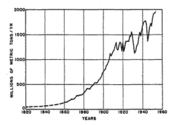
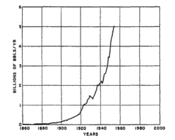
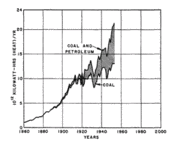
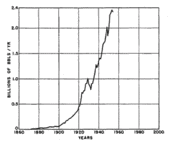
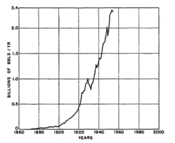
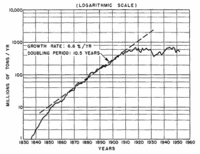
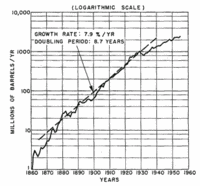
No better record exists of the history of the exploitation of the fossil fuels than the annual statistics of their production. In Figure 1 there has been plotted the world production of coal since 1860[3], in Figure 2 the world production of crude oil, and in Figure 3 the combined production of energy from coal and crude oil.
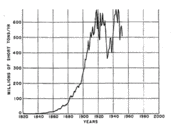
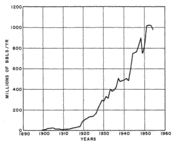
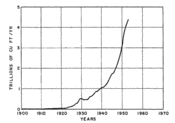
The production of coal in the United States is shown in Figure 4, that of crude oil in Figure 5, and the production of marketed natural gas in Figure 6. The production of crude oil in Texas is shown in Figure 7, and that of marketed natural gas in Figure 8.
Since these curves embody just about all that is essential in our knowledge of the production of energy from the fossil fuels on the world, a national, and a state scale, it is worth our attention to study them briefly. In the first place, it will be noted that there is a strong family resemblance among them. Each curve starts slowly and then rises more steeply until finally an inflection point is reached after which it becomes concave downward. For the world coal production this point was reached about the beginning of World War I, and for world petroleum production it appears to have been as recently as 1951 or 1952.
For the production of coal in the United States the inflection point also occurred about 1914, and the inflection points for petroleum and natural gas apparently about 1952. The inflection points for the Texas production of oil and gas occur at about the same dates as those for the United States.
A more informative representation of the rate of growth of the production can be obtained by plotting the logarithm of the production rate versus time on semilogarithmic graph paper. This has been done in Figures 9 and 10 for the United States production of coal and crude oil, respectively. It will be noted in each case that the curve approximates a straight line until some definite date and then breaks away sharply downward. In the case of coal this departure from a straight line occurred about 1910, and for crude oil about 1930. All the other production curves shown in the preceding figures behave in a similar manner.
The significance of this is that during the initial stages all of these rates of production tend to increase exponentially with time. Goal production in the United States from 1850 to 1910 increased at a rate of 6.6 percent per year, with the production doubling every 10.5 years. Crude-oil production from l880 until 1930 increased at the rate of 7.9 percent per year, with the output doubling every 8.7 years.
During the corresponding growth phases, world production of coal increased at the rate of 4.3 percent per year, with production doubling every 16 years, and world production of crude oil increased at a rate of 7 percent per year, with the rate of output doubling every 10 years.
These facts alone force one to ask how long such rates of growth can be kept up. How many periods of doubling can be sustained before the production rate would reach astronomical magnitudes? That the number must be small can be inferred from the fact that after n doubling periods the production rate will be increased by a factor of 2n. Thus in ten doubling periods the production rate would increase by a thousandfold; in twenty by a millionfold. For example, if at a certain time the production rate were 100 million barrels of oil per year – the U.S. production in 1903 – then in ten doubling periods this would have increased to 100 billion barrels per year. No finite resource can sustain for longer than a brief period such a rate of growth of production; therefore, although production rates tend initially to increase exponentially, physical limits prevent their continuing to do so.
This rapid rate of growth shown by the production curves makes them particularly deceptive with regard to the future length of time for which such production may be sustained. For example, coal has been mined continuously for about 800 years, and by the end of 1955 the cumulative production for all of this time was 95 billion metric tons. It is somewhat surprising, however, to discover that the entire period of coal mining up until 1925 was required to produce the first half, while only the last 30 years has been required for the second half.
Similarly, petroleum has been produced in the United States since l859, and by the end of 1955 the cumulative production amounted to about 53 billion barrels. The first half of this required from 1859 to 1939, or 80 years, to be produced; whereas, the second half has been produced during the last 16 years.
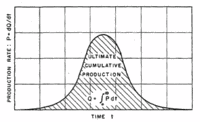
A more effective means[4] of extrapolating such growth curves is afforded by two basic considerations: (l) For any production curve of a finite resource of fixed amount, two points on the curve are known at the outset, namely that at t = 0 and again at t = ?. The production rate will be zero when the reference time is zero, and the rate will again be zero when the resource is exhausted; that is to say, in the production of any resource of fixed magnitude, the production rate must begin at zero, and then after passing through one or several maxima, it must decline again to zero. (2) The second consideration arises from the fundamental theorem of the integral calculus; namely, if there exists a single-valued function y = f(x), then
ʃ0x(1) ydx = A
P = dQ/dt
where dQ is the quantity of the resource produced in time dt. Likewise, from equation (l) the area under the curve up to anytime t is given by
A = ʃ0t Pdt = ʃ0t (dQ/dt) = Q
where Q is the cumulative production up to the time t. Likewise, the ultimate production will he given by
Qmax = ʃ0∞ Pdt
and will be represented on the graph of production-versus-time as the total area beneath the curve. These basic relationships are indicated in Figure 11. The only a priori information concerning the magnitude of the ultimate cumulative production of which we may be certain is that it will be less than, or at most equal to, the quantity of the resource initially present. Consequently, if we knew the quantity initially present, we could draw a family of possible production curves, all of which would exhibit the common property of beginning and ending at zero, and encompassing an area equal to or less than the initial quantity.That the production of exhaustible resources does behave in this way can be seen by examining the production curves of some of the older producing areas. In Figure 12, for example, there is shown the crude-oil production curve for the state of Ohio. In this case the production began its initial sharp rise in 1884, passed through three maxima between 1890 and 1900 with the peak about 1896, and since then has undergone a slow, steady decline.
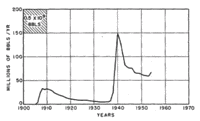
In Figure 13 is shown the corresponding curve for the state of Illinois, which is distinguished by having two widely separated and well-defined maxima, the second considerably larger than the first. The reason for these two maxima is well known. With the exception of occasional outcrops in local areas, the state of Illinois is almost completely blanketed by glacial drift. The first period of discovery, beginning about 1905, was based on surface geology with meager outcrop data. Consequently in about five years most of the discoveries amenable to this method had been made and for the next 25 years these fields continued to produce at declining rates with no new discoveries being made. It was well known geologically, however, that the whole Illinois Basin was potentially oil bearing, which was later verified when a new cycle of exploration using the seismograph was initiated in 1937. The peak of this cycle of production was reached in 1940, with the subsequent decline continuing until 1953 following which there has been a slight increase of production.
The present outlook for Illinois has recently been summarized by Vincent and Witherspoon[5] of the Illinois State Geological Survey. Cumulative production until July 1, 1955, was 1.8 billion barrels, and reserves from existing fields were estimated to be 0.5 billion barrels by primary methods of production and 1.0 billion barrels by water flooding. In addition, the rocks of Middle Ordovician age (below the St. Peter sandstone) have not yet been explored, so that undiscovered reserves are estimated at from 0.5 to 1 billion barrels. The ultimate cumulative production from Illinois is estimated, therefore, at about 4 billion barrels.
On the graph of Illinois production (Figure 13), each square of the grid represents 0.5 billion barrels so that a total of eight squares can be allowed under the curve before it declines to zero. Three and one-half squares have already been used up, leaving about four and one-half still to go. This implies that a third cycle of discovery and production is still due to occur in Illinois, yielding about as much oil as has been produced already, but no fourth cycle appears likely.
Reserves of the Fossil Fuels
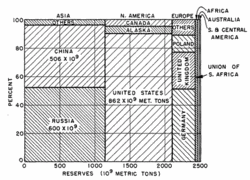
Coal.—In order to predict the future of the production of the fossil fuels, therefore, it is essential that the best possible estimates of the ultimate reserves he made. In the case of coal world-wide inventories have been made and revised intermittently since 1913. During the last decade an extensive re-examination of the coal reserves of the United States has been In progress by the United States Geological Survey, whose staff has also maintained current information on the reserves of the world. The results of the latest progress report of the Geological Survey[6], of the recoverable coal reserves of the world, are shown graphically in Figure 14. The total recoverable coal and lignite reserves of the world are now estimated to be about 2500 billion metric tons, of which the United States has about one-third, the U.S.S.R. about one-fourth, and China (Energy profile of China) about one-fifth of the total.
The sharp contrast between these figures and earlier estimates of about 6000 billion metric tons for the whole world requires explanation. The earlier estimates included both thin and deep beds of coal without too much regard for practicable minability. The later estimates have been restricted to beds that are more workable; this has resulted in a reduction from around 6000 to about 5000 billion metric tons. More seriously, however, the earlier estimates were of coal in place, whereas the data given in Figure 14 represent recoverable coal assuming a 50-percent loss in mining. This makes the coal reserves directly comparable to the data for petroleum reserves, which also are based upon recoverable oil rather than oil in place.
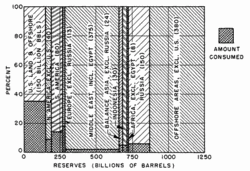
Crude Oil and Natural Gas.— The comparable data for world crude-oil reserves are presented in Figure 15. Here the distinction must be borne in mind between crude oil or petroleum and total "liquid hydrocarbons" or "petroleum liquids" In the early stages of the petroleum industry, the usable products were crude oil and natural gas, and most petroleum statistics still pertain to those two products. During recent decades, however, due to improved technology there has been an increasing yield of the so-called "natural-gas liquids" obtained as a by-product of natural gas. Statistics on total petroleum liquids, or liquid hydrocarbons, comprise both crude oil and natural-gas liquids.
Since the production curves here considered are of crude oil only, then the pertinent reserve data must also be limited to crude oil. The data in Figure 15 represent the estimated amounts of crude oil initially present which are producible by methods now in use. The cross-hachured part of each column represents the amount which has been consumed already. These estimates of ultimate potential reserves are, with two exceptions, those obtained by L. G. Weeks[7], of the Standard Oil Company of New Jersey, in his detailed studies of the various sedimentary basins of the world. Weeks estimated the ultimate potential reserves of the world to be 6l0 billion barrels for the land areas, and 400 billion barrels for the continental shelves, or roundly 1000 billion barrels in total. These estimates included 110 billion barrels for the land area of the United States, and 155 billion barrels for the Middle East, including Egypt (Energy profile of Egypt).
Subsequently the Middle East has developed into a petroleum province of unprecedented magnitude and Weeks' estimate is now known to be seriously too low. Recently Wallace E. Pratt[8], in the Report of the Panel on the Impact of the Peaceful Uses of Atomic Energy, gave as the proved reserves of liquid hydrocarbons for the Middle East the figure of 230 billion barrels. Since probably not less than 200 billion barrels of this is represented by crude oil, the estimate of the ultimate potential reserves of crude oil in the Middle East has been increased to 375 billion barrels, which can only be regarded as a rough order-of-magnitude figure.
In the case of the United States, Weeks' estimate of 110 billion barrels (based upon production practices of about 1948) was for the land area. The United States Geological Survey[9] has estimated potential offshore reserves of the United States, based upon the productivity of comparable adjacent land areas, to be as follows:
- Texas: 9 billion barrels </dd>
- Louisiana: 4 billion barrels </dd>
- California: 2 billion barrels </dd>
- Total: 15 billion barrels </dd>
Olaf P. Jenkins[10] of the California Division of Mines has estimated the offshore reserves of California to be 4 billion barrels. Combining this with the U.S. Geological Survey estimate for Louisiana and Texas gives 17 billion barrels, which has here been rounded off to 20 billion.
The production record of the past two decades, due in part to Improved recovery practices, indicates that Weeks' figure of 110 billion barrels for the land may also be somewhat low. This has accordingly been increased to 130 billion, giving a total ultimate potential reserve of 150 billion barrels of crude oil for both the land and offshore areas of the United States.
Although arrived at independently, this figure is in substantial agreement with Pratt's[11] figure of 170 billion barrels for the total liquid hydrocarbons of the United States. The ratio of crude oil to liquid hydrocarbons can be obtained approximately from the latest American Petroleum Institute[12] release on proved reserves. As of January 1, 1956, the proved reserves of crude oil were 30.0 billion barrels, while those of total liquid hydrocarbons was 35.4 billion barrels. Applying this ratio to Pratt's figure of 170 billion barrels of liquid hydrocarbons gives 144 billion barrels of crude oil.
With these modifications we obtain a figure of about 1250 billion barrels for the ultimate potential reserves of crude oil of the whole world.
Since crude oil and natural gas are genetically related, probably the most reliable procedure for estimating the ultimate reserves of natural gas is from the ratio of gas to crude oil in current production and in the proved reserves. No attempt has been made to do this for the whole world for which gas statistics and reserve estimates are largely lacking; but for the United States the net gas production during 1955 was 10.1 trillion cubic feet and the crude-oil production was 2.42 billion barrels, giving a production gas-oil ratio of 4200 cubic feet per barrel.
The proved reserves of gas and oil for January 1, 1956, as given by the American Gas Association[13] and the American Petroleum Institute[14] , are 224 trillion cubic feet of gas and 30.0 billion barrels of oil, respectively. This gives a gas-oil ratio of 7500 cubic feet per barrel.
Assuming the ultimate potential oil reserves of the United States to be 150 billion barrels of which 52.5 had been produced by January 1, 1956, leaves 97.5 billion barrels still to be produced. Then, if we use the gas-oil ratio of current production, we obtain 410 trillion cubic feet of gas as the future reserve. If we assume the ratio of 7500 cubic feet per barrel, obtained from proved reserves, we obtain a future reserve of 730 trillion cubic feet. Adding to these figures the cumulative production of 130 trillion cubic feet then gives as the ultimate potential gas reserve of the United States a low figure of 540 or a high of 860 trillion cubic feet. Of these figures the latter appears the more reliable since the reserves represent a much larger sample than the annual production. It also compares more favorably with the estimate of 750 trillion cubic feet recently made by Pogue and Hill[15] of the Chase Manhattan Bank, and is in substantial agreement with the figure of 850 trillion cubic feet given by Pratt[16]. Pratt's figure of 850 trillion cubic feet is accordingly the one that is here adopted.
On the basis of the relative magnitudes of the Texas rate of production and proved reserves as compared with those of the United States, an allotment of 40 percent of the total reserves of the United States to Texas appears to be of a proper order of magnitude. This would then give for Texas an ultimate potential reserve for crude oil of 60 billion barrels and 340 trillion cubic feet for natural gas. If the figure of 40 percent should be too low and the actual ratio more nearly 45 percent, then these reserve figures would be increased proportionately.
Oil Shales and Tar Sands.—The oil obtainable from oil shales in the United States has been taken to be 1000 billion barrels. This is based upon a revised figure recently released by the United States Geological Survey[17] of 900 billion barrels of oil for the shales of Colorado. A. C. Rubel[18] has recently made a review from published literature of all the bituminous shales of the United States which are potential sources of oil, and has arrived at an estimate of a possible 2.5 trillion barrels of oil obtainable from shale.
Outside the United States oil shales are present in various countries; but, with the exception of the shales in Brazil (Energy profile of Brazil), the magnitudes are negligible compared with those of the United States. The oil shales of Brazil are reported to be of about the same magnitudes as the earlier estimates for those of the United States, which would suggest an oil content of the order of 300 to 500 billion barrels.
The largest known deposit of tar sands in the world is that of the Athabaska tar sands in northeastern Alberta, Canada. The extractable oil content of these sands is still not accurately known, but current estimates range from about 300 to 500 billion barrels of oil. As compared with this the readily minable tar sands of the United States would yield only about 1 billion barrels of oil[19], with a few billion barrels more obtainable from the less minable deposits.
Other large deposits of uncertain magnitude exist in eastern Venezuela (Energy profile of Venezuela) and in Mesopotamia. Making liberal allowances for the possible magnitudes of these, Ayres and Scarlott[20] have ventured as an educated guess that the total oil obtainable from the tar deposits of the world might be as much as 800 billion barrels.
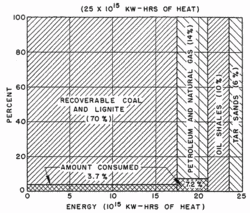
Energy Content.—The relative magnitudes of the initial world reserves of all the fossil fuels reduced to a common energy unit of measurement are shown in Figure 16. It will be noted that of all the fossil fuels initially present the recoverable energy of coal represents 70 percent of the total, oil and gas about 14 percent, oil shale about 10 percent, and tar sands about 6 percent.
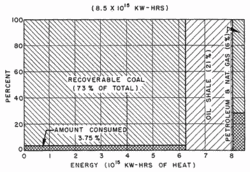
A corresponding chart of the fossil fuels of the United States is shown in Figure 17. The total of 8.5 X 10¹⁵ kw-hr of heat for the fuels of the United States represents about a third of the fossil fuels of the world. Again coal represents approximately three-fourths, oil shale about one-fifth, and oil and gas about 6 percent of the total, with one-quarter of the oil and gas already consumed.
Future Rates of Production
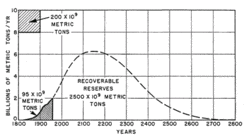
Utilizing the method of extrapolation described earlier and the reserve figures cited, we are now able to make some approximations of the future production curves for the various fossil fuels. This has been done in Figure 18 for the world coal production. The scale of the figure for cumulative production is given by the square in the upper left-hand corner. The altitude of this square is 2 X metric tons per year, and its base is 100 years. Its area, therefore, is:
2 x 10⁹ metric tons/yr x100 yrs = 200 x109 metric tons. Hence, in this diagram every square of the coordinate grid represents 200 billion tons of coal. Then, since the amount of recoverable coal initially present was 2600 billion tons, the area under the production curve can contain only 13 squares.
In the projection as drawn, it is assumed that the ultimate peak of production will be about three times the present rate; should this be the case, the peak would be reached at about the year 2150. If the maximum rate of production should be greater than this amount, then the peak would occur sooner; if the rate should be less, the peak would occur later. If the present rate of production should remain constant at about 2 billion metric tons per year, the coal supply would last about 1250 years from the present.
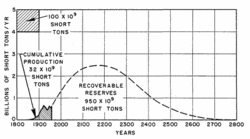
The production of coal in the United States has been similarly projected in Figure 19. In this case, the recoverable reserves are about 950 billion short tons and the cumulative production has been 32 billion tons. Since each square of the grid represents 100 billion tons, the total area under the curve should be about 10 squares. The curve has been drawn for an ultimate peak rate about four times that of the present. With this assumption, the maximum of the curve would likewise occur at about 2150. But the date of the culmination would be respectively earlier or later should the peak production rate be greater or less than has been assumed.
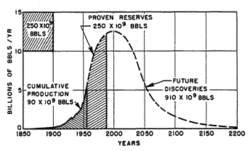
The same treatment for the world production of crude oil is shown in Figure 20. Here the ultimate potential production is taken to be the 1250 billion barrels shown in Figure 15. The unit rectangle of the grid represents 250 billion barrels. Consequently, the total area under the curve will contain but five of these rectangles. In Figure 20, the curve has been drawn on the assumption that the maximum rate of production will be about two and one-half times the present rate, which places the date of the peak at about the year 2000. As in the case of coal, variations of this assumed maximum rate will advance or retard the date of the culmination.
The proved reserves shown in this figure are about 250 billion barrels. The total amount of oil discovered is the sum of the cumulative production and the proved reserves. Since this is approaching the peak of the curve, the figure suggests that, even if we are less than half through in our exploration for petroleum, the period of declining rates of discovery has almost arrived.
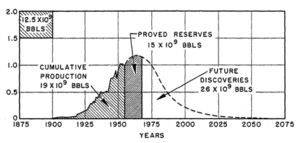
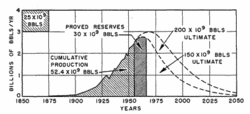
Applying this same technique to the production of crude oil in the United States, there is shown in Figure 21 a graph of the production up to the present, and two extrapolations into the future. The unit rectangle in this case represents 25 billion barrels so that if the ultimate potential production is 150 billion barrels, then the graph can encompass but six rectangles before returning to zero. Since the cumulative production is already a little more than 50 billion barrels, then only four more rectangles are available for future production. Also, since the production rate is still increasing, the ultimate production peak must be greater than the present rate of production and must occur sometime in the future. At the same time it is impossible to delay the peak for more than a few years and still allow time for the unavoidable prolonged period of decline due to the slowing rates of extraction from depleting reservoirs.
With due regard for these considerations, it is almost impossible to draw the production curve based upon an assumed ultimate production of 150 billion barrels in any manner differing significantly from that shown in Figure 21, according to which the curve must culminate at about 1965 and then must decline at a rate comparable to its earlier rate of growth.
If we suppose the figure of 150 billion barrels to be 50 billion barrels too low – an amount equal to eight East Texas oil fields – then the ultimate potential reserve would be 200 billion barrels. The second of the two extrapolations shown in Figure 21 is based upon this assumption; but it is interesting to note that even then the date of culmination is retarded only until about 1970.
One other contingency merits comment. By means of present production techniques, only about a third of the oil underground is being recovered. The reserve figures cited are for oil capable of being extracted by present techniques. However, secondary recovery techniques are gradually being improved so that ultimately a somewhat larger but still unknown fraction of the oil underground should be extracted than is now the case. Because of the slowness of the secondary recovery process, however, it appears unlikely that any improvement that can be made within the next 10 or 15 years can have any significant effect upon the date of culmination. A more probable effect of improved recovery will be to reduce the rate of decline after the culmination with respect to the rates shown in Figure 21.
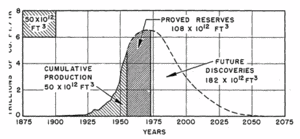
The corresponding extrapolation of the United States production curve for natural gas is shown in Figure 22. Here the ultimate potential reserves are taken to be the 850 trillion cubic feet recently estimated by Pratt. In this case the unit rectangle of the graph represents 100 trillion cubic feet so that the total area under the curve is limited to eight and one-half rectangles of which one and one-half represent the approximately 150 trillion cubic feet produced already.
The present production rate is about 10 trillion cubic feet per year and the curve is still rising steeply. An ultimate rate of about l4 trillion cubic feet per year is about the maximum that appears likely while allowing for the necessary period of prolonged decline. Assuming this value for the maximum, then the curve as drawn in Figure 22 is a reasonable extrapolation. The date of culmination in this case should be approximately 1970.
Shown also on the graph are two points indicating the rates of gas consumption for 1965 and 1975 postulated by Pratt[21]. The consumption rate for 1965 fits the curve very satisfactorily, but it is almost impossible to make the curve pass through Pratt's point for 1975 without requiring an ultimate gas production considerably in excess of the 850 trillion cubic feet assumed.
Curves for the ultimate production of crude oil and natural gas, respectively, for Texas are shown in Figures 23 and 24. These are based on the assumed ultimate potential reserves of 60 billion barrels and 340 trillion cubic feet for oil and gas, respectively. The behavior of the curves is very similar to that of the corresponding curves for the United States, with the oil production culminating about 1965 and the gas production about 1970. Improved methods of secondary recovery will probably make the rate of decline of the oil production curve less steep than is shown here, but are not likely seriously to postpone the date of the culmination.
The Outlook for the Fossil Fuels
From this inventory of the energy supplies represented by the fossil fuels, it appears that about three-quarters of the reserves of the fossil fuels of the world are represented by coal and the remaining one-quarter is about equally divided between liquid and gaseous hydrocarbons, and oil shales and tar sands. Production of the world's coal has already consumed about 3.7 percent of the minable reserves initially present, that of oil and gas about 7 percent, while the production from shale and tar sands has barely been started.
However, because of the versatility and usefulness of the liquid and gaseous hydrocarbons, and also because of their relative ease of extraction, the rate of exploitation of the latter has increased disproportionately to their magnitude as compared with coal.
If the world should continue to be dependent upon the fossil fuels as its principal source of industrial energy, then we could expect a culmination in the production of coal within about 200 years. On the basis of the present estimates of the ultimate reserves of petroleum and natural gas, it appears that the culmination of world production of these products should occur within about half a century, while the culmination for petroleum and natural gas in both the United States and the state of Texas should occur within the next few decades.
This does not necessarily imply that the United States or other parts of the industrial world will soon become destitute of liquid and gaseous fuels, because these can be produced from other fossil fuels which occur in much greater abundance. But it does pose as a national problem of primary importance, the necessity, both with regard to requirements for domestic purposes and those for national defense, of gradually having to compensate for an increasing disparity between the nation's demands for these fuels and its ability to produce them from naturally occurring accumulations of petroleum and natural gas.
Finally, there is the possibility of obtaining industrial energy from nuclear sources which we now propose to examine.
Energy from Nuclear Sources
Ever since the explosion of the first nuclear bomb over Hiroshima in 1945, there has been spectacular evidence that the tremendous store of energy contained within the nucleus of certain unstable atoms can at last be released. Gradually during the succeeding years, the veil of secrecy has been lifted until finally, as a result of the United Nations International Conference on the Peaceful Uses of Atomic Energy, held in Geneva during August 1955, virtually complete information on the possible industrial uses of the energy from the fissioning of the uranium has now been made public.
In addition, very active developments in the United States, England, the U.S.S.R., and other countries, of large power reactors are under way. Moreover, nuclear-powered submarines are already in successful operation. What, we wonder, is the magnitude of the potential industrial development of energy from these sources? How much uranium or thorium would be required to power an industrial civilization comparable to that now powered by the fossil fuels? And does this quantity exist in a form that is readily obtainable?
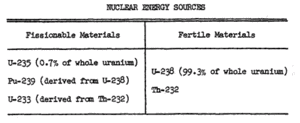
To answer these questions, let us first familiarize ourselves with the basic elements of the nuclear-power reactions. The fissionable elements, as indicated in Table 1, comprise two isotopes of uranium, U-235 and U-233, and one of plutonium, Pu-239. Of these, only one, U-235, occurs naturally and the other two are man-made, Pu-239 being derived by a radioactive transformation from U-238, and U-233 from thorium. The isotopes, U-235, U-233, and Pu-239, are known accordingly as fissionable or fuel materials; whereas U-238 and Th-232, while not themselves fissionable, can be converted into fissionable isotopes and so are known as fertile materials.
Naturally occurring uranium consists of the isotopes, U-238 and U-235, in the ratio of 140 to 1. Any given quantity of natural uranium contains 99.3 percent of U-238 and 0.7 percent of U-235. Natural thorium consists of the single isotope Th-232.
Spontaneous fissioning of U-235 occurs when a concentration of this isotope greater than some critical amount is brought together. If the reaction is uncontrolled, the result is the explosion of an atomic bomb; if properly controlled, the energy, in the form of heat, can be released at a determinate rate. Nuclear piles comprise assemblages of fissionable and auxiliary materials for maintaining controlled nuclear reactions.
The elementary nuclear-power reaction is that indicated in Figure 25. Here U-235 in a critical amount is undergoing fissioning. When a U-235 atom is struck by a neutron, it breaks into fragments known as fission products which consist of other atoms near the middle of the table of atomic numbers, and also releases neutrons which strike other U-235 atoms, thereby maintaining a chain reaction. Each fission releases, on the average, 200-million electron volts of heat which, like the heat of combustion of coal or oil, can be used to drive a steam power plant.
The objections to the sole use of U-235 are its scarcity and the large amounts of energy required to separate it from U-238. Hence, very great importance attaches to the possibility of converting the fertile materials, U-238 and Th-232, into fissionable materials by means of the breeder reaction. The breeder reaction for U-238 is shown schematically in Figure 26. In this case, the neutrons from the fissioning of U-235 are used to cause a radioactive transformation of U-238 to Pu-239 which is then fissionable. By a similar reaction Th-232 can be converted to U-233 which is also fissionable. It has been experimentally demonstrated that both of these reactions are possible and are capable of producing from the fertile materials more fuel material than is consumed. Thus, in principle, by means of properly developed breeder reactors, it is possible to consume whole uranium and thorium. In the subsequent discussion it will be assumed that complete breeding will have become the standard practice within the comparatively near future.
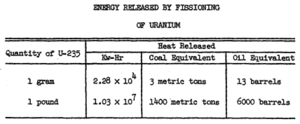
Now for the energy that is released by the fissioning of a given amount of uranium (or thorium). As indicated in Table 2, the fissioning of 1 gram of U-235 releases 2.28 x 10⁴ kw-hr of heat, which is equivalent to the heat of combustion of 3 tons of coal or of 13 barrels of oil. One pound of U-235 is equivalent to 1400 tons of coal or 6000 barrels of oil. Within narrow limits the same values are valid for U-238 and for thorium.
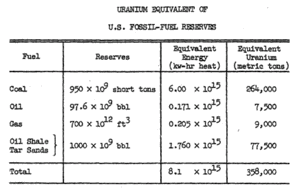
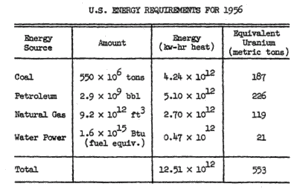
Using the foregoing data, the uranium equivalents of the fossil-fuel reserves of the United States are shown in Table 3. The energy of 358,000 metric tons (l metric ton is equal to 10 grams or 2205 pounds) of uranium is equal to that of all the fossil-fuel reserves of the United States. In Table 4 it is shown that the uranium equivalent of all the coal, oil, gas, and water power to be consumed in the United States during 1956 amounts to only 553 metric tons.
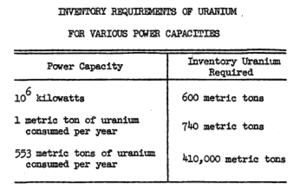
In addition to the uranium used as fuel, there is also an amount which must be permanently tied up in inventory in the reactors and processing plants as indicated in Table 5. This is estimated to be about 600 metric tons per million kilowatts of generating capacity. The present capacity of the United States is about 100 million kilowatts, which would require an inventory of about 60,000 tons of uranium. The inventory per ton of uranium consumed per year is about 740 tons, so if the fuels and water power of Table 4 were entirely replaced by nuclear power, the inventory requirements would be about 410,000 metric tons.
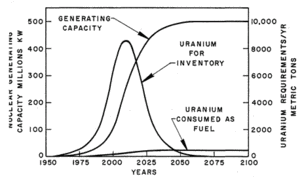
It is clear, therefore, that during the period in which the power capacity is expanding the requirements of uranium for inventory will greatly exceed those for fuel. When growth ceases, the annual increment to inventory will become zero. The relative requirements of uranium for inventory and for fuel of an expanding nuclear-power system are shown in Figure 27. The initial rate of expansion is taken to be 10 percent per year, with the power capacity becoming asymptotic to 500 million kilowatts.
Magnitude of Uranium Reserves
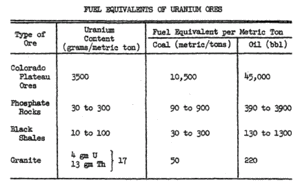
With this review of requirements we now ask: What is the magnitude of the supplies? The uranium contents and fuel equivalents of the principal sources of uranium in the United States are shown in Table 6. The ores which are currently being produced, the so-called high-grade ores, are those of the type found principally in the Colorado Plateau. These are said to average about 0.35 percent uranium, or 3500 grams per metric ton, which is equivalent to about 10,500 tons of coal or 45,000 barrels of oil per metric ton of ore.
The so-called "low-grade" ores are the phosphate rocks and the black shales which have uranium contents in the range of 0 to 300 and 10 to 100 grams per metric ton, respectively. Even so, such rocks are equivalent to 90 to 900 tons of coal or 390 to 3900 barrels of oil per metric ton for the phosphates, and to 30 to 300 tons of coal or 130 to 1300 barrels of oil per metric ton of rock, for the black shales. Even granite, as has been pointed out by Harrison Brown[22] and by Brown and Silver[23] , contains about 13 grams of thorium and 4 grams of uranium per ton, which is equivalent to about 50 tons of coal or 220 barrels of petroleum per metric ton of granite.
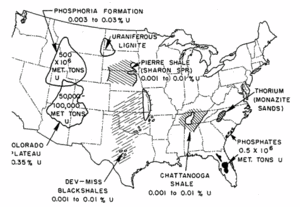
What quantity of uranium in rocks of these various types may there be? An indication of the order of magnitude may be obtained by a glance at the map in Figure 28. The Colorado plateau, which is the principal producer of the high-grade ores, has an estimated ultimate reserve of the order of 50,000 to 100,000 metric tons of uranium. The large supplies, however, are to be found in the so-called "low-grade" ores of the phosphate rocks and he black shales. The Phosphoria formation alone, it is estimated from a recent paper by McKelvey and Carswell[24], contains about 400 million tons of uranium. Another 0.5 million tons, at least, can be obtained from the phosphate rocks of Florida and the neighboring states.
The Chattanooga shale in Tennessee contains a stratum, the Gassaway member, about 5 meters thick whose average content of uranium is about 70 grams per metric ton[25]. With a density of 2.5 metric tons per cubic meter, this would amount to about 175 grams of uranium per cubic meter, or to 875 grams per square meter for the total thickness of the member. Then for an area of a square mile the uranium content of this member would be 2.3 X 10⁹ grams or 2300 metric tons. This does not sound impressive, and in fact, as compared with contents of the more familiar metallic ores, it is a trifling amount; nevertheless, the energy content of this member per square mile is equivalent to 30 billion barrels of oil, or to five East Texas oil fields. Uranium-rich black shales of Devonian-Mississippian age, which correlate with the Chattanooga, are widespread in the Mid-Continent area as well as in Tennessee and the neighboring states. In addition, the Sharon Springs member of the Pierre shale of Cretaceous age occurring in an extensive area of North and South Dakota east of the Black Hills is also rich in uranium. No attempt has been made to determine the amount of minable uranium which these shales must contain, but since their areal extent amounts to several hundred thousands of square miles, their uranium content would appear to be as much as several hundred million metric tons.
Well-defined thorium deposits, on the other hand, are comparatively rare, being found principally in placer deposits of monazite sands. One belt of these deposits extends north and south along the piedmont of North and South Carolina. In addition to the reserves in already established environments, there remains another category, as yet unevaluated, of potential reserves of both thorium and uranium in minor accessory minerals of alkalic igneous rocks and carbonatites (intrusive limestones) which are widespread in western United States.
From these evidences it appears that there exist within minable depths in the United States rocks with uranium contents equivalent to 1000 barrels or more of oil per metric ton, whose total energy content is probably several hundred times that of all the fossil fuels combined. The same appears to be true of many other parts of the world. Consequently, the world appears to be on the threshold of an era which in terms of energy consumption will be at least an order of magnitude greater than that made possible by the fossil fuels.
As remarked earlier, experimental nuclear-power reactors are already under construction in several parts of the United States, and in the United Kingdom, the U.S.S.R., and elsewhere, and nuclear-powered submarines are in successful operation. It will probably require the better part of another 10 or 15 years of research and development before stabilized designs of reactors and auxiliary chemical processing plants are achieved after which we may expect the usual exponential rate of growth of nuclear-power production.
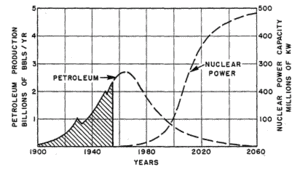
The decline of petroleum production and the concurrent rise in the production of power from nuclear energy for the United States is shown schematically in Figure 29. The rise of nuclear power is there shown at a rate of about 10 percent per year, but there are many indications that it may actually be twice that rate.
Time Perspective
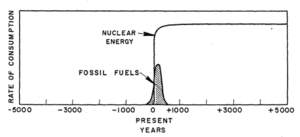
In order to see more clearly what these events may imply, it will be informative to consider them on a somewhat longer time scale than that which we customarily employ. Attention is accordingly invited to Figure 30 which covers the time span from 5000 years ago – the dawn of recorded history – to 5000 years in the future. On such a time scale the discovery, exploitation, and exhaustion of the fossil fuels will be seen to be but an ephemeral event in the span of recorded history. There is promise, however, provided mankind can solve its International problems and not destroy itself with nuclear weapons, and provided the world population (which is now expanding at such a rate as to double in less than a century) can somehow be brought under control, that we may at last have found an energy supply adequate for our needs for at least the next few centuries of the "foreseeable future."
Acknowledgments
The author is indebted to various of his associates for assistance and criticism in the preparation of this study, but particularly to K. W. Paul who spent the better part of two or three months in assembling and helping to digest the mass of difficultly obtainable information necessary for the preparation of this paper.
References
- American Gas Association (1956), Report of the Committee on Natural Gas Reserves, March 15, 1956.
- American Petroleum Institute (1956), Report of the American Petroleum Institute's Committee on Petroleum Reserves, March 15, 1956.
- Averitt, Paul, Berryhill, Louise R., and Taylor, Dorothy A. (1953), Coal Resources of the United States (A progress report, October 1, 1953), U.S. Geol. Surv. Circular 293.
- Ayres, Eugene (1948), Major Sources of Energy, Amer. Petrol. Institute Proc., v. 28, sect. 3, November 8-11, 1948, p. 109-142.
- Ayres, Eugene (1952), Synthetic Liquid Fuels--When and How?, Petroleum Processing, January 1952, p. 41-44.
- Ayres, Eugene (1953a), U.S. Oil Outlook: How Coal Fits In, Coal Age, August 1953, p. 70-73.
- Ayres, Eugene (1953b), Liquid Fuels in America, Petroleum Refiner, v. 32, no. 8, p. 90 and following.
- Ayres, Eugene (1955), Energy Resources for the Future, Mines Magazine, July 1955, P. 39-41.
- Ayres, Eugene, and Scarlott, Charles A. (1952), Energy Sources--The Wealth of the World, McGraw-Hill, New York, 344 p.
- Brown, Harrison S. (1954), The Challenge of Man's Future, Viking Press, New York, 290 p.
- Brown, Harrison S., and Silver, L. T. (1955), The Possibilities of Securing Long Range Supplies of Uranium, Thorium, and Other Substances from Igneous Rocks; United Nations International Conference on the Peaceful Uses of Atomic Energy, Geneva (preprint).
- Hubbert, M. King (1950a), Energy from Fossil Fuels, Centennial, Amer. Assoc. Advancement Science, p. 171-177.
- Hubbert, M. King (1950b), Discussion: Estimates of Undiscovered Petroleum Reserves by A. I. Levorsen, Proc. United Nations Scientific Conference on the Conservation and Utilization of Resources, v. 1, p. 103-104.
- Jenkins, Olaf P. (1955), Letter of date November 21, 1955, to K. W. Paul.
- Kerr, Paul F. (1955), The Natural Occurrence of Uranium and Thorium, United Nations International Conference on the Peaceful Uses of Atomic Energy, Geneva (preprint).
- McKelvey, V. E., and Carswell, L. D. (1955), Uranium in the Phosphoria Formation, United Nations International Conference on the Peaceful Uses of Atomic Energy, Geneva (preprint).
- Oil and Gas Journal (1956), Shale Reserves Up, v. 54, no. 41, p. 83.
- Pogue, Joseph E., and Hill, Kenneth E. (1956), Future Growth and Financial Requirements of the World Petroleum Industry, presented at the Annual Meeting of the American Institute of Mining, Metallurgical, and Petroleum Engineers, Petroleum Branch, February 21, 1956.
- Pratt, Wallace E. (1956), The Impact of the Peaceful Uses of Atomic Energy on the Petroleum Industry, Report of the Panel on the Impact of the Peaceful Uses of Atomic Energy, v. 2 (Background Material), p. 89-105.
- Putnam, Palmer C. (1953), Energy in the Future, Van Nostrand, New York, 556 p.
- Rubel, A. C. (1955), Shale Oil--As a Future Energy Resource, Mines Magazine, October 1955, p. 72-76.
- United Nations (1956), World Energy Requirements in 1975 and 2000, Proc. International Conference on the Peaceful Uses of Atomic Energy, Geneva, 1955, v. 1, Table 13, p. 27-29.
- U.S. Geological Survey (1951), Fuel Reserves of the United States. Statement prepared by the U.S. Geol. Surv. at request of Committee on Interior and Insular Affairs, U.S. Senate, 82nd Congress, 1st Session, p. 38-39.
- U.S. Geological Survey (1953), Potential Oil and Gas Reserves of the Continental Shelf Off the Coasts of Louisiana, Texas, and California. Statement prepared by the Fuels Branch, Geol. Div., U.S. Geol. Surv., at request of Committee on Interior and Insular Affairs, U.S. Senate, February 16, 1953.
- Vincent, Ray R., and Witherspoon, Paul A. (1955), Illinois Area Gets Second Wind, Independent Petrol. Assoc. Amer. Monthly, October 1955 (Illinois State Geol. Surv. Reprint Series 1955-T).
- Weeks, L. G. (1948), Highlights on 1947 Developments in Foreign Petroleum Fields, Bull. Amer. Assoc. Petrol. Geol., v. 32, pt. 1, p. 1094.
- Weeks, L. G. (1950a), Discussion: Estimates of Undiscovered Petroleum Reserves by A. I. Levorsen, Proc. United Nations Scientific Conference on the Conservation and Utilization of Resources, v. 1, p. 107-110.
- Weeks, L. G. (1950b), Concerning Estimates of Potential Oil Reserves, Bull. Amer. Assoc. Petrol. Geol., v. 34, pt. 2, p. 1947-1953.
- Weeks, L. G. (1952), Factors of Sedimentary Basin Development That Control Oil Occurrence, Bull. Amer. Assoc. Petrol. Geol., v. 36, pt. 2, p. 2071-2124.
Citation
Hubbert,M.K.(1956): Nuclear energy and the fossil fuels. Shell Development Company, Publication No. 95, 1-40. original available online


![Figure 22. Ultimate United States production of natural gas based on initial reserves of 850 trillion cubic feet (Pratt 1956<a href=%27.html#endnote_7' class='external autonumber' title='#endnote_7' rel='nofollow'>[1]</a>).](../../eoearth_images/8/8f/250px-Hubbert-nuclear_e_%26_the_ff-fig22.gif)
