Climate Solutions: Chapter 3
| Topics: |
Contents
What Causes the Earth to Warm or Cool?
A large fraction of fossil fuel CO2 emissions stays in the air a long time, one-quarter remaining airborne for several centuries.... Thus moderate delay of fossil fuel use will not appreciably reduce long-term human-made climate change. Preservation of a climate resembling that to which humanity is accustomed ... requires that most remaining fossil fuel carbon is never emitted to the atmosphere. [8] —James Hansen and colleagues, 2008
Anyone who has traveled to the “Mile High City,” as Denver, Colorado, is known, will attest: The air is thinner in the Rocky Mountains at 1,600 meters (1 mile) above sea level than in New York City, which is at sea level. The atmosphere is thickest at sea level and decreases exponentially in density and pressure with elevation. Starting at sea level, we have a layer about 18 kilometers (km) thick, called the troposphere. Almost all human activity, from mountain climbing to flying in jet airplanes, takes place in the troposhere. The air in the troposphere is constantly circulating. (Tropos means “turning” in Greek.)
The Earth bakes the air from the bottom by radiating some heat from the Sun back into the sky. Air in the troposphere rises, expands, and cools. If the air contains moisture, the moisture may condense to form clouds of rain droplets or ice crystals. Clouds form in the troposphere. Water within the bottom 4 km of the troposphere will not freeze. Water arriving in the top 4 km can form ice. And in between, either ice or rain can form. Ninety percent of all Earth’s air lies within about 16 km (10 miles) of the Earth’s surface. At the top of the troposphere, the air is quite cold, about -55°C (-67°F).
Above the troposphere lies the stratosphere for another 30 km or so. Within the stratosphere sits a layer of large oxygen molecules, ozone (O3), that block harmful solar radiation from reaching us. Without this “good ozone,” the oceans would evaporate and life would cease. The air in the stratosphere is relatively stable. It does not mix with the air below it. Interestingly, air at the top of the stratosphere is warmer—about 0°C (32°F)—than the air in the troposphere just below it. The ozone layer’s absorbing solar radiation causes this warmth.
The less dense mesosphere lies above the stratosphere and is considerably colder, about -85°C (-121°F) at its top. At about 80 km above sea level, the thermosphere begins above the mesosphere. The thermosphere is the least dense zone; it contains very little gas and gradually warms to about -50°C (-58°F) because the Sun is effectively baking it from above. At about 90 km above sea level, the atmosphere gradually thins until there are no air molecules left and interplanetary space begins. Both the mesosphere and thermosphere are so far removed from the Earth and have so little gas that they are scarcely affected by the processes that cause warming or cooling in the lower troposphere or stratosphere. The lower two zones of the atmosphere—the troposphere and the stratosphere—are more sensitive to temperature drivers such as greenhouse gases, and these are where we will focus our attention.
So what causes the Earth to warm or cool? The short answer is that many different processes contribute to warming or cooling of the Earth’s lower atmosphere and surface. For millions of years, three naturally occurring factors caused variation in the Earth’s average surface temperature: the Sun, volcanic eruptions, and the Earth’s orbit.
Our Sun is a star containing a thermonuclear furnace that ejects heat as radiation. Over time, very small but detectable variations occur in the output of heat from the Sun. Sunspots and their related solar flares and are examples. Slightly more or less heat arriving from the Sun will cause a rise or fall in the heat that reaches the Earth’s surface. Sunspots appear to come and go in 10-year cycles and cannot alone explain the rise in temperature we have observed since the industrial age began.
Volcanoes modify the atmosphere whenever they erupt. Explosive volcanic activity injects aerosol particles of soot high into the stratosphere where they form clouds that might cool the Earth. Such particle-laden clouds may prevent heat from the Sun from reaching the Earth’s surface and thereby cause a temporary cooling, However, volcanic eruptions also emit water vapor, carbon dioxide, and other gases that can have long-term warming effects. In the past century, four major volcanic eruptions have each caused a short-term drop in the Earth’s average temperature. Volcanic activity has actually been fairly uncommon in the past 250 years, so it is not an adequate explanation for the sudden rise of carbon dioxide in the atmosphere.
Finally, the geometry of Earth’s orbit is not a uniform ellipse. Much as a spinning top may change the tilt of its axis while its axis gradually traces a conical path, the Earth’s orbit does wobble a bit over a very long period of time. This orbital eccentricity and slight variations in axis angles occur over very long time scales of ten of thousands of years. The Earth’s orbital fluctuation or axis tilt has not changed measurably in the past thousand years or more. So planetary geometry cannot explain the sudden rise in carbon dioxide since 1850, when the industrial era began.
Other smaller natural factors that affect how much carbon dioxide concentrates in the atmosphere over the long term include the number of marine organisms (which we will discuss in Chapter 4) available to extract carbon dioxide to make shells, and the abundance of mountain ranges that remove carbon dioxide through chemical weathering. But the number of mountain ranges with exposed rock has not changed appreciably in the past 150 years. So the latter does not contribute to the explanation of the rise in atmospheric carbon dioxide. We will learn in Chapter 4 why marine organisms do play a vital role, but not in a way that contributed to the already observed increase in carbon dioxide.
If all of the above processes could cause the Earth to warm up, what could cause the Earth to cool down? We saw earlier how volcanic clouds have a temporary cooling effect until they are dispersed. Three naturally occurring processes could cool the Earth over the long term and have done so in the past.
The first is the albedo effect that happens with good snow cover. When snow or ice forms and remains on the surface, it reflects most of the solar radiation that hits it, bouncing radiated heat back into the atmosphere and out into space. It is the albedo effect that gives snow skiers a deep tan because they get sun from above and reflected from below. Soil or water would have absorbed the heat and warmed up much more than the pale ice or snow cover. More snow or ice cover leads to more albedo and more cooling and therefore more snow and ice. The albedo effect is a positive feedback loop because its effect intensifies the process that causes it.
The second process is the ocean’s action as a heat conveyor. The ocean is a giant heat engine. As climates cools down, the evaporation of seawater slows down. Warmer air temperature causes surface ocean water to evaporate, causing a higher salt-to-water ratio and subsequently surface waters that are denser but warmer than the layers below. The deep-sea sinking of water requires dense, salty water. This sinking drives currents such as the Gulf Stream, which moves warm surface water to the North Atlantic and cold deep water from the North Atlantic toward the equator. Any change in the sinking of the cold northern water will alter the Gulf Stream and, with it, northern Europe’s climate, currently warmed by it. Any cooling in northern Europe might alter the albedo effect of snow cover. So these are all interconnected.
Third, the biological processes that change CO2 concentrations could also contribute to cooling the Earth. While biological processes may not initiate climate changes, they may amplify changes underway by altering the composition of the atmosphere in small but significant ways. For example, if more plankton grew in the oceans, their photosynthesis and shell-making process would take up and store more carbon, removing it from the atmosphere during the life cycle of the plankton. Biological processes, such as forest growth, are carbon stores but not necessarily long-term carbon sinks. Biological processes alone cannot explain the sudden rise in modern atmospheric carbon dioxide. Lowering the carbon dioxide in the atmosphere would reduce the greenhouse effect and lower temperatures. We will discuss plankton more in Chapter 4.
Online figures
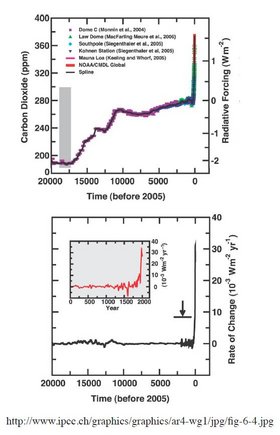 Figure 3.1 20,000 years of atmospheric carbonThe top graph depicts the level of atmospheric carbon dioxide for the past 20,000 years. Since the last Ice Age ended about 11,000 years ago, carbon dioxide levels have remained relatively stable—between 250 and 280 ppm—until quite recently. They have increased dramatically since about AD 1950. These data are based on ice-core analysis. The right-hand scale indicates the radiative forcing, that is, the added warming effect, for a greenhouse gas with zero set at the preindustrial level (280 ppm of carbon dioxide in 1750) before the current rise began. The second, lower graph depicts the cumulative rate of warming (“radiative forcing”) when researchers combine all the climate inputs. The inset depicts each compound’s rise since AD 1750, corresponding to the span of the entire industrial age. The left-hand scale indicates concentration levels in parts per million by volume (ppmv). Source: [14] |
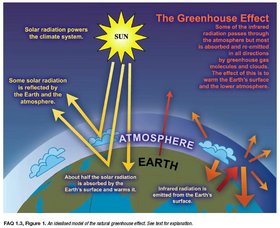 Figure 3.3 The greenhouse effectAbout one-third of the Sun’s energy that reaches the top of Earth’s atmosphere is reflected directly back to space. The remaining two-thirds is absorbed by the land, ocean, and atmosphere. To balance the absorbed incoming energy, the Earth must, on average, radiate the same amount of energy back to space. But energy emitted from the Earth’s surface radiates at much longer wavelengths, primarily in the infrared part of the spectrum. These wavelength are largely absorbed in the atmosphere by greenhouse gases, including water vapor and water droplets in clouds, and reradiated back to Earth. This is called the greenhouse effect. Source: FAQ 1.3 |
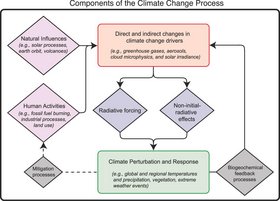 Figure 3.4 Components of climate change Climate is a system. The Earth plays a role and so, increasingly, do humans. Human activities and natural processes have direct and indirect affects on climate change drivers. In general, these changes result in specific radiative forcing changes, either positive (additive) or negative (subtractive), and cause some secondary effects, such as changes in evaporation. Radiative forcing and the subsequent radiative effects lead to climate perturbations and responses. Source: [6] | |
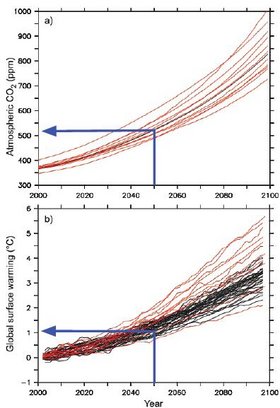 Figure 3.11 Projected carbon dioxide emissions and global temperature disruption: 2000–2100The dark vertical line in the center of each graph represents the year AD 2050, a time at which many readers of this book will still be alive and active. The models used here for projecting atmospheric carbon dioxide assume that we will make some attempts to reduce human causes of climate disruption but that the large differences present now across the world will remain as barriers to pervasive, uniform action. As shown, carbon dioxide reaches almost double its preindustrial level, and temperature follows along to rise at least another degree Celsius, if not more. Source: Adapted from [19] |

Bibliography
- Bernstein L, Bosch P, Canziani O, Chen Z, Christ R, Davidson O, Hare W, Huq S, Karoly D, Kattsov V, et al. (2007) Summary for Policymakers of the Synthesis Report (in Climate Change 2007: Fourth Assessment Report of the Intergovernmental Panel on Climate Change, 22 pp, eds Allali A, Bojariu R, Diaz S, Elgizouli I, Griggs D, Hawkins D, Hohmeyer O, Pateh Jallow BP, Kajfez?-Bogataj L, Leary N, Lee H, Wratt D) ar4_syr_spm.pdf: http://www.ipcc.ch
- Bernstein L, Bosch P, Canziani O, Chen Z, Christ R, Davidson O, Hare W, Huq S, Karoly D, Kattsov V, et al. (2007) Synthesis Report (in Climate Change 2007: Fourth Assessment Report of the Intergovernmental Panel on Climate Change, 74 pp, eds Allali A, Bojariu R, Diaz S, Elgizouli I, Griggs D, Hawkins D, Hohmeyer O, Pateh Jallow BP, Kajfez?-Bogataj L, Leary N, Lee H, Wratt D) ar4_syr.pdf: http://www.ipcc.ch
- Canadell JG, Le Quéré C, Raupach MR, Field CB, Buitenhuis ET, Ciais P, Conway TJ, Gillett NP, Houghton RA, Marland G (2007) Contributions to accelerating atmospheric CO2 growth from economic activity, carbon intensity, and efficiency of natural sinks. Proceedings of the National Academy of Sciences 104(47):18866. http://www.pnas.org/cgi/content/abstract/104/47/18866
- Denman KL, Brasseur G, Chidthaisong A, Ciais P, Cox PM, Dickinson RE, Hauglustaine D, Heinze C, Holland E, Jacob D (2007) Couplings Between Changes in the Climate System and Biogeochemistry (in Climate Change 2007: The Physical Science Basis. Contribution of Working Group I to the Fourth Assessment Report of the Intergovernmental Panel on Climate Change, 541?– 584, eds Solomon S, Qin D, Manning M, Chen Z, Marquis M, Averyt KB, Tignor MH, Miller L) http://www.ipcc.ch
- El T (2008) Population Curve. English Wikipedia. http://commons.wikimedia.org/article/File:Population_ curve.svg
- Forster P, Ramaswamy V, Artaxo P, Berntsen T, Betts R, Fahey DW, Haywood J, Lean J, Lowe DC, Myhre G, et al. (2007) Changes in Atmospheric Constituents and in Radiative Forcing (in Climate Change 2007: The Physical Science Basis. Contribution of Working Group I to the Fourth Assessment Report of the Intergovernmental Panel on Climate Change, eds Solomon S, Qin D, Manning M, Chen Z, Marquis M, Averyt KB, Tignor MH, Miller L) http://www.ipcc.ch
- Global Carbon Project (2008) Carbon Budget and Trends 2007 (read September 26, 2008). www.globalcarbonproject.org
- Hansen J, Sato M, Kharecha P, Beerling D, Berner R, Masson-Delmotte V, Pagani M, Raymo M, Royer DL, Zachos JC (2008) Target atmospheric CO2: where should humanity aim? physics.ao-ph http://arxiv.org/abs/0804.1126
- Hansen J, Sato M, Ruedy R, Lo K, Lea DW, Medina-Elizade M (2006) Global temperature change. Proceedings of the National Academy of Sciences 103(39):14288. http://www.pnas.org/cgi/content/ab-stract/103/39/14288
- Hegerl GC, Zwiers FW, Braconnot P, Gillett NP, Luo Y, Marengo Orsini JA, Nicholls N, Penner JE, Stott PA (2007) Understanding and Attributing Climate Change (in Climate Change 2007: The Physical Science Basis. Contribution of Working Group I to the Fourth Assessment Report of the Intergovernmental Panel on Climate Change, eds Solomon S, Qin D, Manning M, Chen Z, Marquis M, Averyt KB, Tignor M, and Miller HL) http://www.ipcc.ch
- Holdren J (2008) Meeting the Climate Change Challenge: Eighth Annual John H. Chafee Memorial Lecture on Science and the Environment. Climate Change Science and Solutions: Eighth National Conference on Science, Policy, and the Environment. http://ncseonline.org/climatesolutions
- IPCC (2000) Emissions Scenarios (SRES) (in -Special Report: A Special Report of Working Group III of the Intergovernmental Panel on Climate Change, 1?– 22, eds Nakicenovic N, Swart R) -sres-en.pdf: http://www.ipcc.ch
- IPCC (2007) FAQ (WG1) (in Climate Change 2007: The Physical Science Basis. Contribution of Working Group I to the Fourth Assessment Report of the Intergovernmental Panel on Climate Change, eds Solomon S, Qin D, Manning M, Chen Z, Marquis M, Averyt KB, Tignor M, Miller HL) AR4-WG1_FAQ-Brochure_HiRes.pdf: http://www.ipcc.ch
- Jansen E, Overpeck J, Briffa KR, Duplessy J-C, Joos F, Masson-Delmotte V, Olago D, Otto-Bliesner B, Peltier WR, Rahmstorf S, et al. (2007) Palaeoclimate (in Climate Change 2007: The Physical Science Basis. Contribution of Working Group I to the Fourth Assessment Report of the Intergovernmental Panel on Climate Change, eds Solomon S, Qin D, Manning M, Chen Z, Marquis M, Averyt KB, Tignor MH, Miller L) ar4-wg1-chapter6.pdf: http://www.ipcc.ch
- Loulergue L, Schilt A, Spahni R, Masson-Delmotte V, Blunier T, Lemieux B, Barnola JM, Raynaud D, Stocker TF, Chappellaz J (2008) Orbital and millennial-scale features of atmospheric CH4 over the past 800,000 years. Nature 453(7193):383?– 386. http://www.nature.com/nature/journal/v453/n7193/abs/nature06950.html
- Lüthi D, Le Floch M, Bereiter B, Blunier T, Barnola JM, Siegenthaler U, Raynaud D, Jouzel J, Fischer H, Kawamura K (2008) High-resolution carbon dioxide concentration record 650,000?– 800,000 years before present. Nature 453(7193):379?– 382. http://www.nature.com/nature/journal/v453/n7193/abs/nature06949.html
- Mann ME, Zhang Z, Hughes MK, Bradley RS, Miller SK, Rutherford S, Ni F (2008) Proxy-based reconstructions of hemispheric and global surface temperature variations over the past two millennia. Proceedings of the National Academy of Sciences 105(36):13252?– 13257. http://www.pnas.org/content/105/36/13252.full
- McKibben B (2008) 350.org (read August 15, 2008). http://www.350.org
- Meehl GA, Stocker TF, Collins WD, Friedlingstein P, Gaye AT, Gregory JM, Kitoh A, Knutti R, Murphy JM, Noda A, et al. (2007) Global Climate Projections (in Climate Change 2007: The Physical Science Basis. Contribution of Working Group I to the Fourth Assessment Report of the Intergovernmental Panel on Climate Change, eds Solomon S, Qin D, Manning M, Chen Z, Marquis M, Averyt KB, Tignor MH, Miller L) ar4-wg1-chapter10.pdf: http://www.ipcc.ch
- NCSE (2008) Climate Change Science and Solutions. National Conference on Science, Policy, and the Environment. http://www.ncseonline.org/climatesolutions/
- Parmesan C, Yohe G (2003) A globally coherent fingerprint of climate change impacts across natural systems. Nature 421:doi:10.1038/nature01286. http://www.nature.com/nature/journal/v421/n6918/abs/nature01286.html
- Raupach MR, Marland G, Ciais P, Le Quéré C, Canadell JG, Klepper G, Field CB (2007) Global and regional drivers of accelerating CO2 emissions. Proceedings of the National Academy of Sciences 104(24):10288. http://www.pnas.org/cgi/content/long/104/24/10288
- Segar D (2007) Introduction to Ocean Sciences. (W. W. Norton & Company, New York). http://www.wwnorton.com/college
- Stern N (2006) The Stern Review Report on the Economics of Climate Change. HM Treasury, London. http://www.hm-treasury.gov.uk/independent_ reviews/stern_review_economics_climate_ change/ stern_review_report.cfm
- Tans P (2008) Trends in Atmospheric Carbon Dioxide NOAA/ESRL. Global Monitoring Division. US Department of Commerce, National Oceanic and Atmospheric Administration Earth System Research Laboratory (ESRL), Boulder, CO. http://www.esrl.noaa.gov/gmd/ccgg/trends/
- Thuiller W, Lavorel S, Araujo MB, Sykes MT, Prentice IC (2005) Climate change threats to plant diversity in Europe. Proceedings of the National Academy of Sciences 102(23):8245?– 8250. http://www.pnas.org/cgi/content/abstract/102/23/8245
- UN Oceans (2008) United Nations Atlas of the Oceans (read August 24, 2008). http://www.oceansatlas.org/cds_static/en/human_settlements_coast__en_1877_all_1.html
- USGS (2005) Caribbean Tsunami and Earthquake Hazards Studies. The Caribbean Program. Woods Hole Science Center (read October 24, 2008). http://www.woodshole.er.usgs.gov/project-pages/carib-bean/atlantic+trench_Large.html
- Wolfson R (2008) Energy, Environment, and Climate, chap 5 (W. W. Norton & Company, New York). http://www.wwnorton.com/college/physics
Online resources
- Carbon
- Carbon dioxide
- Carbon cycle
- Coal
- Atmosphere layers
- Ocean acidification
- Carbon capture and storage
Action item
Action 15: Can Stabilizing Population Help Stabilize Climate?
Instructor resources
(password required)
|
|