Effects of climate change on landscape and regional processes and feedbacks to the climate system in the Arctic

This is Section 7.5 of the Arctic Climate Impact Assessment
Lead Author: Terry V. Callaghan; Contributing Authors: Lars Olof Björn, F. Stuart Chapin III,Yuri Chernov,Torben R. Christensen, Brian Huntley, Rolf Ims, Margareta Johansson, Dyanna Jolly Riedlinger, Sven Jonasson, Nadya Matveyeva,Walter Oechel, Nicolai Panikov, Gus Shaver; Consulting Authors: Josef Elster, Heikki Henttonen, Ingibjörg S. Jónsdóttir, Kari Laine, Sibyll Schaphoff, Stephen Sitch, Erja Taulavuori, Kari Taulavuori, Christoph Zöckler
Biological and physical processes and phenomena in the arctic system operate at various temporal and spatial scales to affect large-scale feedbacks and interactions with the earth system. Understanding these processes at multiple scales is critical because the effects of the complex interactions between physical, biological, and human dimensions on system performance cannot be projected by simply applying a different scale to existing results. Therefore, a multidisciplinary and quantitative approach is necessary to understand and project the response of the arctic system to variability in temperature and moisture. The large scale, inter-related processes described in this section include:
- ecosystem processes extrapolated to the landscape or regional scale (e.g., trace-gas exchange, water and energy exchange, and disturbance);
- changes in ecosystem distribution and abundance in the landscape;
- changes in vegetation zonation (e.g., treeline movement);
- interactions between terrestrial and freshwater (Freshwater biomes) ecosystems; and
- regional feedbacks.
Paleoclimate studies and studies of the contemporary Arctic together have identified four potential feedback mechanisms between the impacts of climate change on the Arctic and the global climate system; these are:
- albedo (reflectivity);
- greenhouse gas emissions and/or uptake through biological responses to warming;
- greenhouse gas emissions from methane hydrates released from thawing permafrost; and
- freshwater fluxes that affect thermohaline circulation.
In the past, three of the potential feedbacks have been generally positive and only one negative.
Some of the feedbacks such as energy and water exchange operate at local to regional scales whereas others, particularly trace-gas fluxes, have the potential to operate at regional to global scales. This section assesses the impacts of changes in climate (but not UV radiation levels, for which data are lacking) on ecosystem processes at the larger scale. The section explores the implications of these changes for feedbacks from [[terrestrial] ecosystems] to the climate system, but does not calculate changes in Forcing (Section 4.7.1 (Effects of climate change on landscape and regional processes and feedbacks to the climate system in the Arctic)). Nor does it consider freshwater discharge (Sections 6.8.3 and 8.4.2 (Effects of climate change on landscape and regional processes and feedbacks to the climate system in the Arctic)) or methane hydrate feedbacks (Section 6.6.2 (Effects of climate change on landscape and regional processes and feedbacks to the climate system in the Arctic)).
Contents
- 1 Impacts of recent and current climate on carbon flux (7.5.1)
- 2 Current circumpolar water and energy balances (7.5.2)
- 3 Large-scale processes affecting future balances of carbon, water, and energy (7.5.3)
- 4 Projections of future balances of carbon, water, and energy exchange (7.5.4)
- 5 Summary (7.5.5)
- 6 References
- 7 Citation
Impacts of recent and current climate on carbon flux (7.5.1)
There are two complementary approaches to solve the carbon-flux inventory problem: "bottom:up" and "top-down". The first is based on the long-term monitoring of gas emissions within networks of field stations or sites that cover the main types of habitats. At its simplest, total circumpolar emissions are estimated from the number and area of the types of northern ecosystems differentiated in terms of easily mapped features (e.g., vegetation, soil properties, relief, and geomorphology) and the characteristic annual exchange of CO2 and CH4 from each ecosystem. The data on CO2 and CH4 fluxes come from three main groups of available techniques that operate at different spatial scales: closed and open-top chambers (0.1 to 1 square-meter [m2]), micrometeorological towers based on eddy covariance and gradient methods (10 to 10,000 m2), and aircraft sensing (up to tens and hundreds of square kilometers). All three groups of techniques have their advantages and disadvantages. However, continuous measurements with towers seem to be the most appropriate for providing reliable information on the temporal variation of gas emissions at the ecosystem and landscape spatial levels.
Recent changes in carbon dioxide fluxes (7.5.1.1)
Recent variations in arctic climate have had profound effects on some ecosystem- and regional-level C fluxes and, in general, these fluxes reflect the recent spatial variability in climate change. The assessment in this section is restricted to C in the active layer of [[soil]s] and in plants, and does not consider C in permafrost and methane hydrates (Section 6.6 (Effects of climate change on landscape and regional processes and feedbacks to the climate system in the Arctic)).
The North Slope of Alaska has experienced a rise in temperature[1] (Fig. 7.26), an increase in growing-season length, and a decrease in available soil moisture[2] over the last three to four decades. This has resulted in North Slope ecosystems changing from a sink for C throughout the Holocene[3] to a source of C to the atmosphere beginning in the mid-1970s to early 1990s[4] (Fig. 7.26). However, as there has been a change in climate, with progressive warming, drying, and lengthening of the growing season, there has been physiological, community, and ecosystem level adjustment that has reduced the rate of C loss from North Slope ecosystems (Fig. 7.26). In addition, wetter areas of the North Slope are not showing the same increase in CO2 emissions[5]. The interannual variations in the C balance measured on the coastal plain of Alaska are very large, ranging from a net summer CO2 uptake of about 25 g C/m2/yr to a summer loss of over 225 g C/m2/yr. If the latter fluxes held worldwide for wet coastal and moist tussock tundra, this would result in a net loss of up to 0.3 Pg C/yr from these two ecosystem types alone.
In northeast Greenland, the recent climatic history is different than that of Alaska: there has been no significant trend toward higher temperatures[6] and integrating over all vegetation types shows that the Zackenberg valley is a small net sink (2.3 g C/m2/yr) with a large uncertainty range (±16.2 g C/m2/yr). This integrated study of the valley shows that Landsat-derived C flux estimates are in good agreement with ground-based eddy correlation flux measurements covering all the dominant vegetation types in the valley. The Landsat method estimated a midday uptake rate in August 1997 of 0.77 g C/m2/d for the valley as a whole whereas the ground-based measurements showed the uptake rate to be 0.88 g C/m2/d[7]. The measured annual balance in the valley varies from significant uptake in the intensively studied fen areas (on the order of 18.8±6.7 g C/m2/yr) to net C losses in the dry heath[8].
Like Alaska, northern Scandinavian areas have experienced warming in recent years. The ecosystem C balance for a subarctic Swedish peatland was found to be a sink of between 15 and 25 g C/m2/yr[9]. Similarly, in Finland, a net annual uptake of about 20 g C/m2/yr was reported for a subarctic fen at Kaamanen[10]. Six years of continuous measurements at this fen show marked interannual variation in the CO2 balances (sinks ranging from 4 to 52 g C/m2/yr), which mainly reflect the variations in spring [[temperature]s] and the timing of the snow melt[11]. Studies of fluxes in high-arctic barren tundra on Svalbard show a very limited source of around 1 g C/m2/yr[12]. Overall, the synthesis of regional C flux information from measurements at several sites in northern Europe and Greenland (the Land Arctic Physical Processes project[13]) indicates that arctic landscapes are remarkably similar in their C fluxes during midsummer, but the length of the growing season and the shoulder season fluxes are the key determinants for the net annual fluxes. This causes substantial interannual variability at the individual sites, and general uncertainty about whether the circumpolar Arctic is presently a source or a sink for C.
Recent work in East European tundra indicates a substantial current source of C in the northeastern European tundra areas[14]. When combined with the areas of the northern Alaska tundra mentioned above that are also a source of C, source areas (East European tundra, Svalbard, and Alaska) may exceed sink areas (northeast Greenland, northern Scandinavia). However, data are available for only a small part of the Arctic.
There may be a correlation between C balance and recent climatic history in areas that have seen a significant warming and drying: these areas experienced at least a temporary release of CO2, while areas that have not experienced the same extent of warming and drying, or have possibly experienced a warming and wetting, remain atmospheric CO2 sinks and could possibly even become large sinks. A complete synthesis of the available information from the circumpolar Arctic is underway but not yet available.
New models and approaches make estimation of current and future global C balances possible. The modeling approach has been used to explore potential changes in arctic [[terrestrial] ecosystems] from C sink to source status[15]. The Terrestrial Ecosystem Model (Marine Biological Laboratory, Woods Hole) has been used to estimate current and future C fluxes, while the model Hybrid v4.1 (Institute of Terrestrial Ecology, United Kingdom[16]) has been used to simulate vegetation and carbon-pool changes at high latitudes for the period from 1860 to 2100[17]. For the present day, the models simulate a mix of C sinks and sources that reflect variations in current and past climate. McGuire et al.[18] estimate that average circumpolar C fluxes presently constitute a small sink of 17 g C/m2/yr with a standard deviation of 40 g C/m2/yr that crosses the boundary between sink and source status. This uncertainty range is comparable to the Lund-Potsdam-Jena Dynamic Global Vegetation Model (LPJ) outputs[19] (Section 7.5.4.1 (Effects of climate change on landscape and regional processes and feedbacks to the climate system in the Arctic)) and the calculation of current sink status corresponds to the projections by White et al.[20].
Although it can be concluded that source areas currently exceed sink areas, there is great uncertainty about the current CO2 balance of the Arctic, owing to geographically sparse measurements and inadequate representation of ecosystem dynamics in current models.
Current circumpolar methane fluxes (7.5.1.2)
Probably the most intensive studies and the longest observations of CH4 fluxes were performed in North America, mainly within the central Alaskan and North Slope sites at Barrow, Atqasuk, Toolik Lake, and Prudhoe Bay[21]. In northern Eurasia including Russia, extensive measurements of gas emissions were initiated in the late 1980s, either as short-term measurements across geographic transects or as long time series of flux measurements at individual sites. The first approach is illustrated by chamber measurements of CH4 (and CO2) fluxes across the Russian Arctic[22]. The second approach is found at a number of field stations where gas fluxes are measured mainly during the summer season[23].
The general characteristics of spatial and temporal flux variations can be formulated as follows. First, there are evident temperature-related variations: even within northern wetlands, the highest net fluxes occur in warmer [[soil]s], with maximum values attained in the boreal zone. This trend is especially evident with respect to CH4 emissions, which increase along the latitudinal sequence Barrow–Toolik Lake–Fairbanks or Taymir–Surgut–Tomsk. Seasonal variations also follow a temperature curve, although winter, autumn, and spring emissions are often measurable (Sections 7.3.2.3 and 7.4.2.1 (Effects of climate change on landscape and regional processes and feedbacks to the climate system in the Arctic)). Seasonal measurements of CH4 emissions from five different wetland sites along a transect from northeast Greenland across Iceland and Scandinavia to Siberia also showed a clear positive relationship to the mean seasonal temperatures of the sites[24]. Second, there are always enhanced emissions from wetland patches covered by vascular plants (e.g., Eriophorum, Carex, and Menyanthes) as compared with pure Sphagnum lawn (Section 7.4.2.2 (Effects of climate change on landscape and regional processes and feedbacks to the climate system in the Arctic)). Third, variations in the water table affect CH4 (and CO2) emissions in opposite ways, with CH4 fluxes stimulated and CO2 suppressed by an increase in the water table. However, the range of fluxes varies so widely that uncertainty in regional and global estimates remains too large and is very dependent on the site-specific features of a particular study. For example, extensive measurements using various techniques over the Hudson Bay Lowland[25] led to the conclusion that northern wetlands are modest sources of atmospheric CH4 (average July emissions as low as 10 to 20 mg CH4/m2/d). On the other hand, Alaskan wet meadow and shrub/tussock tundra have average summer emissions as high as 100 to 700 mg CH4/m2/d[26]. The uncertainty in regional and global estimates that follows from these differences in measured fluxes is very frustrating and calls for alternative ways to solve the problem of scaling up fluxes.
One such alternative is the inverse modeling approach. In this top-down approach, information about the temporal and spatial variation of CH4 and CO2 emissions from soils is deduced from observations of gas mixing ratios in the atmosphere (obtained from a network of National Oceanic and Atmospheric Administration/Climate Monitoring and Diagnostics Laboratory field stations scattered over the globe, mainly in oceanic regions far from industrial effects). These data are fitted to a three-dimensional atmospheric transport model, which is combined with a tropospheric background chemistry module and accounts for all essential sources and sinks of gases. The model is validated against an "internal standard" such as methyl chloroform. Presently available results from inverse modeling[27] do not deviate significantly from data obtained by the bottom:up approach. The contribution of high-latitude regions (>60° N) to the global CH4 source was less than 13% (70 Tg CH4/yr), and northern wetlands were responsible for emissions of less than 30 Tg CH4/yr. This estimate appears to contradict the latitudinal gradient of atmospheric CH4 concentration that has a well-expressed maximum in the north, however, the higher concentration of CH4 in the high-latitude atmosphere can be explained by low concentrations of the hydroxyl radical and, hence, lower rates of photochemical reactions that break down atmospheric CH4.
Relative contributions of methane and carbon dioxide to the carbon budget (7.5.1.3)
The formation of CO2 and CH4 is a result of aerobic and anaerobic decomposition, respectively. The ratio of respired CO2 to CH4 is hence an indication of how reduced the soil environment is. An increasingly reduced soil environment (i.e., higher CH4/CO2 ratio) also leads to slower overall decomposition rates, as anaerobic decomposition is less efficient in absolute C terms (i.e., less C is released compared to aerobic decomposition). This generally leads to a buildup of stored organic C in wet tundra soils, as net primary production is not normally limited by wet soil conditions to the same extent as respiration.
The net CH4/CO2 ratio of the total respiration is also a function of the amount of CH4 that is oxidized in the aerobic soil layers above a given anaerobic zone of production and even the atmospheric CH4 uptake that takes place in some dry tundra soil environments. The CH4/CO2 ratio or the percentage contribution of CH4 to total respired C varies from <1% in dry [[ecosystem]s] to >20% in extreme cases in wet tundra ecosystems. Typical annual average contributions of CH4 to the total C flux range from 2 to 10% for wet tundra and northern wetlands (e.g., [30]).
In the context of climate change, it is very important to note that the relative contribution of CH4 to total Radiative forcing is much greater on a per molecule basis than CO2[31]. The "global warming potential" (GWP) indicates how many times stronger a given greenhouse gas is compared to CO2 on a per molecule basis, and this is dependent on the time horizon of interest. For example, over a 100-year time horizon, the GWP of CH4 is 23 and over a 20-year horizon it is 63[32].
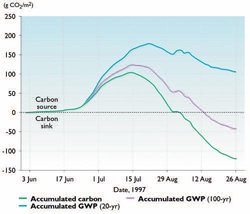
From the perspective of climate change, it is, hence, not very informative to look only at the C balance of an ecosystem if there are fluxes of CH4 or other [[greenhouse gas]es] such as N2O[33]. Calculations have shown that ecosystems such as the huge western Siberian lowlands, despite being strong sinks for C, are sources of radiative forcing due to considerable CH4 emissions[34]. Data are, however, scarce when it comes to full annual budgets of both CO2 and CH4 fluxes from tundra regions. Figure 7.31 shows calculations based on accumulated continuous eddy correlation measurements of CO2 and CH4 fluxes in the Zackenberg Valley, northeast Greenland during the summer of 1997[35]. The figure illustrates that the effect of a net C accumulation ("minus" in the budget) during the season is completely offset if the CO2 equivalent of CH4 is calculated (using a 20-year time horizon) and added to the budget. Using the 100-year time horizon, the ecosystem is still a small sink of CO2 equivalent at the end of the growing season. However, if the autumn and winter fluxes (which are entirely sources) were included, the annual total would probably add up to a source as well.
In general, there are significant CH4 emissions from the most productive tundra areas due to the predominantly wet soil conditions. It is very likely that, at the landscape, regional, and global scales, the tundra represents a source of Radiative forcing due to emissions of CH4, which is the most important greenhouse gas driving the ecosystem influence on atmospheric radiative forcing.
Current circumpolar water and energy balances (7.5.2)
Arctic ecosystems exhibit the greatest seasonal changes in energy exchange of any [[terrestrial] ecosystem] because of the large changes in albedo from late winter, when snow reflects most incoming radiation (albedo about 0.7), to summer when the ecosystem absorbs most incoming radiation (albedo about 0.15). This change in albedo combined with greater incoming solar radiation in summer than in winter causes much greater energy absorption in summer than in winter. About 90% of the energy absorbed during summer is transferred to the atmosphere, with the rest transferred to the soil in summer and released to the atmosphere in winter[36]. Also, snow within shrub canopies is deeper and less dense, which reduces heat transfer through the snowpack and increases winter soil temperatures by 2 °C relative to adjacent shrub-free tundra. Consequently, arctic ecosystems have a strong warming effect on the atmosphere during the snow-free season, and any increase in the duration of snow-free conditions results in a strong positive feedback to regional climate warming[37].
Climate influences the partitioning of energy between sensible and latent heat fluxes. Cold moist air from coastal oceans, for example, minimizes latent heat flux (evapotranspiration), as does extremely warm dry air, which can induce stomatal closure[38]; evapotranspiration is therefore greatest at intermediate [[temperature]s]. Conversely, sensible heat flux is a larger proportion of the energy transfer to the atmosphere when air is cold and moist or when drought limits stomatal conductance under dry conditions. Heat that is conducted into the ground during summer is released to the atmosphere in winter, with any seasonal imbalance causing changes in permafrost temperature leading to a probability of thermokarst[39].
There are large regional differences among arctic [[ecosystem]s] in energy exchange and partitioning. Albedo during the period of snow cover is extremely high in tundra and declines with increasing development of a plant canopy above the snow, from tundra to shrub tundra to forest tundra to deciduous forest to evergreen forest[40]. These differences in albedo are an important feedback to climate during spring, when the ground is snow-covered, and incoming radiation is high. As a result of differences in albedo and sensible heat flux, forests at the arctic treeline transfer about 5 W/m2 more energy to the atmosphere than does adjacent tundra[41]. This difference in energy transfer to the atmosphere depending on vegetation type is an order of magnitude less than the heating contrast that had been hypothesized to be required for treeline to regulate the position of the Arctic Front[42]. Thus, the location of the Arctic Front is more likely to govern the position of the treeline than the other way around[43].
Large-scale processes affecting future balances of carbon, water, and energy (7.5.3)
This section assesses the effects of climate change on permafrost degradation and vegetation redistribution as a prerequisite for assessing changes in feedbacks from future [[terrestrial] ecosystems] to the climate system.
Permafrost degradation (7.5.3.1)
Soil C storage is greatest where the drainage is slight and the limited precipitation is held near the surface by permafrost and modest topography. This results in ponds, wetlands, and moist tundra with a saturated seasonal active layer that limits microbial activity. Increases in active-layer depth can cause subsidence at the surface, a lowering of the soil water table[44], and, potentially, thermokarst erosion[45]. This can drain surrounding areas, often increasing the decomposition rate of soil organic matter, which accelerates the loss of below-ground C stores[46] and results in a change in plant communities and their abilities to sequester atmospheric CO2. Initially, increased soil decomposition rates can increase mineralization rates[47] and result in increased NPP (Section 7.4.2.1 (Effects of climate change on landscape and regional processes and feedbacks to the climate system in the Arctic)). However, continued thawing of permafrost and increased drainage of surface water in areas with low precipitation are likely to lead to drier soils, a decrease in NPP, and possibly even desertification (Section 7.5.3.2 (Effects of climate change on landscape and regional processes and feedbacks to the climate system in the Arctic)).
Full permafrost disintegration in subarctic discontinuous permafrost regions may in some cases show a different response. Monitoring of changes in permafrost distribution in subarctic Sweden as part of the Circumpolar Active Layer Monitoring Program[48] shows that permafrost loss causes mires to shift from ombrotrophic moss- and shrub-dominated systems to wetland systems dominated by minerotrophic vascular plants[49]. This, in turn, leads to a significant lowering of soil redox potentials, an increase in anaerobic decomposition, and increased CH4 emissions. Wet minerotrophic soils and vegetation are in general associated with the highest CH4 emissions in subarctic and arctic tundra environments. Discontinuous permafrost regions are considered some of the most vulnerable to climate warming; given projected temperature increases over the next 100 years, effects such as the changes in vegetation composition discussed here are likely.
Permafrost degradation and disintegration are therefore very likely to have major effects on ecosystem C balances and CH4 emissions. The rate of permafrost thawing, the amount of ground surface subsidence, and the response of the hydrological regime to permafrost degradation will depend on numerous site characteristics. Changes in the hydrological regime will also alter the soil thermal regime. In areas with significant topographic variations, flowing water can carry heat into drainage channels, causing increased soil temperatures and increased active-layer thickness[50]. In regions with minor topographic variations, subtle differences in elevation can create cooler, saturated wetlands (as mentioned in the previous paragraph) or markedly drier, warmer uplands[51].
Changes in circumpolar vegetation zones (7.5.3.2)
While climate-driven changes in the structure and distribution of plant communities affect trace gas fluxes and water and energy balances at the landscape scale (Section 7.4.2 (Effects of climate change on landscape and regional processes and feedbacks to the climate system in the Arctic)), changes in the location and extent of broad vegetation zones is a longer-term integrative process that is likely to lead to regional and even global impacts on feedbacks to the climate system[52]. Such vegetation zone changes are also likely to affect permafrost dynamics ([[Section 6.6 (Effects of climate change on landscape and regional processes and feedbacks to the climate system in the Arctic)]2]), biodiversity (Section 7.3.1 (Effects of climate change on landscape and regional processes and feedbacks to the climate system in the Arctic)), and ecosystem services[53]. Past climate-driven changes in vegetation zones such as forest and tundra[54] (Section 7.2 (Effects of climate change on landscape and regional processes and feedbacks to the climate system in the Arctic)) lead to the expectation that future climate warming is very likely to result in vegetation and ecosystem change, but projecting future changes is complex and relies on modeling.
Dynamics of the treeline and changes in the areas of tundra and taiga vegetation
The latitudinal treeline or tundra–taiga boundary is an exceptionally important transition zone in terms of global vegetation, climate feedbacks, biodiversity, and human settlement.
The treeline stretches for more than 13,000 km around the Northern Hemisphere and through areas that are experiencing different types of environmental change, for example, cooling, warming, or marginal temperature change and increasing or decreasing land use. Climate is only one of a suite of environmental factors that are now changing, and a critically important challenge is to determine how human impacts in the ecotone will modify its projected response to climate change[55].
The lack of standardized terminology and the wide variation in methodology applied to locate, characterize, and observe changes in the boundary have resulted in a poor understanding of even the current location and characteristics of the boundary. Particular areas of uncertainty include the Lena Delta of Siberia[56] and forests in Iceland that have been subjected to major environmental and land-use changes since colonization by people about 1,100 years BP (Section 14.3.4.4 (Effects of climate change on landscape and regional processes and feedbacks to the climate system in the Arctic)). One of the major problems with current studies of the latitudinal "treeline" is the concept of "line" inappropriately applied to the transition from forest, through an area dominated by forest in which patches of tundra occur, to tundra in which patches of forest occur, and then eventually to tundra without trees. Often there are east–west gradients related to the presence of a river valley, bogs, mires, uplands, etc. that also confound the concept of a linear boundary.
Dynamics of the boundary
Current and projected changes in the location of the tundra–taiga boundary should be seen in the context of the longer-term past cooling trend during which the treeline has been at its lowest latitudinal and altitudinal locations for several thousands of years (Section 7.2.4 (Effects of climate change on landscape and regional processes and feedbacks to the climate system in the Arctic)). Examples of recent treeline advance include a 40 m increase in the elevation of the subarctic treeline in northern Sweden during the 20th century[57], an increase in shrub growth in Alaska[58], and an increase in shrubbiness and larch advance in the northeast Russian European Arctic[59]. In contrast, other studies show a surprising southward displacement of the tundra–taiga boundary[60]. Part of this is a counter-intuitive response to warming in which an increasingly oceanic climate (e.g., in the western Russian Arctic: see Section 8.4.1 (Effects of climate change on landscape and regional processes and feedbacks to the climate system in the Arctic), Fig. 8.9) together with permafrost thawing have led to paludification (waterlogging and peat formation) and the death of treeline trees[61]. Part is associated with human activities, including mining, farming, and forestry, that have led to ecosystem degradation in the forest tundra zone and the movement of its northern boundary southward in some locations[62]. In the Archangelsk region and the Komi Republic, the southern border of the forest tundra zone now lies 40 to 100 km further south than when previously surveyed. One report claims that anthropogenic tundra now covers about 470,000 to 500,000 km2 of the forest tundra stretching from Archangelsk to Chukotka[63], although it is likely that this estimate includes deforestation in some of the northern boreal forest zone.
Although records of recent changes in the location of the latitudinal treeline are surprisingly rare, there is good evidence of increased growth in current northern forests. Comparisons of the greenness index (NDVI) from satellite images show that May to September values for the Northern Hemisphere between 55° and 75° N increased by around 5 to 50% from 1982 to 1990[64] (Fig. 7.25), with greater increases in North America than in Eurasia. The increased greenness was associated with an increase in growing-season length of between 3.8 and 4.3 days for the circumpolar area, mainly due to an earlier start of the growing season.
Projecting future changes in the tundra–taiga boundary
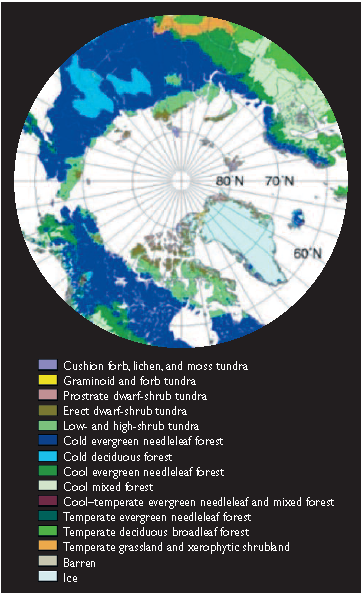 Fig. 7.32. Potential vegetation distribution in 2090–2100 as projected by the BIOME4 model driven with output from the HadCM2GSa1 model forced with the IS92a emissions scenario[65].
 In order to model changes in the location of the tundra–taiga ecotone and estimate future areas of tundra to the north and taiga to the south, it is necessary to understand the causes of the treeline. Opinions on the mechanisms controlling the location of the treeline vary greatly. Some researchers see the limit of tree growth as a universal mechanism related to a specific process such as sink (C and nutrient) limitation[66] or C limitation[67]. Others see a range of possible mechanisms that operate in different places and at different times[68]. These mechanisms are in turn affected by environmental factors such as incident radiation, temperature, wind, moisture, and soil nutrients, which affect tree reproduction, seedling establishment, and the growth and physiology of mature trees. Extreme conditions such as ice-crystal abrasion and soil movement also directly damage tree tissues (e.g., conifer needles) and displace individuals. Diseases, pests (Invasive species), fires, and human activities all exert some control on the treeline at certain places and at certain times (Chapter 14 (Effects of climate change on landscape and regional processes and feedbacks to the climate system in the Arctic)).
Models of vegetation redistribution resulting from global change utilize more general driving variables, related to, for example, biogeography and biogeochemistry. Most current global vegetation models and regional models project that a major part of the tundra (between 11 and 50% according to location) will be displaced by a northward shift of the boreal forest over the period in which atmospheric CO2 concentrations double[69] (Table 7.13; Section 7.6 (Effects of climate change on landscape and regional processes and feedbacks to the climate system in the Arctic), Table 7.14; Fig. 7.32). The treeline is projected to move north in all sectors of the Arctic, even in Greenland and Chukotka where only fragments of forest exist today[70]. However, to date there have been fewer observations of this type of forest response than projections suggest, even though temperature has already risen dramatically in some areas.
The observations of the latitudinal treeline that show a recent southern displacement suggest that there is very unlikely to be a general northward displacement of the latitudinal treeline throughout the circumpolar region as the models project. In addition to potential paludification[71] and local human activities displacing treelines southward, permafrost thawing, surface water drainage, and soil drying in areas of low precipitation are likely to lead to the formation of vegetation similar to the tundra–steppe[72] (Section 7.2.2 (Effects of climate change on landscape and regional processes and feedbacks to the climate system in the Arctic)).
Increased disturbances such as pest outbreaks, thermokarst, and fire are also likely to locally affect the direction of treeline response. In addition, some tree species show reduced responsiveness to increases in temperature with increasing continentality of their location and decreased precipitation[73] (Section 14.7 (Effects of climate change on landscape and regional processes and feedbacks to the climate system in the Arctic)). This suggests that increased temperatures with no comparable increase in precipitation are likely to lead to reduced tree growth and/or changes in species and lack of treeline advance. Even in areas projected to undergo warming with none of the moderating factors listed above, it is uncertain if the rate of tree migration can keep up with the rate of projected temperature increases. Past tree migration rates were generally of the order of 0.2 to 0.4 km/yr but sometimes reached 4.0 km/yr[74] ([[Section 7.2 (Effects of climate change on landscape and regional processes and feedbacks to the climate system in the Arctic)]2]). These rates suggest that in those areas of the Arctic that have warmed substantially in the last 30 years, treeline should already have advanced by about 6 to 120 km. Such shifts have not been recorded in the Arctic, although Parmesan and Yohe[75] claim to have identified a poleward displacement of species ranges of 6.1 km per decade globally.
Overall, it is likely that treeline will show many different responses throughout the circumpolar north according to different degrees of temperature change associated with various changes in precipitation, permafrost dynamics, land use, and tree species migration potential.
Projecting future changes in the areas of tundra and polar desert
The LPJ model was used to project vegetation changes in the northern areas of the Arctic[76] (Table 7.13; [[Section 7.6 (Effects of climate change on landscape and regional processes and feedbacks to the climate system in the Arctic)]2], Table 7.14), using climate scenarios generated by four of the five ACIA-designated models (CGCM2, GFDL-R30_c, HadCM3, and ECHAM4/OPYC3; Section 4.2.7 (Effects of climate change on landscape and regional processes and feedbacks to the climate system in the Arctic)) forced with the B2 emissions scenario (Section 4.4.1 (Effects of climate change on landscape and regional processes and feedbacks to the climate system in the Arctic)). Although the results and interpretations are preliminary, LPJ simulations are consistent in projecting a decrease in the area of polar desert that will be replaced by northward-moving tundra (Table 7.13). The area of the Arctic covered by polar desert is projected to decrease by 17.6% (range 14 to 23%) between 1960 and 2080. In this model, the two vegetation zones were defined by plant functional types: woody species for the tundra, and absence of woody species for the polar desert. In the BIOME4 (coupled biogeography and biogeochemistry model) simulations by Kaplan et al.[77], driven by output from the HadCM2GSa1 model forced with the IS92a emissions scenario, five tundra biomes were constructed (Table 7.8). The most significant changes appear to be a significant northward advance of the cold evergreen needle-leaf forest that is particularly dramatic in the region of arctic Russia between Chukotka and the Taymir Peninsula. This greatly reduces the area of tundra. However, low- and high-shrub tundra in the Canadian Archipelago remains as a wide zone and displaces prostrate dwarf-shrub tundra (Figs. 7.2 and 7.32). Earlier modeling by White et al.[78] projected that the area of tundra would be halved by forest expansion by 2100.
Projections of future balances of carbon, water, and energy exchange (7.5.4)
Because the Arctic contains huge stores of C in the soil and permafrost ([[Section 7.4.2 (Effects of climate change on landscape and regional processes and feedbacks to the climate system in the Arctic)]2]), and because the Arctic has the capacity for unlimited additional storage or significant loss[79], it can be a major positive or negative feedback to increasing trace-gas concentrations in the atmosphere and to global climate change. Loss of CO2 from arctic [[ecosystem]s] could potentially lead to enormous positive feedbacks to global climate change by release to the atmosphere of the estimated 250 Pg C stored in the large arctic soil pool, although this is unlikely to happen[80]. In addition, an increasing snow-free period[81], increasing shrub cover[82], and the northward migration of the treeline[83] are very likely to decrease arctic albedo and further increase regional warming[84]. This section assesses likely changes in the C balance and water and energy exchange in relation to vegetation change.
| Table 7.13. Averages and ranges of the drivers and responses of a leading dynamic global vegetation model (LPJ) driven with the outputs for the terrestrial Arctic (>60° N) from four different climate models (CGCM2, GFDL-R20_c, HadCM3, ECHAM4/OPYC3) forced with the B2 emissions scenario[85]. | ||
| Average | Range | |
| Temperature change (°C) | ||
| 2000–2100 | 5.0 | 4.7 to 5.7 |
| Precipitation change (mm/yr) | ||
| 2000–2100 | 42.9 | 9.0 to 78.0 |
| NPP (Pg C/yr) | ||
| 1960s | 2.83 | 2.77 to 2.88 |
| 2080s | 4.87 | 4.57 to 5.19 |
| Change (%) | 72.4 | 60.9 to 87.4 |
| Change in C storage 1960–2080 (Pg C) | ||
| Vegetation | 5.73 | 3.59 to 7.65 |
| Soil | 6.98 | 1.6 to 15.6 |
| Litter | 5.6 | 3.4 to 9.6 |
| Total | 18.3 | 12.2 to 31.3 |
| Percent areal vegetation changea | ||
| Increase in taiga areab | ||
| 1960–2020 | 4.4 | 3.1 to 5.3 |
| 1960–2050 | 7.4 | 6.4 to 8.4 |
| 1960–2080 | 11.3 | 9.8 to 14.4 |
| Change in polar desert areac | ||
| 1960–2020 |
-7.5 | -13.3 to -4.2 |
| 1960–2050 | -13.2 | -18.5 to -10.6 |
| 1960–2080 | -17.6 | -23.0 to -14.2 |
|
a Only a proxy as the change is derived from functional characteristics of the vegetation produced by the model rather than projections of specific vegetation composition per se. For a proper vegetation distribution estimate, it would be more appropriate to use a coupled biogeography and biogeochemistry model such as BIOME4; b based on the percentage increase in woody plants simulated by LPJ; c based on the percentage reduction in bare ground simulated by LPJ. | ||
| Table 7.14. Summary baseline information for the four ACIA regions. | ||||
| Region 1 | Region 2 | Region 3 | Region 4 | |
| Arctic Europe, East Greenland, European Russian North, and North Atlantic | Central Siberia | Chukotka, Bering Sea, Alaska, and western Arctic Canada | Northeast Canada, Labrador Sea, Davis Strait, and West Greenland | |
| Projected environmental changes | ||||
| Mean Annual Temperaturea (°C) | ||||
| Baseline 1981–2000 | -17 to 16 | -8 to 4 | -8 to 12 | -20 to 12 |
| 2020 (change from baseline) | -1 to 3 | 0 to 2.5 | -0.5 to 3.0 | -1 to 4 |
| 2050 (change from baseline) | -0.5 to 4.0 | 0.5 to 4.0 | 0 to 4 | 0 to 7 |
| 2080 (change from baseline) | 1 to 7 | 1 to 6 | 0.5 to 6 | 0 to 8 |
| Precipitationa (mm/month) | ||||
| Baseline 1981–2000 | 10 to 150 | 10 to 70 | 10 to 150 | 5 to 130 |
| 2020 (change from baseline) | -10 to 12 | -8 to 5 | -10 to 8 | -10 to 20 |
| 2050 (change from baseline) | -20 to 20 | -2 to 5 | -4 to 12 | -8 to 35 |
| 2080 (change from baseline) | -20 to 25 | 0 to 10 | -3 to 12 | -15 to 35 |
| Increase in UV-B radiation levels from 1979–1992 baseline (%)b | ||||
| Mean for 2010–2020 | 0 to 10 | 0 to 8 | 0 to 2 | 0 to 14 |
| Mean for 2040–2050 | 0 to 2 | 0 to 2 | 0 to 2 | 0 to 2 |
| Change in albedoc (due to vegetation change) | ||||
| 2050 | -0.10 to 0.05 | -0.050 to 0.025 | -0.10 to 0.025 | -0.050 to 0.025 |
| 2080 | -0.10 to 0.01 | -0.050 to 0.025 | -0.10 to 0.025 | -0.10 to 0.025 |
| Ecosystem processes projected by the LPJ modeld | ||||
| NPP (Pg C/yr) | See Table 7.13 for the arctic total | |||
| 1960s | 1.2 | 4.0 | 4.6 | 1.5 |
| 2080s | 1.8 | 6.5 | 7.5 | 3.8 |
| Change (%) 46.3 62.3 63.8 144.4 | ||||
| NEP: Change in C storage 1960–2080 (Pg C) | See Table 7.13 for the arctic total | |||
| Vegetation | 0.2 | 1.7 | 2.5 | 1.3 |
| Soil | -0.1 | 0.5 | 1.9 | 4.7 |
| Litter | -0.02 | 0.5 | 1.8 | 3.4 |
| Total | 0.04 (-0.7 to 0.8) | 2.8 (-0.9 to 7.1) | 6.2 (4.1 to 9.5) | 9.3 (6.5 to 14.0) |
| Landscape processes projected by the LPJ model[87] | ||||
| Increase in taiga area (%)e f | ||||
| 1960–2020 | 1.1 (-1.1 to 2.3) | 6.1 (4.2 to 8.6) | 4.2 (1.9 to 5.7) | 3.7 (2.9 to 4.4) |
| 1960–2050 | 3.2 (1.6 to 4.3) | 9.4 (7.5 to 10.2) | 8.2 (6.5 to 9.7) | 5.0 (3.8 to 6.2) |
| 1960–2080 | 5.0 (3.7 to 5.9) | 13.7 (11.1 to 17.3) | 11.9 (9.8 to 15.1) | 9.5 (6.8 to 12.5) |
| Change in polar desert area (%)e g | ||||
| 1960–2020 | -2.3 (-3.1 to -1.1) | -6.9 (-11.0 to -3.9) | -5.3 (-10.8 to -2.4) | -12.7 (-23.0 to -7.2) |
| 1960–2050 | -3.5 (-4.8 to -2.7) | -9.9 (-13.2 to -7.7) | -11.0 (-15.7 to -8.9) | -23.6 (-33.5 to -16.3) |
| 1960–2080 | -4.2 (-5.9 to -3.2) | -11.4 (-14.6 to -10) | -13.2 (-16.6 to -11.4) | -35.6 (-47.8 to -25.9) |
| Biodiversity | ||||
| Rare endemic vascular plant speciesh | 2 | 18 | 69 | 8 |
| Threatened vascular plant species (occurring at a single unprotected location in each region)h | 1 | 4 | 11 | 0 |
| Threatened animal speciesi | 2 | 4 | 6 | 1 |
|
a from the ACIA-designated model simulations; b from Taalas et al.[86]; c Betts R.[87] using IS92a emissions scenario; d averages and ranges (in parentheses) of the responses of the LPJ model[88] driven with outputs from four different climate models (CGCM2, GFDL-R30_c, HadCM3, ECHAM4/OPYC3) forced with the B2 emissions scenario (Section 4.4 (Effects of climate change on landscape and regional processes and feedbacks to the climate system in the Arctic)); e only a proxy as the change is derived from functional characteristics of the vegetation simulated by the model rather than projections of specific vegetation composition per se. For a proper vegetation distribution estimate, it would be more appropriate to use a coupled biogeography and biogeochemistry model such as BIOME4; f based on the percentage increase in woody plants simulated by LPJ; g based on the percentage reduction in bare ground simulated by LPJ; h from Talbot et al.[89]; i IUCN[90]. | ||||
Carbon balance (7.5.4.1)
The vegetation distribution model BIOME3, forced with present-day and doubled atmospheric CO2 concentrations, projected decreases in the extent of the Scandinavian, central northern Siberian, and Eurasian tundra areas ranging from 10 to 35% as a result of displacement by taiga[91]. This vegetation change was projected to significantly increase CO2 uptake and reduce CH4 emissions, with net C sequestration in the biosphere of a magnitude (4.6 Pg C) that would alter the Radiative forcing of the earth. Using another model, McGuire et al.[92] estimated that circumpolar mean C uptake would increase from a current 12 g C/m2/yr to 22 g C/m2/yr by 2100, because NPP increased more than respiration throughout the period[93]. It should be noted, however, that throughout the 200-year model run, the standard deviation of C uptake always crosses the zero line[94]. White et al.[95] obtained comparable results from their Hybrid v4.1 model, projecting that high-latitude [[terrestrial] ecosystems] would remain a sink for C.
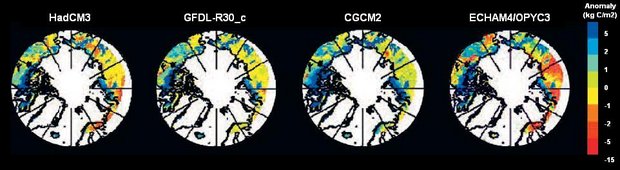 Fig. 7.33. Carbon storage anomalies between 1960 and 2080 projected by the LPJ model using climate scenarios generated by four of the five ACIA-designated models[96].
 The LPJ model[97] (Box 7.1) was used to produce estimates of future changes in arctic C storage and fluxes for this assessment, based on four different general circulation model (GCM) outputs. The results and analyses are preliminary but indicate a consistent net additional sink in the Arctic in 2080 compared to 2000, with increases in accumulated arctic C storage varying between 12 and 31 Pg C depending on the climate scenario used. Figure 7.33 shows the C storage anomalies projected by the LPJ model, and Table 7.14 ([[Section 7.6 (Effects of climate change on landscape and regional processes and feedbacks to the climate system in the Arctic)]3]) shows further details of the regional subdivision of these projections.
|
Box 7.1.The Lund-Potsdam-Jena model The Lund-Potsdam-Jena (LPJ) dynamic global vegetation model combines process-based, large-scale representations of terrestrial vegetation dynamics and land–atmosphere carbon and water exchanges in a modular framework. Features include feedback through canopy conductance between photosynthesis and transpiration, and interactive coupling between these rapid processes and other ecosystem processes including resource competition, tissue turnover, population dynamics, soil organic matter and litter dynamics, and fire disturbance. Ten plant functional types (PFTs) are differentiated by physiological, morphological, phenological, bioclimatic, and fireresponse attributes. Resource competition and differential responses to fire between PFTs influence their relative fractional cover from year to year. Photosynthesis, evapotranspiration, and soil water dynamics are modeled on a daily time step, while vegetation structure and PFT population densities are updated annually. Within the biosphere model[98], the raw GCM (CGCM2, GFDL-R30_c, HadCM3, and ECHAM4/OPYC3 forced with the B2 emissions scenario) climatologies for 1900 to 2100 were not used directly.The climate simulated by present-day GCMs is not spatially detailed enough to directly drive a biosphere model, therefore the anomaly approach was used. The data were downscaled from the GCM-specific grid onto a grid with 0.5º resolution. Climate anomalies projected by the GCMs were normalized to the 1961–1990 observed average monthly Climatic Research Unit climatology (CRU CL 1.0[99]). |
There are great uncertainties associated with these estimates due to the complex differential response of NPP and respiration to the climate drivers (temperature, precipitation), which themselves are highly spatially variable and interact. However, the general response of the model seems to be as follows. In areas with little or no vegetation (e.g., polar desert), increasing CO2 concentrations and temperature (e.g., increasing growing-season length) lead to increased vegetation growth and northward plant migration, resulting in an increase in C stocks. This seems to be a general pattern acting through increased productivity throughout the Arctic, all else being equal (see NPP projections in Table 7.13). However, increased temperature leads also to increased heterotrophic (soil microorganism) respiration. Therefore, areas that at present contain large soil C stocks are likely to release larger amounts of C from the soil as respiration responds to a warmer climate. Whether these areas become net sources or sinks depends on the balance between temperature-enhanced respiration and increased productivity (hence increased biomass and litterfall) due to increased CO2 concentrations and longer growing seasons. When the LPJ model was forced with the climate projections of the ECHAM4/OPYC3 model, which projects very large temperature increases, projected respiration was enhanced more than productivity. Over the entire Arctic, C storage is projected by the LPJ model to balance, due to northward migration of plants, etc., with C loss in areas that experience large temperature changes and have large stocks of soil C. On the whole, all runs of the LPJ model project that C storage will increase. The scenario with the highest projected temperature change (ECHAM4/OPYC3) results in the lowest overall C gain, while the scenario with the lowest projected temperature change (CGCM2) results in the highest C gain.
The current estimated circumpolar emissions of CH4 are in the range of 20 to 60 Tg CH4/yr. These have a significant potential for feedback to a changing climate. Large-scale CH4 flux models are currently not as advanced as general carbon-cycle models and few allow for projections of future change based on climate change scenarios. Early attempts to assess and model tundra CH4 emissions driven by climate change all indicated a potential increase in emissions[100] but more recent improved mechanistic models[101] have not yet been followed up by full coupling to GCM projections to assess future circumpolar CH4 emissions. Another critical factor is the geographic extent of wetlands and how these may change in the future. There is, however, little doubt that with climate scenarios of warming and wetting of arctic [[soil]s], CH4 emissions are very likely to increase, while with warming and drying, emissions are likely to change little or decline relative to current emissions.
Lakes and streams cover large portions of many arctic landscapes and, due to low evapotranspiration, runoff is a major component of arctic water budgets. These surface [[freshwater]s] contain large amounts of dissolved organic and inorganic C that is carried into them by soil and groundwater flow from the terrestrial portions of their watersheds[102]. The inorganic C is largely CO2 produced by soil and root respiration. Organic C concentrations in soil water, groundwater, and surface waters are typically several times greater than inorganic C concentrations and are a major source of respiratory CO2 produced in lakes and streams, thus adding to their already high dissolved inorganic C content.
Because the dissolved CO2 in surface waters is typically supersaturated with respect to the atmosphere, and the surface area and flow of freshwater is large, surface waters of arctic landscapes emit large amounts of CO2 to the atmosphere[103] (Section 8.4.4.4 (Effects of climate change on landscape and regional processes and feedbacks to the climate system in the Arctic)). Estimates of CO2 emissions from surface waters are as large as 20 to 25% of gross landscape CO2 fixation and thus may be a major component of landscape C balance that is not accounted for in studies that include terrestrial CO2 fluxes only. Similar large CO2 losses also occur in freshwaters of boreal, temperate, and tropical landscapes[104], but they are generally not considered in landscape-level C budgets. At present, little is known about controls over these CO2 losses or how they might change with changes in climate or water balance. Attempts to measure the losses directly have yielded inconsistent results[105].
Energy and water exchange (7.5.4.2)
Many of the likely changes in water and energy exchange that occur in response to projected future warming are likely to act as a positive feedback to warming. Earlier disappearance of snow from the tundra is very likely to lead to a decline in albedo and an increase in regional warming[106]. Similarly, an expansion of forest will lead to a reduction in albedo, because trees mask a snow-covered surface. In areas where forest expansion occurs, this is very likely to lead to significant heating of the lower atmosphere (Atmosphere layers) (Sections 7.4.2.3 and 7.5.2 (Effects of climate change on landscape and regional processes and feedbacks to the climate system in the Arctic)). Paleoclimate modeling experiments have shown that the northward movement of the treeline 6,000 years BP accounted for half of the climatic warming that occurred at that time[107]. Although the current arctic treeline appears relatively stable or retreating in some areas of human impact [108] ([[Section 7.5.3.2 (Effects of climate change on landscape and regional processes and feedbacks to the climate system in the Arctic)]2]), any future northward advance of the treeline is likely to contribute to regional warming, while treeline retreat is likely to contribute to regional cooling, particularly in late spring due to the large differences in albedo between snow-covered tundra and adjacent forest.
A positive feedback (leading to increased warming) of displacement of tundra by trees and shrubs could possibly offset the negative feedback (leading to cooling) due to increased C sequestration at the local level[109], but the climate forcing by energy and water exchange operates primarily at the regional scale, where the energy exchange occurs, whereas the negative feedback due to sequestration of atmospheric C is likely to vary between regions and contribute to warming through changes in the globally mixed pool of atmospheric CO2. Models suggest that forests in the eastern Canadian Arctic would have a net negative feedback through sequestration of C whereas forests in arctic Russia would have a net positive feedback to climate through decreased albedo[110]. This complex balance between opposing feedbacks indicates that encouraging forest to displace tundra as an appropriate strategy to mitigate global climate change should take into account the local feedback.
An important contributing factor to the effect of vegetation change on albedo is the characteristics of the plant canopy in terms of canopy height relative to snow height, leaf duration, and leaf optical properties. The greatest changes in albedo are likely to occur after increases in area relative to tundra vegetation of the following vegetation types (in decreasing order of effect): dark, evergreen boreal trees such as pine and spruce, deciduous conifer trees such as larch, deciduous angiosperm trees such as birch, and low shrubs such as willows and dwarf birch.
The vegetation changes projected to occur in northern Alaska in response to climatic warming are calculated to increase summer heating of the atmosphere by 3.7 watts per square meter (W/m2)[111]. This warming is equivalent to the unit-area effect of a doubling of atmospheric CO2 concentrations or a 2% increase in the solar constant (i.e., the difference that caused a switch from a glacial to an interglacial climate), two forcings that are known to have large climatic effects[112]. Regional climate simulations suggested that a conversion from moist tussock tundra to shrub tundra would cause a 1.5 to 3.5 °C increase in mean July temperature on the Alaskan North Slope, reflecting greater sensible heat fluxes to the atmosphere from the shrub-dominated ecosystem. Thus vegetation changes of the sort that have recently been observed[113] are very likely to have large positive feedbacks to regional warming if the increased shrub cover is extensive. This vegetation–climate feedback requires only modest increases in shrub density to enhance sensible heat flux[114].
The transition from tundra to forest also affects evapotranspiration and the water storage capacity of the biosphere, such that freshwater runoff via rivers to the Arctic Ocean could possibly decrease[115].
Other human activities also have impacts on the local climate of the forest tundra. Deforestation, as a result of industrial activities or forestry, increases wind speeds; pollution leads to earlier snow-melt and increased [[temperature]s], and the northward extension of farming and settlements in general induces permafrost thawing[116].
Summary (7.5.5)
Biological and physical processes in the Arctic operate at various temporal and spatial scales to affect large-scale feedbacks and interactions with the earth system. There are four main potential feedback mechanisms between the impacts of climate change on the Arctic and the global climate system: albedo, greenhouse gas emissions or uptake by [[ecosystem]s], greenhouse gas emissions from methane hydrates, and freshwater fluxes that affect the thermohaline circulation. All of these feedbacks are controlled to some extent by changes in ecosystem distribution and character and particularly by large-scale movement of vegetation zones. However, it is difficult to assess the consequences of the interacting feedbacks or even of individual feedbacks.
There are currently too few full annual measurements available to give a solid answer to the question as to whether the circumpolar Arctic is an atmospheric source or a sink of CO2 at the landscape scale (Box 7.2). Indications are, however, that source areas currently exceed sink areas. Measurements of CH4 sources are also inadequate, but the available information indicates emissions at the landscape level that are of great importance to the total greenhouse gas balance of the circumpolar north. In addition to the effect of greenhouse gases, the energy and water balances of arctic landscapes encompass important feedback mechanisms in a changing climate. Increasing density and spatial expansion of the vegetation cover will reduce albedo and cause more energy to be absorbed on the ground; this effect is likely to exceed the negative feedback of increased C sequestration via greater primary productivity. The degradation of permafrost has complex consequences. In areas of discontinuous permafrost, warming is very likely to lead to a complete loss of the permafrost. Depending on local hydrological conditions, this may in turn lead to a wetting or drying of the environment with subsequent implications for greenhouse gas fluxes. Models projecting vegetation change in response to scenarios of future climate change indicate a 7 to 18% decrease in the area occupied by polar desert and a 4 to 11% increase in the area occupied by taiga over the next 80 years. This is projected to lead to increased carbon storage over this same period due to productivity being stimulated more than respiration. However, the balance depends on the degree of projected warming. With greater temperature increases, heterotrophic respiration is stimulated more and the projected carbon gain is less. Very few models are available for projections of future CH4 emissions, but these emissions will be extremely important to the total greenhouse gas balance and functioning of the circumpolar Arctic.
|
Box 7.2. Will the Arctic become a source of carbon, or remain a sink? There is not yet a definitive answer to this question, although past opinions favored the hypothesis that the tundra will switch from being a sink for carbon during recent millennia to becoming a source under future warming scenarios, based mainly on the response of increased soil respiration to warming relative to increases in photosynthesis. At a recent meeting of experts on carbon dynamics in the Arctic, the following authoritative consensus statements were made. Consensus statements on arctic carbon source/sink functioning from the Synthesis Workshop on “Current and future status of carbon storage and ecosystem–atmosphere exchange in the circumpolar north: Processes, budgets and projections”, Skogar, Iceland, 21 June 2003.
The new, but uncertain, insights from these statements are that the Arctic is already a source of carbon and radiative forcing, and that it is likely to become a weak sink of carbon during future warming. Other uncertainties, not addressed in the consensus statements, include:
Many uncertainties remain, and it should be noted that the carbon considered in this discussion is that in the active layer of the soil and in vegetation, and not that trapped in permafrost and methane hydrates. |
Chapter 7: Arctic Tundra and Polar Desert Ecosystems
7.1 Introduction (Effects of climate change on landscape and regional processes and feedbacks to the climate system in the Arctic)
7.2 Late-Quaternary changes in arctic terrestrial ecosystems, climate, and ultraviolet radiation levels
7.3 Species responses to changes in climate and ultraviolet-B radiation in the Arctic
7.3.1 Implications of current species distributions for future biotic change
7.3.2 General characteristics of arctic species and their adaptations in the context of changes in climate and ultraviolet-B radiation levels
7.3.3 Phenotypic responses of arctic species to changes in climate and ultraviolet-B radiation
7.3.4 Genetic responses of arctic species to changes in climate and ultraviolet-B radiation levels
7.3.5 Recent and projected changes in arctic species distributions and potential ranges
7.4 Effects of changes in climate and UV radiation levels on structure and function of arctic ecosystems in the short and long term
7.4.1 Ecosystem structure
7.4.2 Ecosystem function
7.5 Effects of climate change on landscape and regional processes and feedbacks to the climate system
7.6 Synthesis: Scenarios of projected changes in the four ACIA regions for 2020, 2050, and 2080
7.7 Uncertainties and recommendations
References
Citation
Committee, I. (2012). Effects of climate change on landscape and regional processes and feedbacks to the climate system in the Arctic. Retrieved from http://editors.eol.org/eoearth/wiki/Effects_of_climate_change_on_landscape_and_regional_processes_and_feedbacks_to_the_climate_system_in_the_Arctic- ↑ Weller, G., 2000. The weather and climate of the Arctic. In: M. Nuttall and T.V. Callaghan (eds.). The Arctic: Environment, People, Policy, pp. 143–160. Harwood Academic Publishers.
- ↑ Oechel,W.C., S.J. Hastings, G.L. Vourlitis, M. Jenkins, G. Riechers and N. Grulke, 1993. Recent change of arctic tundra ecosystems from a net carbon dioxide sink to a source. Nature, 361:520–523.–Oechel, W.C., G.L. Vourlitis, S.J. Hastings and S.A. Bochkarev, 1995. Change in Arctic CO2 flux-over two decades: Effects of climate change at Barrow, Alaska. Ecological Applications, 5:846–855.–Oechel, W.C., G.L. Vourlitis, J. Verfaillie Jr., T. Crawford, S. Brooks, E. Dumas, A. Hope, D. Stow, B. Boynton, V. Nosov and R. Zulueta, 2000a. A scaling approach for quantifying the net CO2 flux of the Kuparuk River Basin, Alaska. Global Change Biology, 6(S1):160–173.–Serreze, M.C., J.E.Walsh, F.S. Chapin III, T. Osterkamp, M. Dyurgerov, V. Romanovsky, W.C. Oechel, J. Morison, T. Zhang and R.G. Barry, 2000. Observational evidence of recent change in the northern high-latitude environment. Climatic Change, 46:159–207.
- ↑ Marion, G.M. and W.C. Oechel, 1993. Mid- to late-Holocene carbon balance in Arctic Alaska and its implications for future global warming. The Holocene, 3:193–200.
- ↑ Oechel, W.C., S.J. Hastings, G.L.Vourlitis, M. Jenkins, G. Riechers and N. Grulke, 1993. Recent change of arctic tundra ecosystems from a net carbon dioxide sink to a source. Nature, 361:520–523.–Oechel, W.C., G.L. Vourlitis, S.J. Hastings and S.A. Bochkarev, 1995. Change in Arctic CO2 flux-over two decades: Effects of climate change at Barrow, Alaska. Ecological Applications, 5:846–855.–Oechel, W.C., G.L. Vourlitis, J. Verfaillie Jr., T. Crawford, S. Brooks, E. Dumas, A. Hope, D. Stow, B. Boynton, V. Nosov and R. Zulueta, 2000a. A scaling approach for quantifying the net CO2 flux of the Kuparuk River Basin, Alaska. Global Change Biology, 6(S1):160–173.
- ↑ Harazono,Y., M. Mano, A. Miyata, R.C. Zulueta and W.C. Oechel, 2003. Inter-annual carbon dioxide uptake of a wet sedge tundra ecosystem in the Arctic. Tellus B, 55:215–231.
- ↑ Weller, G., 2000. The weather and climate of the Arctic. In: M. Nuttall and T.V. Callaghan (eds.). The Arctic: Environment, People, Policy, pp. 143–160. Harwood Academic Publishers.
- ↑ Søgaard, H., C. Nordstrøm, T. Friborg, B.U. Hansen, T.R. Christensen and C. Bay, 2000. Trace gas exchange in a high-arctic valley. 3: Integrating and scaling CO2 fluxes from canopy to landscape using flux data, footprint modeling, and remote sensing. Global Biogeochemical Cycles, 14:725–744.
- ↑ Christensen, T.R., T. Friborg, M. Sommerkorn, J. Kaplan, L. Illeris, H. Søgaard, C. Nordstrøm and S. Jonasson, 2000. Trace gas exchange in a high-arctic valley. 1: Variations in CO2 and CH4 flux between tundra vegetation types. Global Biogeochemical Cycles, 14:701–714.–Nordström, C., H. Soegaard, T.R. Christensen, T. Friborg and B.U. Hansen, 2001. Seasonal carbon dioxide balance and respiration of a high-arctic fen ecosystem in NE-Greenland. Theoretical and Applied Climatology, 70(1–4):149–166.–Søgaard, H., C. Nordstrøm, T. Friborg, B.U. Hansen, T.R. Christensen and C. Bay, 2000. Trace gas exchange in a high-arctic valley. 3: Integrating and scaling CO2 fluxes from canopy to landscape using flux data, footprint modeling, and remote sensing. Global Biogeochemical Cycles, 14:725–744.
- ↑ Friborg,T., 2005. (pers. comm.) Institute of Geography, University of Copenhagen, Denmark.
- ↑ Aurela, M.,T. Laurila and J.-P.Tuovinen, 2002. Annual CO2 balance of a subarctic fen in northern Europe: Importance of the wintertime efflux. Journal of Geophysical Research, 107(D21):4607, doi: 10.1029/2002JD002055.
- ↑ Aurela M.,T. Laurila and J.-P.Tuovinen, 2004. The timing of snow melt controls the annual CO2 balance in a subarctic fen. Geophysical Research Letters, 31:L16119, doi:10.1029/2004GL020315.
- ↑ Lloyd, C.R., 2001. The measurement and modelling of the carbon dioxide exchange at a high Arctic site in Svalbard. Global Change Biology, 7:405–426.
- ↑ Laurila, T., H. Soegaard, C.R. Lloyd, M. Aurela, J.-P. Tuovinen and C. Nordström, 2001. Seasonal variations of net CO2 exchange in European Arctic ecosystems. Theoretical and Applied Climatology, 70:183–201.
- ↑ Heikkinen, J.E.P., T.Virtanen, J.T. Huttunen, V. Elsakov and P.J. Martikainen, 2004. Carbon balance in East European tundra. Global Biogeochemical Cycles, 18(1), GB1023, doi:10.1029/2003GB002054.
- ↑ Clein, J.S., B.L. Kwiatkowski, A.D. McGuire, J.E. Hobbie, E.B. Rastetter, J.M. Melillo and D.W. Kicklighter, 2000. Modelling carbon responses of tundra ecosystems to historical and projected climate: A comparison of a plot- and a global-scale ecosystem model to identify process-based uncertainties. Global Change Biology, 6(S1):127–140.–McGuire, A.D., J.S. Clein, J.M. Melillo, D.W. Kicklighter, R.A. Meier, C.J. Vorosmarty and M.C. Serreze, 2000. Modeling carbon responses of tundra ecosystems to historical and projected climate: sensitivity of pan-arctic carbon storage to temporal and spatial variation in climate. Global Change Biology, 6(S1):141–159.
- ↑ Friend, A.D., A.K. Stevens, R.G. Knox and M.G.R. Cannell, 1997. A process-based, terrestrial biosphere model of ecosystem dynamics. (Hybrid v3.0). Ecological Modelling, 95:249–287.
- ↑ White, A., M.G.R. Cannell and A.D. Friend, 2000. The high-latitude terrestrial carbon sink: a model analysis. Global Change Biology, 6:227–245.
- ↑ McGuire, A.D., J.S. Clein, J.M. Melillo, D.W. Kicklighter, R.A. Meier, C.J.Vorosmarty and M.C. Serreze, 2000. Modeling carbon responses of tundra ecosystems to historical and projected climate: sensitivity of pan-arctic carbon storage to temporal and spatial variation in climate. Global Change Biology, 6(S1):141–159.
- ↑ Sitch, S., B. Smith, I.C. Prentice, A. Arneth, A. Bondeau, W. Cramer, J.O. Kaplan, S. Levis, W. Lucht, M.T. Sykes, K.Thonicke and S. Venevsky, 2003. Evaluation of ecosystem dynamics, plant geography and terrestrial carbon cycling in the LPJ dynamic global vegetation model. Global Change Biology, 9:161–185.
- ↑ White, A., M.G.R. Cannell and A.D. Friend, 2000. The high-latitude terrestrial carbon sink: a model analysis. Global Change Biology, 6:227–245.
- ↑ Christensen, T.R., 1993. Methane emission from Arctic tundra. Biogeochemistry, 21(2):117–139.–Morrissey, L.A and G.P. Livingston, 1992. Methane emissions from Alaska arctic tundra: An assessment of local spatial variability. Journal of Geophysical Research, 97(D15):16661–16670.–Vourlitis, G.L., W.C. Oechel, S.J. Hastings and M.A. Jenkins, 1993. The effect of soil moisture and thaw depth on CH4 flux from wet coastal tundra ecosystems on the North slope of Alaska. Chemosphere, 26(1–4):329–337.–Whalen, S.C. and W.S. Reeburgh, 1990. A methane flux transect along the Trans-Alaska Pipeline Haul Road. Tellus B: 42:237–249.–Whalen, S.C. and W.S. Reeburgh, 1992. Interannual variations in tundra methane emission: a 4-year time series at fixed sites. Global Biogeochemical Cycles, 6:139–159.
- ↑ Christensen, T.R., S. Jonasson, T.V. Callaghan and M. Havström, 1995. Spatial variation in high-latitude methane flux along a transect across Siberian and European tundra environments. Journal of Geophysical Research, 100(D10):21035–21046.–Christensen, T.R., S. Jonasson, A. Michelsen, T.V. Callaghan and M. Havström, 1998. Environmental controls on soil respiration in the Eurasian and Greenlandic Arctic. Journal of Geophysical Research, 103(D22):29015–29021.
- ↑ Panikov, N.S., M.V. Sizova, V.V. Zelenev, G.A. Machov, A.V. Naumov and I.M. Gadzhiev, 1995. Methane and carbon dioxide emission from several Vasyugan wetlands: spatial and temporal flux variations. Ecological Chemistry, 4:13–23.–Panikov, N.S., 1997. A kinetic approach to microbial ecology in arctic and boreal ecosystems in relation to global change. In: W.C. Oechel, T. Callaghan, T. Gilmanov, J.I. Holten, B. Maxwell, U. Molau and B. Sveinbjornsson (eds.). Global Change and Arctic Terrestrial Ecosystems, pp. 171–189. Springer-Verlag.–Wagner, D., S. Kobabe, E.-M. Pfeiffer and H.-W. Hubberten, 2003. Microbial controls on methane fluxes from a polygonal tundra of the Lena Delta, Siberia. Permafrost and Periglacial Processes, 14:173–185.–Zimov, S.A., G.M. Zimova, S.P. Davidov, A.I. Davidova, Y.V.Voropaev, Z.V.Voropaeva, S.F. Prosiannikov, O.V. Prosiannikova, I.V. Semiletova and I.P. Semiletov, 1993. Winter biotic activity and production of CO2 in Siberian soils: A factor in the greenhouse effect. Journal of Geophysical Research, 98:5017–5023.
- ↑ Christensen, T.R., A. Ekberg, L. Ström, M. Mastepanov, N. Panikov, M. Öquist, B.H. Svensson, H. Nykänen, P.J. Martikainen and H. Oskarsson, 2003b. Factors controlling large scale variations in methane emissions from wetlands. Geophysical Research Letters, 30(7):1414, doi:10.1029/2002GL016848.
- ↑ Roulet, N.T., A. Jano, C.A. Kelly, L.F. Klinger, T.R. Moore, R. Protz, J.A. Ritter and W.R. Rouse, 1994. Role of the Hudson Bay lowland as a source of atmospheric methane. Journal of Geophysical Research, 99(D1):1439–1454.
- ↑ Christensen, T.R., 1993. Methane emission from Arctic tundra. Biogeochemistry, 21(2):117–139.–Whalen, S.C. and W.S. Reeburgh, 1992. Interannual variations in tundra methane emission: a 4-year time series at fixed sites. Global Biogeochemical Cycles, 6:139–159.
- ↑ Hein, R., P.J. Crutzen and M. Heimann, 1997. An inverse modeling approach to investigate the global atmospheric methane cycle. Global Biogeochemical Cycles, 11:43–76.
- ↑ Friborg, T., T.R. Christensen, B.U. Hansen, C. Nordstrøm and H. Søgaard, 2000. Trace gas exchange in a high arctic valley 2: Landscape CH4 fluxes measured and modeled using eddy correlation data. Global Biogeochemical Cycles, 14:715–724.
- ↑ Søgaard, H., C. Nordstrøm, T. Friborg, B.U. Hansen, T.R. Christensen and C. Bay, 2000. Trace gas exchange in a high-arctic valley. 3: Integrating and scaling CO2 fluxes from canopy to landscape using flux data, footprint modeling, and remote sensing. Global Biogeochemical Cycles, 14:725–744.
- ↑ Christensen, T.R., I.C. Prentice, J. Kaplan, A. Haxeltine and S. Sitch, 1996. Methane flux from northern wetlands and tundra: an ecosystem source modelling approach. Tellus B:48:652–661.–Clymo, R.S. and E.J.F. Reddaway, 1971. Productivity of Sphagnum (bogmoss) and peat accumulation. Hydrobiologia, 12:181–192.–Klinger, L.F., P.R. Zimmerman, J.P. Greenberg, L.E. Heidt and A.B. Guenther, 1994. Carbon trace gas fluxes along a successional gradient in the Hudson Bay lowland. Journal of Geophysical Research, 99(D1):1469–1494.–Svensson, B.H., 1980. Carbon dioxide and methane fluxes from the ombrotrophic parts of a subarctic mire. In: M. Sonesson (ed.). Ecology of a Subarctic Mire. Ecological Bulletin, 30:235–250. Swedish Natural Science Research Council, Stockholm.–Svensson, B.H., T.R. Christensen, E. Johansson and M. Öquist, 1999. Interdecadal changes in CO2 and CH4 fluxes of a subarctic mire: Stordalen revisited after 20 years. Oikos, 85:22–30.
- ↑ IPCC, 2001. Climate Change 2001: The Scientific Basis. Contribution of Working Group I to the Third Assessment Report of the Intergovernmental Panel on Climate Change. J.T. Houghton, Y. Ding, D.J. Griggs, M. Noguer, P.J. van der Linden, X. Dai, K. Maskell and C.A. Johnson (eds.). Cambridge University Press, 881pp.
- ↑ IPCC, 2001. Climate Change 2001: The Scientific Basis. Contribution of Working Group I to the Third Assessment Report of the Intergovernmental Panel on Climate Change. J.T. Houghton, Y. Ding, D.J. Griggs, M. Noguer, P.J. van der Linden, X. Dai, K. Maskell and C.A. Johnson (eds.). Cambridge University Press, 881pp.
- ↑ Christensen, T.R. and M. Keller, 2003. Element interactions and trace gas exchange. In: J.M. Melillo, C.B. Field and B. Moldan (eds.). Interactions of the Major Biogeochemical Cycles: Global Changes and Human Impacts. SCOPE 61, pp. 247–258. Island Press.
- ↑ Friborg, T., H. Soegaard, T.R. Christensen, C.R. Lloyd and N.S. Panikov, 2003. Siberian wetlands: Where a sink is a source. Geophysical Research Letters, 30(21):2129, doi:10.1029/2003GL017797.
- ↑ Friborg, T., T.R. Christensen, B.U. Hansen, C. Nordstrøm and H. Søgaard, 2000. Trace gas exchange in a high arctic valley 2: Landscape CH4 fluxes measured and modeled using eddy correlation data. Global Biogeochemical Cycles, 14:715–724.–Søgaard, H., C. Nordstrøm, T. Friborg, B.U. Hansen, T.R. Christensen and C. Bay, 2000. Trace gas exchange in a high-arctic valley. 3: Integrating and scaling CO2 fluxes from canopy to landscape using flux data, footprint modeling, and remote sensing. Global Biogeochemical Cycles, 14:725–744.
- ↑ Eugster, W., W.R. Rouse, R.A. Pielke, J.P. McFadden, D.D. Baldocchi, T.G.F. Kittel, F.S. Chapin III, G.E. Liston, P.L. Vidale, E. Vaganov and S. Chambers, 2000. Land-atmosphere energy exchange in Arctic tundra and boreal forest: available data and feedbacks to climate. Global Change Biology, 6(S1):84–115.
- ↑ Bonan, G.B., F.S. Chapin III and S.L. Thompson, 1995. Boreal forest and tundra ecosystems as components of the climate system. Climatic Change, 29:145–167.–Foley, J.A., J.E. Kutzbach, M.T. Coe and S. Levis, 1994. Feedbacks between climate and boreal forests during the Holocene epoch. Nature, 371:52–54.
- ↑ Eugster, W., W.R. Rouse, R.A. Pielke, J.P. McFadden, D.D. Baldocchi, T.G.F. Kittel, F.S. Chapin III, G.E. Liston, P.L. Vidale, E. Vaganov and S. Chambers, 2000. Land-atmosphere energy exchange in Arctic tundra and boreal forest: available data and feedbacks to climate. Global Change Biology, 6(S1):84–115.–Rouse, W.R., 2000. The energy and water balance of high-latitude wetlands: controls and extrapolation. Global Change Biology, 6(S1):59–68.
- ↑ Osterkamp, T.E and V.E. Romanovsky, 1999. Evidence for warming and thawing of discontinuous permafrost in Alaska. Permafrost and Periglacial Processes, 10:17–37.
- ↑ Betts, A.K. and J.H. Ball, 1997. Albedo over the boreal forest. Journal of Geophysical Research, 102(D24):28901–28909.
- ↑ Beringer, J., N.J. Tapper, I. McHugh, F.S. Chapin III, A.H. Lynch, M.C. Serreze and A. Slater, 2001b. Impact of Arctic treeline on synoptic climate. Geophysical Research Letters, 28:4247–4250.
- ↑ Pielke, R.A. and P.L. Vidale, 1995. The boreal forest and the polar front. Journal of Geophysical Research, 100(D12):25755–25758.
- ↑ Bryson, R.A., 1966. Air masses, streamlines, and the boreal forest. Geographical Bulletin, 8:228–269.
- ↑ Hinzman, L.D., M. Fukuda, D.V. Sandberg, F.S. Chapin III and D. Dash, 2003. FROSTFIRE: An experimental approach to predicting the climate feedbacks from the changing boreal fire regime. Journal of Geophysical Research, 108(D1):8153, doi:10.1029/2001JD000415.
- ↑ Hinzman, L.D., D.J. Goering, S. Li and T.C. Kinney, 1997. Numeric simulation of thermokarst formation during disturbance. In: R.M.M. Crawford (ed.). Disturbance and Recovery in Arctic Lands: An Ecological Perspective, pp. 199–212. Kluwer Academic Publishers.
- ↑ Oberbauer, S.F., J.D. Tenhunen and J.F. Reynolds, 1991. Environmental effects on CO2 efflux from water track and tussock tundra in arctic Alaska, U.S.A. Arctic and Alpine Research, 23(2):162–169.–Oberbauer, S.F., C.T. Gillespie, W. Cheng, A. Sala, R. Gebauer and J.D. Tenhunen, 1996. Diurnal and seasonal patterns of ecosystem CO2 efflux from upland tundra in the foothills of the Brooks Range, Alaska, U.S.A.. Arctic and Alpine Research, 28(3):328–338.
- ↑ Rastetter, E.B., R.B. McKane, G.R. Shaver, K.J. Nadelhoffer and A.E. Giblin, 1997. Analysis of CO2, temperature, and moisture effects on carbon storage in Alaskan arctic tundra using a general ecosystem model. In: W.C. Oechel, T. Callaghan, T. Gilmanov, J.I. Holten, B. Maxwell, U. Molau and B. Sveinbjornsson (eds.). Global Change and Arctic Terrestrial Ecosystems, pp. 437–451. Springer-Verlag.
- ↑ Brown, J., K.M. Hinkel and F.E. Nelson, 2000. The Circumpolar Active Layer Monitoring (CALM) Program: research designs and initial results. Polar Geography, 24(3):165–258.
- ↑ Christensen, T.R,T. Johansson, H.J. Åkerman, M. Mastepanov, N. Malmer, T. Friborg, P. Crill and B. Svensson, 2004. Thawing sub-arctic permafrost: effects on vegetation and methane emissions. Geophysical Research Letters, 31(4):L04501, doi:10.1029/2003GL018680.–Svensson, B.H., T.R. Christensen, E. Johansson and M. Öquist, 1999. Interdecadal changes in CO2 and CH4 fluxes of a subarctic mire: Stordalen revisited after 20 years. Oikos, 85:22–30.
- ↑ Hastings, S.J., S.A. Luchessa, W.C. Oechel and J.D. Tenhunen, 1989. Standing biomass and production in water drainages of the foothills of the Philip Smith Mountains, Alaska. Holarctic Ecology, 12:304–311.–Kane, D.L., K.M. Hinkel, D.J. Goering, L.D. Hinzman and S.I. Outcalt, 2001. Non-conductive heat transfer associated with frozen soils. Global and Planetary Change, 29:275–292.
- ↑ Rovansek, R.J., L.D. Hinzman and D.L. Kane, 1996. Hydrology of a tundra wetland complex on the Alaskan Arctic Coastal Plain. Arctic and Alpine Research, 28(3):311–317.
- ↑ Betts, R.A., 2000. Offset of the potential carbon sink from boreal forestation by decreases in surface albedo. Nature, 408:187–190.–Chapin, F.S. III, W. Eugster, J.P. McFadden, A.H. Lynch and D.A. Walker, 2000a. Summer differences among Arctic ecosystems in regional climate forcing. Journal of Climate, 13:2002–2010.–Harding, R., P. Kuhry, T.R. Christensen, M.T. Sykes, R. Dankers and S. van der Linden, 2002. Climate feedbacks at the tundra-taiga interface. Ambio Special Report, 12:47–55.–McGuire, A.D., C.Wirth, M. Apps, J. Beringer, J. Clein, H. Epstein, D.W. Kicklighter, J. Bhatti, F.S. Chapin III, B. de Groot, D. Efremov, W. Eugster, M. Fukuda, T. Gower, L.D. Hinzman, B. Huntley, G.J. Jia, E.S. Kasischke, J. Melillo, V.E. Romanovsky, A. Shvidenko, E. Vaganov and D.A. Walker, 2002. Environmental variation, vegetation distribution, carbon dynamics, and water/energy exchange in high latitudes. Journal of Vegetation Science, 13:301–314.
- ↑ Vlassova, T.K., 2002. Human impacts on the tundra-taiga zone dynamics: the case of the Russian lesotundra. Ambio Special Report, 12:30–36.
- ↑ Payette, S., M. Eronen and J.J.P. Jasinski, 2002. The circumboreal tundra-taiga interface: Late Pleistocene and Holocene changes. Ambio Special Report, 12:15–22.
- ↑ Vlassova, T.K., 2002. Human impacts on the tundra-taiga zone dynamics: the case of the Russian lesotundra. Ambio Special Report, 12:30–36.
- ↑ Callaghan, T.V., R.M.M. Crawford, M. Eronen, A. Hofgaard, S. Payette, W.G. Rees, O. Skre, B. Sveinbjörnsson, T.K. Vlassova and B.R. Werkman, 2002a. The dynamics of the tundra-taiga boundary: An overview and suggested coordinated and integrated approach to research. Ambio Special Report, 12:3–5.
- ↑ Emanuelsson, U., 1987. Human influence on vegetation in the Torneträsk area during the last three centuries. In: M. Sonesson (ed.). Research in Arctic Life and Earth Sciences: Present Knowledge and Future Perspectives. Ecological Bulletin, 38:95–111.–Kullman, L., 1979. Change and stability in the altitude of the birch tree-limit in the southern Swedish Scandes 1915–1975. Acta Phytogeographica Suecica, 65:1–121.–Rapp, A., 1996. Photo documentation of landscape change in Northern Swedish mountains. In: P.S. Karlsson and T.V. Callaghan (eds.). Plant Ecology in the Sub-Arctic Swedish Lapland. Ecological Bulletin 45:170–179.–Sonesson, M. and J. Hoogesteger, 1983. Recent tree-line dynamics (Betula pubescens Ehrh. ssp. tortuosa [Ledeb.] Nyman) in northern Sweden. Nordicana, 47:47–54.
- ↑ Sturm, M., C. Racine and K. Tape, 2001b. Climate change: Increasing shrub abundance in the Arctic. Nature, 411:546–547.
- ↑ Katenin, A., 2004. (unpub. data). Komorov Botanical Institute, St. Petersburg, Russia.
- ↑ Crawford, R.M.M., C.E. Jeffree and W.G. Rees, 2003. Paludification and forest retreat in northern oceanic environments. Annals of Botany, 91:213–226.–Kozhevnikov, Y.P., 2000. Is the Arctic getting warmer or cooler? In: B.S. Ebbinge, Y.L. Mazourov and P.S. Tomkovich (eds.). Heritage of the Russian Arctic: Research, Conservation and International Cooperation, pp.145–157. Ecopros.–Vlassova, T.K., 2002. Human impacts on the tundra-taiga zone dynamics: the case of the Russian lesotundra. Ambio Special Report, 12:30–36.
- ↑ Skre, O., R. Baxter, R.M.M. Crawford, T.V. Callaghan and A. Fedorkov, 2002. How will the tundra-taiga interface respond to climate change? Ambio Special Report, 12:37–46.
- ↑ Vlassova,T.K., 2002. Human impacts on the tundra-taiga zone dynamics: the case of the Russian lesotundra. Ambio Special Report, 12:30–36.
- ↑ Vlassova, T.K., 2002. Human impacts on the tundra-taiga zone dynamics: the case of the Russian lesotundra. Ambio Special Report, 12:30–36.
- ↑ Myneni, R.B., C.D. Keeling, C.J. Tucker, G. Asrar and R.R. Nemani, 1997. Increased plant growth in the northern high latitudes from 1981–1991. Nature, 386:698–702.
- ↑ Kaplan, J.O., N.H. Bigelow, I.C. Prentice, S.P. Harrison, P.J. Bartlein, T.R. Christensen, W. Cramer, N.V. Matveyeva, A.D. McGuire, D.F. Murray, V.Y. Razzhivin, B. Smith, D.A. Walker, P.M. Anderson, A.A. Andreev, L.B. Brubaker, M.E. Edwards and A.V. Lozhkin, 2003. Climate change and Arctic ecosystems: 2. Modeling, paleodata-model comparisons, and future projections. Journal of Geophysical Research, 108(D19):8171, doi:10.1029/2002JD002559.
- ↑ Körner, C., 1998. A re-assessment of high elevation treeline positions and their explanation. Oecologia, 115:445–459.–Körner, C., 1999. Alpine Plant Life. Functional Plant Ecology of High Mountain Ecosystems. Springer, 338pp.
- ↑ Nojd, P. and P. Hari, 2001. The effect of temperature on the radial growth of Scots pine in northernmost Fennoscandia. Forest Ecology and Management, 142:65–77.
- ↑ Sveinbjörnsson, B., A. Hofgaard and A. Lloyd, 2002. Natural causes of the tundra-taiga boundary. Ambio Special Report, 12:23–29.
- ↑ Harding, R., P. Kuhry, T.R. Christensen, M.T. Sykes, R. Dankers and S. van der Linden, 2002. Climate feedbacks at the tundra-taiga interface. Ambio Special Report, 12:47–55.–Kaplan, J.O., N.H. Bigelow, I.C. Prentice, S.P. Harrison, P.J. Bartlein, T.R. Christensen, W. Cramer, N.V. Matveyeva, A.D. McGuire, D.F. Murray, V.Y. Razzhivin, B. Smith, D.A. Walker, P.M. Anderson, A.A. Andreev, L.B. Brubaker, M.E. Edwards and A.V. Lozhkin, 2003. Climate change and Arctic ecosystems: 2. Modeling, paleodata-model comparisons, and future projections. Journal of Geophysical Research, 108(D19):8171, doi:10.1029/2002JD002559.–Skre, O., R. Baxter, R.M.M. Crawford, T.V. Callaghan and A. Fedorkov, 2002. How will the tundra-taiga interface respond to climate change? Ambio Special Report, 12:37–46.
- ↑ Kaplan, J.O., N.H. Bigelow, I.C. Prentice, S.P. Harrison, P.J. Bartlein, T.R. Christensen, W. Cramer, N.V. Matveyeva, A.D. McGuire, D.F. Murray, V.Y. Razzhivin, B. Smith, D.A. Walker, P.M. Anderson, A.A. Andreev, L.B. Brubaker, M.E. Edwards and A.V. Lozhkin, 2003. Climate change and Arctic ecosystems: 2. Modeling, paleodata-model comparisons, and future projections. Journal of Geophysical Research, 108(D19):8171, doi:10.1029/2002JD002559.
- ↑ Crawford, R.M.M., C.E. Jeffree and W.G. Rees, 2003. Paludification and forest retreat in northern oceanic environments. Annals of Botany, 91:213–226.
- ↑ Yurtsev, B.A., 2001. The Pleistocene 'Tundra-Steppe' and the productivity paradox: the landscape approach. Quaternary Science Reviews, 20:165–174.
- ↑ Linderholm, H.W., B.Ö. Solberg and M. Lindholm, 2003. Tree-ring records from central Fennoscandia: the relationship between tree growth and climate along a west-east transect. The Holocene, 13:887–895.
- ↑ Payette, S., M. Eronen and J.J.P. Jasinski, 2002. The circumboreal tundra-taiga interface: Late Pleistocene and Holocene changes. Ambio Special Report, 12:15–22.
- ↑ Parmesan, C. and G. Yohe, 2003. A globally coherent fingerprint of climate change impacts across natural systems. Nature, 421:37–42.
- ↑ Sitch, S., B. Smith, I.C. Prentice, A. Arneth, A. Bondeau, W. Cramer, J.O. Kaplan, S. Levis, W. Lucht, M.T. Sykes, K. Thonicke and S. Venevsky, 2003. Evaluation of ecosystem dynamics, plant geography and terrestrial carbon cycling in the LPJ dynamic global vegetation model. Global Change Biology, 9:161–185.
- ↑ Kaplan, J.O., N.H. Bigelow, I.C. Prentice, S.P. Harrison, P.J. Bartlein, T.R. Christensen, W. Cramer, N.V. Matveyeva, A.D. McGuire, D.F. Murray, V.Y. Razzhivin, B. Smith, D.A. Walker, P.M. Anderson, A.A. Andreev, L.B. Brubaker, M.E. Edwards and A.V. Lozhkin, 2003. Climate change and Arctic ecosystems: 2. Modeling, paleodata-model comparisons, and future projections. Journal of Geophysical Research, 108(D19):8171, doi:10.1029/2002JD002559.
- ↑ White, A., M.G.R. Cannell and A.D. Friend, 2000. The high-latitude terrestrial carbon sink: a model analysis. Global Change Biology, 6:227–245.
- ↑ Billings, W.D., J.O. Luken, D.A. Mortensen and K.M. Peterson, 1982. Arctic tundra: a source or sink for atmospheric carbon dioxide in a changing environment? Oecologia, 53:7–11.–Billings, W.D., K.M. Peterson, J.O. Luken and D.A. Mortensen, 1984. Interaction of increasing atmospheric carbon dioxide and soil nitrogen on the carbon balance of tundra microcosms. Oecologia, 65:26–29.
- ↑ Billings, W.D., 1987. Carbon balance of Alaskan tundra and taiga ecosystems: Past, present, and future. Quaternary Science Reviews, 6:165–177.–Billings, W.D., J.O. Luken, D.A. Mortensen and K.M. Peterson, 1982. Arctic tundra: a source or sink for atmospheric carbon dioxide in a changing environment? Oecologia, 53:7–11.–Lal, R., J.M. Kimble and B.A. Stewart (eds.), 2000. Global Climate Change and Cold Regions Ecosystems. Lewis Publishers, 265pp.–Oechel, W.C. and W.D. Billings, 1992. Effects of global change on the carbon balance of Arctic plants and ecosystems. In: F.S. Chapin III, R.L. Jefferies, J.F. Reynolds, G.R. Shaver and J. Svoboda (eds.). Arctic Ecosystems in a Changing Climate: An Ecophysiological Perspective, pp. 139–168. Academic Press.–Oechel, W.C., S.J. Hastings, G.L. Vourlitis, M. Jenkins, G. Riechers and N. Grulke, 1993. Recent change of arctic tundra ecosystems from a net carbon dioxide sink to a source. Nature, 361:520–523.–Oechel, W.C., G.L. Vourlitis, S.J. Hastings and S.A. Bochkarev, 1995. Change in Arctic CO2 flux-over two decades: Effects of climate change at Barrow, Alaska. Ecological Applications, 5:846–855.–Oechel, W.C., G.L. Vourlitis, J. Verfaillie Jr., T. Crawford, S. Brooks, E. Dumas, A. Hope, D. Stow, B. Boynton, V. Nosov and R. Zulueta, 2000a. A scaling approach for quantifying the net CO2 flux of the Kuparuk River Basin, Alaska. Global Change Biology, 6(S1):160–173.
- ↑ Engstrom, R.N., A.S. Hope, D.A. Stow and H. Kwon, 2002. Characteristics of the spatial distribution of surface moisture in an eddy flux tower footprint in Arctic Coastal Plain ecosystems. EOS, Transactions of the American Geophysical Union, 83(2002 Fall Meeting Supplement): Abstract #H61B-0764.–Keyser, A.R., J.S. Kimball, R.R. Nemani and S.W. Running, 2000. Simulating the effects of climate change on the carbon balance of North American high-latitude forests. Global Change Biology, 6(S1):185–195.
- ↑ Silapaswan, C.S., D. Verbyla and A.D. McGuire, 2001. Land cover change on the Seward Peninsula: The use of remote sensing to evaluate the potential influences of climate change on historical vegetation dynamics. Canadian Journal of Remote Sensing, 27(5):542–554.–Sturm, M., J.P. McFadden, G.E. Liston, F.S. Chapin III, C.H. Racine and J. Holmgren, 2001a. Snow-shrub interactions in Arctic tundra: A hypothesis with climatic implications. Journal of Climate, 14:336–344.–Sturm, M., C. Racine and K. Tape, 2001b. Climate change: Increasing shrub abundance in the Arctic. Nature, 411:546–547.
- ↑ Lloyd, A.H., T.S. Rupp, C.L. Fastie and A.M. Starfield, 2003. Patterns and dynamics of treeline advance on the Seward Peninsula, Alaska. Journal of Geophysical Research, 108(D2):8161, doi:10.1029/2001JD000852.
- ↑ Bonan, G.B., D. Pollard and S.L. Thompson, 1992. Effects of boreal forest vegetation on global climate. Nature, 359:716–718.–Chapin, F.S. III, W. Eugster, J.P. McFadden, A.H. Lynch and D.A. Walker, 2000a. Summer differences among Arctic ecosystems in regional climate forcing. Journal of Climate, 13:2002–2010.–Chapin, F.S. III, A.D. McGuire, J. Randerson, R. Pielke Sr., D. Baldocchi, S.E. Hobbie, N. Roulet, W. Eugster, E. Kasischke, E.B. Rastetter, S.A. Zimov and S.W. Running, 2000b. Arctic and boreal ecosystems of western North America as components of the climate system. Global Change Biology, 6(S1):211–223.–Foley, J.A., J.E. Kutzbach, M.T. Coe and S. Levis, 1994. Feedbacks between climate and boreal forests during the Holocene epoch. Nature, 371:52–54.–McFadden, J.P., F.S. Chapin III and D.Y. Hollinger, 1998. Subgrid-scale variability in the surface energy balance of Arctic tundra. Journal of Geophysical Research, 103(D22):28947–28961.–Thomas, G. and P.R. Rowntree, 1992. The boreal forests and climate. Quarterly Journal of the Royal Meteorological Society, 118:469–497.
- ↑ Sitch, S., B. Smith, I.C. Prentice, A. Arneth, A. Bondeau, W. Cramer, J.O. Kaplan, S. Levis, W. Lucht, M.T. Sykes, K. Thonicke and S. Venevsky, 2003. Evaluation of ecosystem dynamics, plant geography and terrestrial carbon cycling in the LPJ dynamic global vegetation model. Global Change Biology, 9:161–185.–Sitch, S., A.D. McGuire, J. Kimball, N. Gedney, J. Gamon, R. Engstrom, A. Wolf, Q. Zhuang, and J. Clein, submitted. Assessing the circumpolar carbon balance of arctic tundra with remote sensing and process-based modeling approaches. Ecological Applications.
- ↑ Taalas, P., J. Kaurola, A. Kylling, D. Shindell, R. Sausen, M. Dameris, V. Grewe, J. Herman, J. Damski and B. Steil, 2000. The impact of greenhouse gases and halogenated species on future solar UV radiation doses. Geophysical Research Letters, 27(8):1127–1130.
- ↑ Betts, R.A., 2001. The boreal forest and surface albedo change. In: Proceedings of the International Conference on Arctic Feedbacks to Global Change, Rovaniemi, Finland, 25–26 October 2001, pp. 15–19. Arctic Centre, University of Lapland, Rovaniemi.
- ↑ Sitch, S., B. Smith, I.C. Prentice, A. Arneth, A. Bondeau, W. Cramer, J.O. Kaplan, S. Levis, W. Lucht, M.T. Sykes, K. Thonicke and S.Venevsky, 2003. Evaluation of ecosystem dynamics, plant geography and terrestrial carbon cycling in the LPJ dynamic global vegetation model. Global Change Biology, 9:161–185.
- ↑ Talbot, S.S., B.A. Yurtsev, D.F. Murray, G.W. Argus, C. Bay and A. Elvebakk, 1999. Atlas of Rare Endemic Vascular Plants of the Arctic. CAFF Technical Report 3. Conservation of Arctic Flora and Fauna. 73pp.
- ↑ IUCN, 2003. The 2003 IUCN Red List of Threatened Species. World Conservation Union, Species Survival Commission, Gland, Switzerland. <a class="external free" href="http://www.iucnredlist.org/" rel="nofollow" title="http://www.iucnredlist.org/">http://www.iucnredlist.org/</a>
- ↑ Harding, R., P. Kuhry, T.R. Christensen, M.T. Sykes, R. Dankers and S. van der Linden, 2002. Climate feedbacks at the tundra-taiga interface. Ambio Special Report, 12:47–55.
- ↑ McGuire, A.D., J.S. Clein, J.M. Melillo, D.W. Kicklighter, R.A. Meier, C.J. Vorosmarty and M.C. Serreze, 2000. Modeling carbon responses of tundra ecosystems to historical and projected climate: sensitivity of pan-arctic carbon storage to temporal and spatial variation in climate. Global Change Biology, 6(S1):141–159.
- ↑ McGuire, A.D., J.S. Clein, J.M. Melillo, D.W. Kicklighter, R.A. Meier, C.J. Vorosmarty and M.C. Serreze, 2000. Modeling carbon responses of tundra ecosystems to historical and projected climate: sensitivity of pan-arctic carbon storage to temporal and spatial variation in climate. Global Change Biology, 6(S1):141–159.
- ↑ McGuire, A.D., J.S. Clein, J.M. Melillo, D.W. Kicklighter, R.A. Meier, C.J. Vorosmarty and M.C. Serreze, 2000. Modeling carbon responses of tundra ecosystems to historical and projected climate: sensitivity of pan-arctic carbon storage to temporal and spatial variation in climate. Global Change Biology, 6(S1):141–159.
- ↑ White, A., M.G.R. Cannell and A.D. Friend, 2000. The high-latitude terrestrial carbon sink: a model analysis. Global Change Biology, 6:227–245.
- ↑ Sitch, S., B. Smith, I.C. Prentice, A. Arneth, A. Bondeau, W. Cramer, J.O. Kaplan, S. Levis, W. Lucht, M.T. Sykes, K. Thonicke and S. Venevsky, 2003. Evaluation of ecosystem dynamics, plant geography and terrestrial carbon cycling in the LPJ dynamic global vegetation model. Global Change Biology, 9:161–185.
- ↑ Sitch, S., B. Smith, I.C. Prentice, A. Arneth, A. Bondeau, W. Cramer, J.O. Kaplan, S. Levis, W. Lucht, M.T. Sykes, K. Thonicke and S. Venevsky, 2003. Evaluation of ecosystem dynamics, plant geography and terrestrial carbon cycling in the LPJ dynamic global vegetation model. Global Change Biology, 9:161–185.
- ↑ Ibid.
- ↑ New, M., M. Hulme and P.D. Jones, 1999. Representing twentiethcentury space-time climate variability. Part 1: development of a 1961–90 mean monthly terrestrial climatology. Journal of Climate, 12:829–856.
- ↑ Christensen, T.R. and P. Cox, 1995. Response of methane emission from Arctic tundra to climatic change: results from a model simulation. Tellus B:47:301–309.–Harriss, R., K. Bartlett, S. Frolking and P. Crill, 1993. Methane emissions from northern high-latitude wetlands. In: R.S. Oremland (ed.). Biogeochemistry of Global Change: Radiatively Active Trace Gases, pp. 449–486. Chapman & Hall.–Roulet, N.T., T. Moore, J. Bubier and P. Lafleur, 1992. Northern fens: methane flux and climatic change. Tellus B, 44:100–105.
- ↑ Granberg, G., M. Ottosson-Lofvenius, H. Grip, I. Sundh and M. Nilsson, 2001. Effect of climatic variability from 1980 to 1997 on simulated methane emission from a boreal mixed mire in northern Sweden. Global Biogeochemical Cycles, 15(4):977–991.–Walter, B.P. and M. Heimann, 2000. A process-based, climate-sensitive model to derive methane emissions from natural wetlands: Application to five wetland sites, sensitivity to model parameters, and climate. Global Biogeochemical Cycles, 14:745–766.
- ↑ Kling, G.W., G.W. Kipphut and M.C. Miller, 1992. The flux of CO2 and CH4 from lakes and rivers in arctic Alaska. Hydrobiologia, 240:23–36.–Kling, G.W., G.W. Kipphut, M.C. Miller and W.J. O'Brien, 2000. Integration of lakes and streams in a landscape perspective: the importance of material processing on spatial patterns and temporal coherence. Freshwater Biology, 43:477–497.
- ↑ Kling, G.W., G.W. Kipphut and M.C. Miller. 1991. Arctic lakes and streams as gas conduits to the atmosphere: Implications for tundra carbon budgets. Science, 251:298–301.
- ↑ Cole, J.J., N.F. Caraco, G.W. Kling and T.K. Kratz, 1994. Carbon dioxide supersaturation in the surface waters of lakes. Science, 265:1568–1570.
- ↑ Eugster, W., G. Kling, T. Jonas, J.P. McFadden, A.Wust, S. MacIntyre and F.S. Chapin III. 2003. CO2 exchange between air and water in an Arctic Alaskan and midlatitude Swiss lake: Importance of convective mixing. Journal of Geophysical Research, 108(D12):4362, doi:10.1029/2002JD002653.
- ↑ Bonan, G.B., D. Pollard and S.L. Thompson, 1992. Effects of boreal forest vegetation on global climate. Nature, 359:716–718.–Thomas, G. and P.R. Rowntree, 1992. The boreal forests and climate. Quarterly Journal of the Royal Meteorological Society, 118:469–497.
- ↑ Foley, J.A., J.E. Kutzbach, M.T. Coe and S. Levis, 1994. Feedbacks between climate and boreal forests during the Holocene epoch. Nature, 371:52–54.
- ↑ Callaghan, T.V., R.M.M. Crawford, M. Eronen, A. Hofgaard, S. Payette, W.G. Rees, O. Skre, B. Sveinbjörnsson, T.K.Vlassova and B.R. Werkman, 2002a. The dynamics of the tundra-taiga boundary: An overview and suggested coordinated and integrated approach to research. Ambio Special Report, 12:3–5.–Vlassova, T.K., 2002. Human impacts on the tundra-taiga zone dynamics: the case of the Russian lesotundra. Ambio Special Report, 12:30–36.
- ↑ Harding, R., P. Kuhry, T.R. Christensen, M.T. Sykes, R. Dankers and S. van der Linden, 2002. Climate feedbacks at the tundra-taiga interface. Ambio Special Report, 12:47–55.
- ↑ Betts, R.A., 2000. Offset of the potential carbon sink from boreal forestation by decreases in surface albedo. Nature, 408:187–190.–Betts, A.K. and J.H. Ball, 1997. Albedo over the boreal forest. Journal of Geophysical Research, 102(D24):28901–28909.
- ↑ Chapin, F.S. III, W. Eugster, J.P. McFadden, A.H. Lynch and D.A. Walker, 2000a. Summer differences among Arctic ecosystems in regional climate forcing. Journal of Climate, 13:2002–2010.
- ↑ Kattenberg, A., F. Giorgi, H. Grassl, G.A. Meehl, J.F.B. Mitchell, R.J. Stouffer, T. Tokioka, A.J. Weaver and T.M.L. Wigley, 1996. Climate models - projections of future climate. In: J.T. Houghton, L.G. Meira Filho, B.A. Callander, N. Harris, A. Kattenberg and K. Maskell (eds.). Climate Change 1995. The Science of Climate Change. Contribution of Working Group I to the Second Assessment Report of the Intergovernmental Panel on Climate Change, pp. 285–357. Cambridge University Press.
- ↑ Sturm, M., C. Racine and K. Tape, 2001b. Climate change: Increasing shrub abundance in the Arctic. Nature, 411:546–547.
- ↑ McFadden, J.P., F.S. Chapin III and D.Y. Hollinger, 1998. Subgrid-scale variability in the surface energy balance of Arctic tundra. Journal of Geophysical Research, 103(D22):28947–28961.
- ↑ Harding, R., P. Kuhry, T.R. Christensen, M.T. Sykes, R. Dankers and S. van der Linden, 2002. Climate feedbacks at the tundra-taiga interface. Ambio Special Report, 12:47–55.
- ↑ Vlassova, T.K., 2002. Human impacts on the tundra-taiga zone dynamics: the case of the Russian lesotundra. Ambio Special Report, 12:30–36.