Water and poverty in the United States
The United States (US)—contrary to reports of 100 percent access to safe water and sanitation in international surveys—has a complex landscape of low-income water issues. Also, during the late-20th century, the US has had a declining role in international water programs providing infrastructure and monitoring to support access and sanitary conditions. This has contributed to limited international awareness of low-income water programs in the US, and has limited US awareness of low-income water issues. On the one hand, these trends reflect dramatic historical improvements in water and sanitation during the 20th century, for the poor as well as those better off, and this has relevance for international programs. Close inspection indicates that the US has significant geographic areas of low-income water service that warrant attention, and a study of comparable problems and approaches would be of benefit locally and internationally. This article addresses both questions by updating a study published in Geoforum in 2007.
International surveys addressing access to safe water and sanitation continue to report 100 percent availability across America—when they include the US at all. The UN Development Programme’s Human Development Report 2007-08 reported 100 percent access to an improved water source as one of the UN Millennium Development Goals Indicators for 2006 and of the World Health Organization and UNICEF for 2004. Some international surveys by the Asian Development Bank and World Bank omit wealthy countries like the US. On the one hand, these international data come as little surprise in light of their definitions of access to safe water and sanitation[1]:
Improved water supply technologies are: household connection, public standpipe, borehole, protected dug well, protected spring, rainwater collection. "Not improved" are: unprotected well, unprotected spring, vendor-provided water, bottled water (based on concerns about the quantity of supplied water, not concerns over the water quality), tanker truck-provided water. It is assumed that if the user has access to an "improved source" then such source would be likely to provide 20 liters per capita per day (lpcd) at a distance no longer than 1,000 meters (m).
"Improved" sanitation technologies are: connection to a public sewer, connection to septic system, pour-flush latrine, simple pit latrine, ventilated improved pit latrine. The excreta disposal system is considered adequate if it is private or shared (but not public) and it hygienically separates human excreta from human contact. "Not improved" are: service or bucket latrines (where excreta are manually removed), public latrines, latrines with an open pit.
The vast majority of poor households in the US now have indoor plumbing; and almost all of the urban and rural poor have access to far more than 20 lpcd—but not 100 percent.
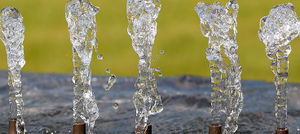
However, even cursory observation of poor areas in the US indicates the existence of residents who lack access to basic indoor water and plumbing. They include the urban homeless, migrant workers, residents of colonias along the US–Mexico border, and households living in remote areas of Native American reservations, mountainous regions, and the semiarid plains. At present, these people are not counted among the world’s 1.1 billion people who lack access to safe drinking water, or the 2.4 billion people who lack access to improved sanitation underscored in UNESCO’s second World Water Assessment published in 2006 titled, Water: A Shared Responsibility. But these poor persons in the US do lack access to basic services in a country of high aggregate wealth.
Both phenomena—achievement of widespread access for the majority, and failure to recognize and serve an uncounted minority—deserve international attention because they represent a scenario that some countries may anticipate and that hopefully others will supersede. Here we seek to understand the current situation by asking: What national water programs has the US established to improve water services for low-income groups? and What is the frequency and geographic distribution of local water and poverty problems? We address the first question with survey data, and the second with more detailed census tract data in Colorado that builds upon Brown and Ingram’s 1987 singular study of Water and Poverty in the Southwest.
Contents
- 1 The Myth of Universal Access to Water and Sanitation in the US
- 2 Limited Awareness of Low-Income Water Programs in the US
- 3 Declining US Involvement in International Water and Poverty Programs
- 4 National Low-Income Water Programs in the US
- 5 Poverty and Plumbing in Colorado
- 6 Discussion and Implications: Toward Pro-Poor Water and Sanitation in the US
- 7 Acknowledgments
- 8 Notes (Water and poverty in the United States)
- 9 References and Further Reading
The Myth of Universal Access to Water and Sanitation in the US
International perceptions of US wealth and technology obscure awareness of the social groups and places that lack safe water and sanitation. The urban homeless, for example, do not have ready access to drinking water or toilets. Many public water fountains run only seasonally, public toilets remain locked at night for fear of crime, and public baths have closed for fear of sexually-transmitted diseases—all of which reduce marginalized groups’ access to water and sanitation. These trends reflect changing public ideas about what is “safe”, and erode public rights to urban infrastructure. Urban residents risk having their water shut off for non-payment of bills. Local utility policies and practices vary widely; e.g., on average over 12,000 households are temporarily shut off each year in Denver while New York City has historically ignored delinquent accounts. A 2005 National Research Council study documented extensive unregulated wastewater discharge and exposure of less prosperous communities in southwestern Pennsylvania.
Rural areas tend to have less reliable public infrastructure. Each year local newspapers expose violations of migrant worker housing conditions in which the lack of working toilets leads to intestinal disease and environmental pollution. Some areas of Native American Indian reservations have plumbing conditions that resemble low-income rural areas of the US in the early 20th century. Colonia settlements along the US-Mexico border pay exorbitant prices for water tanker deliveries and face degraded sanitary conditions. The colonias have much in common with water problems of poor countries and while they have begun to receive detailed economic attention there is little evidence that the leaders have sought insight from international program performance.
New indices of “water poverty” do not rank the US as highly as some middle-income countries in the world. For example, the US scored 65 of 100 points on the Water Poverty Index, ranking it 31st among 147 countries. The index incorporates the environmental impacts of water development, economic inequality, and access to social as well as water services—all of which indicate that water poverty, broadly defined, poses greater and more complex challenges in the US than are generally perceived.
Limited Awareness of Low-Income Water Programs in the US
The US has created programs to address these problems, although these programs also have limited national and international visibility. For example, in 2008 the International Water and Sanitation Centre (IRC) database in the Netherlands had only three dozen US references in its library of more than 16,000 documents, almost none of which examine low-income water problems in the US. Fewer than one percent of the references identified in bibliographic searches for “water” AND “poverty” in electronic databases such as Article First, Dissertation Abstracts, GEOBASE, and Water Resources Abstracts deal with the US, notwithstanding the English-language bias of these sources. The main exceptions include research on Environmental Justice, colonias, migrant worker housing, and the history of water and sanitation movements in the 19th and early 20th centuries. United Nations databases of water and sanitation “best practices” rarely include US cases.
Contemporary scholarship in other parts of the world has framed water and sanitation crises within sophisticated global frameworks of capital flows, economic restructuring, and social movements, while US-based research concentrates on pragmatic public works and stakeholder approaches. Movements to privatize US water utilities have led to some comparisons with European and South American experiences.
Conversely, pro-poor water organizations in the US have made little use of international case studies or theoretical debates. The US Small Flows Clearinghouse includes few international references and links, though this is increasing. Similarly, pro-poor water organizations in the US that work on projects in developing countries, like Water for People and Engineers Without Borders have made few explicit connections between low-income water issues in the US and other areas of the world, though these organizations may have indirect feedback in participants’ work in the US.
Declining US Involvement in International Water and Poverty Programs
These gaps occur at a time of increasing international attention to water and poverty. US water experts have had a limited role in international water initiatives compared both with other countries and with US involvement in mid-20th century water initiatives. US scientists and organizations played an important role in the first UN conference on natural resources and river basin development at Lake Success, New York in 1948 and in subsequent international river basin programs of the 1950s through 1970s. They also took an active part in the UN Mar del Plata conference of 1977 that led to the International Decade for Water Supply and Sanitation and concurrent poverty reduction programs. Two decades later, the US assumed a less active role in programs such as the 2002 U.N. Conference on Environment and Development, which set the stage for the Millennium Development Goals of halving the proportion of people who lack access to safe water and sanitation; or the Water and Poverty Initiative presented at the 3rd World Water Forum by the Asian Development Bank.
Several factors may contribute to changing US visibility in international water and poverty programs. In the early 20th century, all countries were more exposed to international transmission of waterborne diseases than in earlier periods of history. Nineteenth-century water supplies consisted of loosely coordinated private providers until urban water-related epidemics and fires led to the establishment of sanitary commissions and scientific surveys informed by international experience.
In the mid-20th century, public water and sewer companies became known as “the silent utilities” for their combination of reliable service, conservative management, and tacit financing of metropolitan real estate development. But as municipal involvement in international water programs declined, overall US government involvement in mid-century international water development grew especially in the fields of complex river basin planning, which sought to integrate hydropower development, flood control, and irrigation and drainage systems. Some of the most significant US contributions to international water programs emanated from policy experiments that had little acceptance at home. For example, comprehensive river basin development pioneered by the Tennessee Valley Authority was emulated in many international river basins but not repeated in the US, in part because of its pro-poor rural development, land use, and electrification policies, which had declining political support in the 1950s.
Toward the end of the 20th century, by comparison, development banks shifted from sectoral financing to structural lending worldwide, and the US withdrew from major bi-lateral water infrastructure investment in all but a few areas of the world (e.g., the Middle East and to a lesser extent Africa). The shift toward structural lending policies helps explain the emphasis on water pricing and privatization vis-à-vis public infrastructure investment. At the same time, it should be noted that privatization movements emanating from the US are less active than those of the United Kingdom (UK) and France.
For these and other reasons, US involvement in international water programs had waned by the start of the 21st century, which reduced the likelihood that low-income water programs in the US would be informed by, or informative for, international water forums.
National Low-Income Water Programs in the US
Anti-poverty programs in the US give little attention to water issues, and water policies give little attention to problems faced by the poor. In 1987, Brown and Ingram’s Water and Poverty in the Southwest connected these two problems in the four-state region of Arizona, New Mexico, Colorado, and Utah. It revealed that low-income water problems are simultaneously extensive and localized. Marginal irrigation systems occur over large semi-arid regions but involve complex local environments and communities. Table 1 lists the water problems and social groups studied in our follow-up project on Water, Poverty, and Sustainable Livelihoods in Colorado. We extended the emphasis on rural water poverty to include transient and migrant groups, the urban poor, water quality, and water-related hazards.
|
Table 1: Types of Low-Income Water Problems |
|
Water Sector Problems Agricultural water scarcity Social Groups Affected Rural Anglo-Americans |
We found that low-income water issues have limited public salience within the US. The principal exceptions are Environmental Justice programs created in response to strong social movements and civil rights litigation that link consumption by privileged groups with degradation of marginalized groups and places.
Table 2 lists existing low-income water programs by agency. Few of these programs use the terms “poor” or “poverty” in their vision statements or view themselves as serving primarily poor people. They aim to achieve net economic benefits for national development “to whomsoever they accrue”. This stands in contrast with social welfare programs of the Department of Heath and Human Services and Department of Housing and Urban Development that do focus explicitly on poverty reduction. Water agencies espouse an ideology that purports to be class-neutral.
|
Table 2: National Low-Income Water Programs |
|
Environmental Protection Agency (EPA):
Bureau of Indian Affairs (BIA):
Department of Agriculture (USDA):
Health and Human Services (HHS):
Housing and Urban Development (HUD):
Regional and Multi-Jurisdictional Agencies:
National Non-Governmental Organizations and Clearinghouses:
|
As the nation’s primary water quality agency, the US Environmental Protection Agency (USEPA) provides the broadest range of low-income drinking water programs. Its National Drinking Water Advisory Council, Small Systems Implementation Working Group, has provided technical support and financing for affordability programs. However, “affordability” refers more to the financial ability of small and low-income communities to comply with water quality standards than to their ability to pay for a sustainable water supply. Some agencies like the Rural Utilities Service (RUS) have a “poverty lending rate,” which requires that the median household income be below the federal poverty line for eligibility, and other utilities have recently adopted “lifeline rates” and ascending block rates that aid low-income users as well as conservation objectives.
The Bureau of Indian Affairs has water-related programs that are supplemented by programs in the EPA American Indian Environmental Office, the HHS Indian Health Service, and HUD Indian housing programs—which illustrate the administrative fragmentation of Indian assistance programs across different agencies. The more than 500 Indian reservations in the US have enormously varied conditions, and they face a welter of small funding opportunities and bureaucratic procedures.
As a partial remedy to these fragmented low-profile programs, the US has created national clearinghouses and coordinating groups. The National Drinking Water Clearinghouse and Small Flows Clearinghouse employ a wide range of print and electronic media to inform communities of opportunities and efficient solutions for addressing water and sanitation deficiencies.
Two national surveys of small water systems provide insight into the frequency and magnitude of low-income water problems. In 1999, the US Environmental Protection Agency (USEPA) compiled data on community-scale water systems. It sheds light on relationships between water system size, ownership, revenues, and water quality violations. For example, water system size is positively correlated with public ownership, which runs counter to privatization trends elsewhere. Seventy percent of the smallest water systems are owned by local community organizations, by comparison, which include mobile home parks and homeowner associations.
The USEPA study also showed that the larger the water system, the better its financial profile and monitoring record. Small water systems had over three times the per capita infrastructure investment needs of large water systems. The smallest water systems had the greatest percentage of monitoring and reporting violations (table 3). They have weaker monitoring systems, which raises additional concerns about unmeasured water quality violations.
|
Table 3: Violations by System SIze | |
|
Population Served |
Violations (%) |
|
25-100 |
21.1 |
|
101-500 |
13.1 |
|
501-3,300 |
11.5 |
|
3,301-10,000 |
11.3 |
| Source: U.S. EPA, 1999 | |
Small systems generate lower revenues per connection. Few small systems participate in wellhead or source water protection programs. While these low rates reflect limited economies of scale, they also indicate lower ability to pay, lower levels of service, and presumably lower incomes.
While recent trends toward privatization internationally involve corporate acquisition of larger public water utilities, private ownership in the US is most common among the smallest and least financially attractive water systems, which governments have been unwilling or unable to serve. What remains uncounted and unknown across the range of these community water systems is the income distribution of their members, which limits what can be inferred about how poverty explains or exacerbates the issues they face.
A separate national survey conducted by the U.S. Department of Housing and Urban Development (HUD) offers more specific evidence about water and poverty. The American Housing Survey (AHS) occurs in representative cities, towns and rural areas each year. It defines “plumbing facilities” as indoor hot and cold piped water, a flush toilet, and a bathtub or shower for the exclusive use of residents in the housing unit. It treats the absence of any of these as a “severe physical problem,” and the failure of toilets (more than three times in three months for six hours or more) as a “moderate physical problem”. These standards are higher than the international criteria for safe water and sanitation described earlier, and they have become the norm for US housing, plumbing, and municipal ordinances. At the same time, it is not unknown for remote mountain and rural dwellings to haul water drawn from a spring or purchased from a vendor at a distant location. Nor is it uncommon for such residences to have outhouses rather than flush toilets, or to heat water for bathing on a stove. While these situations sometimes reflect conscious environmental choices, especially in mountain environments, they more commonly signal an association between incomplete plumbing and low income (Table 4).
|
Table 4: Poverty and Plumbing Problems in 2005 | ||
|
Total (%) |
Households in Poverty (%) | |
|
Total households |
100 |
15.3 |
|
Households without plumbing |
2.0 |
1.5 |
|
In Central Cities |
2.4 |
n.a. |
|
Households with plumbing |
98.8 |
97.3 |
|
Water stoppages |
3.2 |
3.7 |
|
Toilet breakdowns |
2.0 |
3.4 |
|
Sewage disposal breakdowns |
1.2 |
1.5 |
| Source: HUD, 2006 | ||
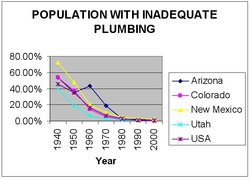
The most recently published American Housing Survey in 2005 estimates that approximately 2 percent of all housing units lack some indoor plumbing. Surprisingly, the frequency of plumbing deficiencies in households below the poverty level is not that much greater than the national average. Both rates are far below the US Census poverty rate of 12.5 percent or AHS poverty rate of 15.3 percent, which makes it clear that a large proportion of poor people in the US have gained access to improved water and sanitation despite their poverty. Six decades earlier, by contrast, the 1940 Census estimated that more than 50 percent of households in the southwestern states lacked indoor plumbing (Figure 1).
A decreasing proportion of poor households reported indoor plumbing problems over the last three years (i.e., annual water supply stoppages (3.7% compared with 5.2% in 2003), toilet breakdowns (3.4%), and sewage disposal failures (1.5%)). The gap between poor and average income households was greatest for toilet breakdowns, which suggests that public water organizations mitigate the water and sewer service maintenance problems faced in poor housing areas.
Renter, multifamily, and Hispanic households lack plumbing facilities at rates slightly greater than other groups. Mobile homes, which rely on small community-owned systems, have the highest rates of water supply stoppages (7.1%). Renter, Black, and Hispanic households also face higher than average rates of sewage and toilet breakdowns (but all <5%). Interestingly, the elderly, who have higher rates of poverty than the national average, report fewer plumbing problems, which may imply that they manage to sustain adequate housing conditions even while their incomes decline.
These EPA and HUD data support the view that access to water and sanitation is generally high and reliable in the US. They acknowledge under-reporting in remote areas, Indian reservations, and migrant housing that have plumbing conditions comparable to national conditions in 1940. However, they do not mention the living conditions of homeless or transient persons, or those living in abandoned buildings. Nor do they recognize other causes of under-reporting, including the silence of those who fear losing custody of their children due to inadequate health conditions. They thus give the impression that low-income water problems involve very small groups of unserved and underserved populations, though even in their own terms almost 2.5 million households lack some plumbing in the US. As low-income water problems become less frequent at the national level they become more localized politically, i.e., they become problems for local jurisdictions and organizations. The next section challenges these trends by examining water and poverty evidence at a finer social, spatial, and geographic scale.
Poverty and Plumbing in Colorado
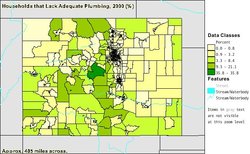
Census data at the tract level in states such as Colorado reveal that in some areas inadequate plumbing is neither spatially local nor the “last few percent” of the population. Colorado is a relatively wealthy state with a three-year average poverty rate of 9.4 percent, which is below the national average of 11.7 percent for the same period. Colorado has lower rates of inadequate plumbing, 0.9 percent of housing units sampled in 2000 than the national average of 1.4 percent. One would thus expect the state to have very low rates of water poverty except in isolated areas. To explore this hypothesis, we focused on two variables in the detailed sample data of the 2000 Census “percent in poverty” and “inadequate plumbing.”
The US Census uses the same definition of inadequate plumbing as the American Housing Survey discussed earlier. However, the Census continues to struggle with poverty measurement. While these conceptual debates do not mention water issues, poverty measurement debates involve water problems to some extent. The National Research Council has recommended that the Bureau of the Census add utility costs when estimating household income requirements, and that it compute geographic differences in the cost of living, which are affected by water conditions, when setting poverty thresholds. These deficiencies have not been addressed in poverty measurements, so it is important to keep in mind the high cost of living in urban areas, resorts, and water recreation areas; and the high cost of water utility service in rural areas of Colorado when interpreting the data discussed below.
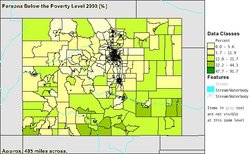
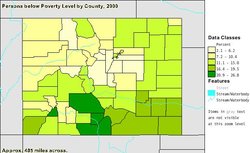
Brown and Ingram’s Water and Poverty in the Southwest (1987) used county-level census data from 1970 to identify major areas of poverty. Poverty and plumbing data at the more detailed census tract level display more variegated patterns (Figure 3). For example, the highest poverty rates exceed 47.7 percent in blighted urban areas, followed by large rural areas across southern Colorado that have two to four times the national poverty rate (i.e., 22.2 to 44.3 percent). Incomplete plumbing correlates with poverty in many census tracts of southwest Colorado, the upper Rio Grande valley and, more recently, in the Arkansas River Valley of southeastern Colorado where extra-basin water rights transfers have eroded the already weak irrigation economy (Figure 4). The highest rates of inadequate plumbing occur in mountainous areas due to remoteness, construction difficulties, occupance of seasonal housing on a year-round basis, and minimal enforcement of plumbing codes. In some rural areas of the northwest and northeast corners of the state, however, poverty and plumbing problems are only weakly correlated. In those areas, rural poverty has not created as severe plumbing problems in part because the depth of poverty (i.e., proportion whose income is 50 percent or more below the poverty line) is less than in southern Colorado.
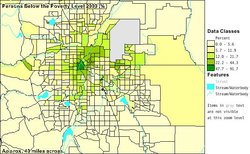
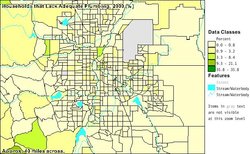
The acute poverty in areas of metropolitan Denver warrants closer comparison with plumbing conditions (Figures 5 and 6). Remarkably, areas of Denver that have poverty rates greater than 22.2 percent have plumbing problems of less than 3.3 percent in all but a few census tracts. This discrepancy indicates that poverty does not necessarily cause water problems, especially in areas served by large public utilities (with the crucial exception of urban residents so poor that they are “off-the-map”, like homeless persons and migrant workers).
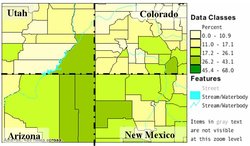
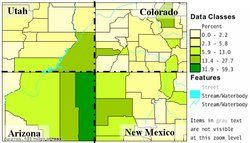
Just outside public utility service areas, however, the correlation between poverty and plumbing problems remains strong, from the low-income collar suburbs to rural areas remote from urban centers and prosperous mountain resorts. Some remote rural areas have been subdivided and sold to buyers who lack the means to create or maintain basic water services, leading to phenomena known as “subdivision settlers” and places with names like “Aristocrat estates.” The correlation between rural poverty and inadequate plumbing is strongest on economically distressed Indian reservations. The Four Corners region that encompasses the boundary lands of Colorado, New Mexico, Arizona, and Utah has some of the highest poverty rates in the US (Figures 7 and 8). Indian reservations do not necessarily have high poverty or incomplete plumbing, as evidenced by the relatively prosperous and well-served Southern Ute reservation in southwest Colorado. But the nearby Navaho nation in northeastern Arizona has some of the highest rates of both poverty (45.4 percent to 68 percent) and incomplete plumbing (greater than 31.9 percent), which bear comparison with water poverty in developing countries.
Discussion and Implications: Toward Pro-Poor Water and Sanitation in the US
These spatial patterns of water and poverty in Colorado indicate that while much has been accomplished in providing improved water and sanitation services to the population at large, it falls short of 100 percent in most areas and very far short in areas of acute poverty. These findings, as well as the more specific patterns of water and poverty in Colorado, may have relevance for a broader international audience.
Our paper began with observations regarding the declining international visibility of water and poverty programs and issues in the US. Those observations raise concerns about international awareness of US experience, and US awareness of international water and poverty programs. Other evidence may show that international water officials, scientists, and activists have greater awareness of US experience than published scientific literature would suggest. US water officials may draw upon other sources of international water and poverty information (e.g., Internet sources on international water programs). At the same time, some US water officials may question whether there is cause for concern when international comparison of the US and other countries indicate an overall pattern of success.
Much of our paper challenges this view, arguing that the story of what has been and has yet to be achieved in reducing low-income water problems in the US has international as well as domestic importance. Perceptions of the US as having nearly universal access, modern infrastructure, and extraordinary wealth diminish concerns at home and abroad. Such perceptions may also bias US involvement in international programs toward advocating programs abroad that fail to serve poor populations at home (e.g., expensive water quality testing methods, supply standards, and complicated regulatory procedures); and conversely, fail to recognize low-income innovations overseas that may have promising applications in states like Colorado (e.g., successful community and cooperative methods, and use of local inexpensive materials and technologies as documented, for example, in traditional water harvesting systems in India).
We urge a different perspective: to the extent that places in the US and elsewhere have approached 100 percent access to safe water and sanitation, they deserve close attention for what they have achieved and how they achieved it. How did Colorado extend indoor plumbing from approximately 50 percent of the population in the mid-20th century to over 98 percent by the end of the century? How did the country overall attain a similar trajectory? Where did the key innovations and commitments originate, and which ones proved transferable to other [[region]s]? Some urban areas that have persistently high rates of poverty have gained access to clean abundant water supplies during the second half of the 20th century.
Water and sanitation programs have extended indoor plumbing to nearly half of the rural population over the past half-century. How and why did this happen? Professional and trade journals offer insights into the diffusion of engineering standards, public policy innovations, technical assistance, and training programs, but much more research is needed on the relevance of historical advances in one region to understand the comparison with other regions and times.
At the same time, wealthy countries such as the US have not achieved universal access. We began with skepticism about the self-reported 100 percent access to safe water and sanitation and reported on the national surveys that document small proportions yet significant numbers of unserved groups. As the poverty line in the US is higher than those in developing countries, these achievements may have greater relevance for transitional economies and economic groups than for global water and poverty programs that focus on the poorest nations of the world. On the other hand, national surveys underestimate the problems faced by the homeless and by migrant and undocumented immigrant workers.
We described a range of national programs that address low-income water deficiencies. While some of these programs focus explicitly on alleviating poverty conditions, many are ambivalent about “pro-poor” policies. Low-income water programs in the US have limited funding and are only loosely coordinated. Fragmentation was shown to be especially prevalent in the case of water and sanitation programs for Indian reservations, which have their own special programs as well as national programs. It exacerbates the localization of low-income water issues—that is, the perception that water poverty involves small pockets of deprivation in an otherwise expansively prosperous and well-served territory. Fine-grained analysis of low-income water problems in Colorado shows that these problems are varied and widely dispersed. “Pockets” of water poverty do occur in mountain environments where complex terrain and settlement patterns accentuate differences in access to water and sanitation, but water poverty affects larger areas and groups as well, e.g., on some Native American reservations. It affects the predominantly Hispanic populations of the southern tier of counties across Colorado at frequencies an order of magnitude greater the state average, though by no means uniformly. It occurs in distressed rural areas, migratory labor camps, abandoned irrigation canal districts, degraded floodplains, poorly maintained public housing, and aging unincorporated subdivisions with substandard water and sewer lines. Each of these places constitutes a small percentage of the state total, but collectively they falsify the myth of universal access.
In some cases low-income communities in the US face conditions similar to those in developing countries, which suggests that a comparative, engaged approach may be useful both for the US and other nations. Much can be learned from successes and failures worldwide. For this reason, as well as for the insights sought by all nations aspiring to the Millennium Development Goals, it is vital to draw the low-income water issues and programs in the US back into the forum of international research and policy.
Acknowledgments
This article is a shortened but updated version of “Water and Poverty in the United States,” Geoforum 38 801-814 (2007) 801-814 (special issue on pro-poor water research). The research was carried out with support from National Science Foundation grant 9905293.
Notes (Water and poverty in the United States)
References and Further Reading
- Brown, F.L. and Ingram, H., 1987. Water and poverty in the Southwest. Tucson, University of Arizona. ISBN: 0816510385.
- Mutz, K.M.; Bryner, G.C.; and Kenney, D.S., 2002. Justice and Natural Resources: Concepts, Strategies, and Applications. Washington, Island Press. ISBN: 1559638982.
- UNESCO, 2006. Water: A Shared Responsibility. Second United Nations World Water Development Report. Paris, UNESCO. ISBN: 9231040065.
- U.S. Department of Housing and Urban Development (HUD), March 2006. American Housing Survey for the United States, 2005. Current Housing Reports. Washington, DC, US Government Printing Office. ISBN: 0160770351.
- U.S. Environmental Protection Agency (USEPA), National Drinking Water Advisory Council Small Systems Implementation Working Group. 1999. National Characteristics of Drinking Water Systems serving Populations under 10,000. EPA 816-R-99-010. Washington, DC.
- Water Aid, 2008. Checked 1 March 2008.
- Water for People, 2008. Checked 1 March 2008.
- Wescoat, J.L. Jr. 2005. Water policy and cultural exchange: transferring lessons from around the world to the western United States. In Kenney, D.S. (Ed.). In Search of Sustainable Water Management: International Lessons for the American West and Beyond. Northampton, MA, Edgar Elgar, pp. 1-24. ISBN: 1847200214.
- Wescoat, J.L., Jr.; Halvorson, S.; Headington, L.; and Replogle, J., 2002. Water, Poverty, Equity and Justice in Colorado: A Pragmatic Approach. In Mutz, K. Bryner, G. and Kenney, D. (Eds.), Justice and Natural Resources: Concepts, Strategies, and Applications. Washington, Island Press, pp. 57-85. ISBN: 1559638982.
- World Health Organization (WHO) and United Nations Children's Fund, 2000. Water Supply and Sanitation Collaborative Council. Global Water Supply and Sanitation Assessment, 2000 Report. Geneva and New York, WHO, pp. 77- 78. ISBN: 9241562021.
Citation
Wescoat, L., Theobald, R., & Headington, L. (2013). Water and poverty in the United States. Retrieved from http://editors.eol.org/eoearth/wiki/Water_and_poverty_in_the_United_States- ↑ WHO and UNICEF, 2000, 77-78