Precipitation and evapotranspiration in the Arctic
This is Section 6.2 of the Arctic Climate Impact Assessment.
Lead Author: John E.Walsh; Contributing Authors: Oleg Anisimov, Jon Ove M. Hagen,Thor Jakobsson, Johannes Oerlemans,Terry D. Prowse,Vladimir Romanovsky, Nina Savelieva,Mark Serreze, Alex Shiklomanov, Igor Shiklomanov, Steven Solomon; Consulting Authors: Anthony Arendt, David Atkinson, Michael N. Demuth, Julian Dowdeswell, Mark Dyurgerov, Andrey Glazovsky, Roy M. Koerner, Mark Meier, Niels Reeh, Oddur Sigur0sson, Konrad Steffen, Martin Truffer
Contents
Background (6.2.1)
The cryosphere and hydrological system will respond not only to changes in the thermal state of the Arctic, but also to available moisture. For example, higher temperatures will alter the phase of precipitation, the length of the melt season, the distribution of permafrost, and the depth of the active layer, with consequent impacts on river discharge, subsurface storage, and glacier mass balance. However, these systems also depend on the balance between precipitation (P) and evapotranspiration/sublimation (collectively denoted as E).
The distribution of P and E in the Arctic has been a subject of accelerating interest in recent years. Two factors account for this surge of interest. The first is the realization that variations in hydrological processes in the Arctic have major implications not only for arctic terrestrial and marine ecosystems, but also for the cryosphere and the global ocean. The second arises from the large uncertainties in the distribution of P and E throughout the Arctic. Uncertainties concerning even the present-day distributions of P and E are sufficiently large that evaluations of recent variations and trends are problematic. The uncertainties reflect:
- the sparse network of in situ measurements of P (several hundred stations, with very poor coverage over northern Canada and the Arctic Ocean), and the virtual absence of such measurements of E (those that do exist are mostly from field programs of short duration);
- the difficulty of obtaining accurate measurements of solid P in cold windy environments, even at manned weather stations;
- the compounding effects of elevation on P and E in topographically complex regions of the Arctic, where the distribution of observing stations is biased toward low elevations and coastal regions; and
- slow progress in exploiting remote sensing techniques for measuring high-latitude P and E owing to the heterogeneous emissivity of snow-and-ice covered surfaces, difficulties with cloud/snow discrimination, and the near-absence of coverage by ground-based radar.
Progress in mapping the spatial and seasonal distributions of arctic P has resulted from the use of information on gauge bias adjustment procedures, for example, from the World Meteorological Organization (WMO) Solid Precipitation Measurement Intercomparison[1]. Colony et al.[2], Yang[3], and Bogdanova et al.[4] recently completed summaries of P over the Arctic Ocean, where only measurements from coastal and drifting ice stations are available. The Bogdanova et al.[5] study, which accounts for all the major systematic errors in P measurement, found the mean annual bias-corrected P for the central Arctic Ocean to be 16.9 centimeters (cm) – 32% higher than the uncorrected value. The spatial pattern shows an increase from minimum values of <10 cm/year over Greenland and 15 to 20 cm/year over much of the Arctic Ocean, to >50 cm/yr over parts of the North Atlantic subpolar seas.
| Table 6.1. Mean annual water budget components in four major drainage basins based on data from 1960 to 1989[6]. | ||||||
|---|---|---|---|---|---|---|
| P (mm) | P-E (mm) | E1 (mm) | E2 (mm) | R (mm) | R/P | |
| Ob | 534 | 151 | 383 | 396 | 138 | 0.26 |
| Yenisey | 495 | 189 | 306 | 256 | 239 | 0.48 |
| Lena | 403 | 179 | 224 | 182 | 221 | 0.55 |
| Mackenzie | 411 | 142 | 269 | 241 | 171 | 0.41 |
| P: mean annual precipitation; P-E: precipitation minus evapotranspiration; E1: difference between the independently-derived P and P-E; E2: difference between basin-averaged P and R; R: runoff. | ||||||
Estimates of evaporation over the Arctic Ocean are scarce. The one-year Surface Heat Budget of the Arctic Ocean (SHEBA) project collected some of the best measurements during 1997 and 1998 in the Beaufort Sea. These observations showed that evaporation was nearly zero between October and April, and peaked in July at about 7 millimeters (mm)/month[7].
Serreze et al.[8] compiled estimates of P and E for the major terrestrial watersheds of the Arctic using data from 1960 to 1989. Table 6.1 presents basin-averaged values of mean annual P, precipitation minus evapotranspiration (P-E), runoff (R), and E (computed in two ways). In this study, P was derived from objectively analyzed fields of gauge-adjusted station measurements; P-E from the atmospheric moisture flux convergences in the National Centers for Environmental Prediction/National Center for Atmospheric Research (NCEP/NCAR) reanalysis; and R from gauges near the mouths of the major rivers. E was computed in two ways: E1 is the difference between the independently derived P and P-E, and E2 is the difference between basin-averaged P and R.
The two estimates of E differ by as much as 20%, providing a measure of the uncertainty in the basin-scale means of the hydrological quantities. At least some, and probably most, of the uncertainty arises from biases in measurements of P. All basins show summer maxima in P and E, and summer minima in P-E (Fig. 6.1).
Precipitation minus evapotranspiration is essentially zero during July and August in the Mackenzie Basin, and negative during June and July in the Ob Basin, illustrating the importance of E in the hydrological budget of arctic terrestrial regions. In addition, about 25% of July P in the large Eurasian basins is associated with the recycling of moisture from E[9]. The relatively low ratios of R to P (R/P,Table 6.1) in the Ob Basin are indicative of the general absence of permafrost (19% coverage in this basin, see section 6.8.2), while the relatively high ratios (and smaller E values) in the Lena and Mackenzie Basins are consistent with larger proportions of permafrost, which reduces infiltration and enhances R.
Additional estimates of the freshwater budget components of arctic and worldwide rivers, using data for earlier years, are provided by Oki et al[10]. Rouse et al.[11]provide a more detailed analysis of the Mackenzie Basin water cycle. The present-day hydrological regimes of the various arctic subregions are discussed further in sections 6.4 (Precipitation and evapotranspiration in the Arctic) and 6.8 (Precipitation and evapotranspiration in the Arctic).
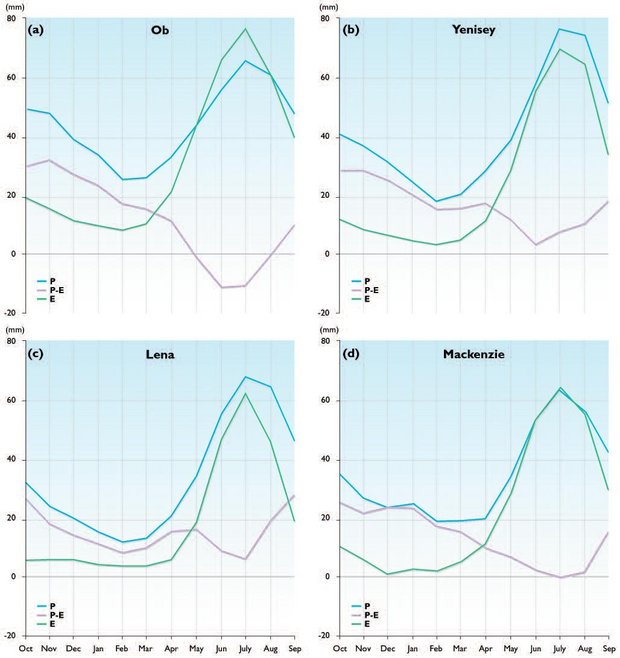 Figure 6.1. Mean monthly precipitation (P), precipitation minus evapotranspiration (P-E), and evapotranspiration (E) for the four major arctic watersheds, using data from 1960 to 1989. E is the calculated difference between P and P-E (E1 in text). Seasonal cycle corresponds to water year[12].
 Recent and ongoing changes (6.2.2)
Given the uncertainties in the climatologies of arctic P and E, it is not surprising that information on recent variations and trends in these variables is limited. Time series obtained from reanalyses are subject to inhomogeneities resulting from changes in the input data over multi-decadal timescales, while trends computed using station data are complicated by measurement errors. Changes in the rain/snow ratio during periods of warming or cooling at high-latitude sites further complicate the use of in situ measurements for trend determination[13].
The Intergovernmental Panel on Climate Change[14] has consistently reported 20th-century P increases in northern high latitudes (55°–85° N)[15]. The increase is similar to that in Karl’s[16] “Arctic region”, which includes the area poleward of 65° N but excludes the waters surrounding southern Greenland. In both cases, the greatest increase appears to have occurred during the first half of the 20th century. However, the time series are based on data from the synoptic station network, which is unevenly distributed and has undergone much change. Nevertheless, the increase in the early 20th century is reproduced by some model simulations of 20th-century climate[17].
Groisman and Easterling[18] present data showing an increase in P over northern Canada (poleward of 55° N) since 1950. For the period since 1960, the gauge-adjusted and basin-averaged data of Serreze et al.[19] show no discernible trends in mean annual P over the Ob, Yenisey, Lena, and Mackenzie Basins. However, summer P over the Yenisey Basin decreased by 5 to 10% over the four decades since 1960. The variations in P in these basins are associated with variations in the atmospheric circulation.
Although they are subject to the caveats that accompany trends of derived quantities in a reanalysis, trends of annual E determined primarily by summer E) in the NCEP/NCAR reanalysis are negative in the Ob Basin and positive in the Yenisey and Mackenzie Basins. Serreze et al.[20] suggest that recent increases in winter discharge from the Yenisey Basin may have been associated with [[permafrost] thawing within the basin in recent decades. Further discussion of recent trends in variables associated with P may be found in Sections 6.4.2 and 6.8.2 (Precipitation and evapotranspiration in the Arctic).
Projected changes (6.2.3)
The five ACIA (Arctic Climate Impact Assessment (ACIA))-designated climate models (Section 1.4.2 (Precipitation and evapotranspiration in the Arctic)), forced with the B2 emissions scenario (Section 4.4.1 (Precipitation and evapotranspiration in the Arctic)), were used to project 21st-century change in P, E, and P-E. The models are the CGCM2 (Canadian Centre for Climate Modelling and Analysis), CSM_1.4 (National Center for Atmospheric Research), ECHAM4 OPYC3 (Max-Planck Institute for Meteorology), GFDL-R30_c (Geophysical Fluid Dynamics Laboratory), and HadCM3 (Hadley Centre for Climate Prediction and Research). Model projections are presented as averages for the Arctic Ocean and for the five largest arctic river basins: the Ob, Yenisey, Pechora, Lena, and Mackenzie. The models differ widely in their simulations of baseline (1981–2000) values of P, E, and P-E (Table 6.2). For each of the three variables (P, E, and P-E), the projected changes by 2071–2090 are generally smaller than the range in baseline values simulated by the different models.
| Table 6.2. Ranges in baseline (1981–2000) values of mean annual precipitation and evapotranspiration simulated by the five ACIA designated models for the Arctic Ocean and major arctic river basins. | ||
|---|---|---|
| P (mm) | E (mm) | |
| Arctic Ocean | 220a – 504b | 39b – 92c |
| Ob | 708c - 1058d | 302a – 426d |
| Yenisey | 604c – 898b | 224a – 276b |
| Lena | 552c – 881b | 200c – 312d |
| Pechora | 493c – 1080b | 144c – 246d |
| Mackenzie | 670c – 958d | 330c – 557a |
|
P: Precipitation; E: Evapotranspiration. ECHAM4/OPYC3; bCGCM2; cCSM_1.4; dHadCM3. Source: ACIA) | ||
In general, the models project modest increases in P by the end of the 21st century. Figure 6.2 illustrates the changes projected for the 2071–2090 time slice as percentages of the baseline (1981–2000) values simulated by the models. The values of P, E, and P-E projected for the earlier time slices are generally between the models’ baseline values and those for the 2071–2090 time slice, although sampling variations result in some instances of non-monotonicity, especially when the changes are small. As indicated in Fig. 6.2, there is a wider across-model range in projected changes in E than in projected changes in P. There is even considerable disagreement among the models concerning the sign of the changes in E: in every region, at least one model projects a decrease, although most of the projected changes are positive. However, the baseline values for E from which the changes occur are much smaller than the corresponding baseline values for P (Table 6.2), so the projected unit changes in E are generally smaller than the projected unit changes in P.
Of the variables considered here, the one with the greatest relevance to other parts of the arctic system is P-E, which represents the net moisture input to the surface from the atmosphere. With one exception (the CSM_1.4, which projects the least warming of the five models), the projected changes in P-E are positive (Fig. 6.2). The greatest increase, 14% (averaged across all models), is projected to occur over the Arctic Ocean, where even the CSM_1.4 projects an increase in P-E. Over the terrestrial watersheds, the projected increases range from 6 to 12% (averaged across all models). These changes are considerably smaller than the departures from the means occurring during individual years and even during multi-year periods in the model simulations. Since the projected changes in P and P-E are generally positive, it is likely that the most consequential changes in these variables will be increases in the frequency and/or duration of wet periods. However, the annual averaging of the variables shown in Fig. 6.2 obscures a potentially important seasonality. The projected changes in P-E are generally smaller, and occasionally negative, over the major river basins during the warm season. This relative decrease in projected P-E during summer is the result of two factors: an increase in E due to projected temperature increases; and a longer season with a snow-free surface and above-freezing temperatures in the upper soil layers, resulting in greater projected E. Consequently, the model projections point to the distinct possibility that increased river flow rates during winter and spring will be accompanied by decreased flow rates during the warm season. The latter is consistent with the results of the Mackenzie Basin Impact Study[21].
 Figure 6.2. Percentage change in (a) precipitation, (b) evapotranspiration, and (c) precipitation minus evapotranspiration between 1981–2000 and 2071–2090 projected by the five ACIA-designated models for the Arctic Ocean and five major arctic river basins. Solid circles are five-model means; vertical line segments denote the ranges of the five model projections. (Source: ACIA)
 Impacts of projected changes (6.2.4)
On other parts of the physical system
The projected increases in P, and more importantly in P-E, imply an increase in water availability for soil infiltration and runoff. The increases in P-E projected to occur by 2071–2090 over the major terrestrial watersheds imply that the mean annual discharge to the Arctic Ocean will increase by 6 to 12%. Since the mean annual P-E over the Arctic Ocean is projected to increase by 14% over this period, a substantial increase in the freshwater supplied to the Arctic Ocean is projected to occur by the later decades of the present century. If there is an increase in the supply of fresh water to the Arctic Ocean, it will increase the stratification of the Arctic Ocean, facilitate the formation of sea ice, and enhance freshwater export from the Arctic Ocean to the North Atlantic (Sections 6.5.4 and 6.8.4 (Precipitation and evapotranspiration in the Arctic)). In addition, increased aquatic transport and associated heat fluxes across the coastal zone are likely to accelerate the degradation of coastal permafrost in some areas.
The projected increases in P and P-E imply generally wetter [[soil]s] when soils are not frozen, increased surface flows above frozen soils, wetter active layers in the summer, and greater ice content in the upper soil layer during winter. To the extent that the projected increase in P occurs as an increase in snowfall during the cold season (Section 6.4 (Precipitation and evapotranspiration in the Arctic)), the Arctic Ocean and its terrestrial watersheds will experience increases in snow depth and snow water equivalent, although the seasonal duration may be shorter if warming accompanies the increase in P. Moreover, the projected increase in mean annual P-E obscures important seasonality. Recent trends of increasing E in the Yenisey and Mackenzie Basins (Section 6.2.2 (Precipitation and evapotranspiration in the Arctic)) raise the possibility that P-E will actually decrease during the summer when E exceeds P, resulting in a drying of soils during the warm season.
On ecosystems
The projected increase in P-E over the terrestrial watersheds will increase moisture availability in the upper soil layers, favoring plant growth in regions that are presently moisture-limited. However, as previously noted, projected increases in E during the summer are likely to lead to warm-season soil drying and reduced summer river levels. Thawing of permafrost, which could increase the subsurface contribution to streamflow and possibly mitigate the effect of increased E during summer, is another complicating factor.
The projected increase in river discharge is likely to increase nutrient and sediment fluxes to the Arctic Ocean, with corresponding impacts on coastal marine ecosystems (Section 9.3.2 (Precipitation and evapotranspiration in the Arctic)). If P increases during winter and ice breakup accelerates, an increase in flood events is likely. Higher flow rates in rivers and streams caused by such events are likely to have large impacts on riparian regions and flood plains in the Arctic. Wetland ecosystems are likely to expand in a climate regime of increased P-E, with corresponding changes in the fluxes of trace gases (e.g., carbon dioxide and methane) across the surface–atmosphere (Atmosphere layers) interface.
Projected increases in P and P-E will result in generally greater availability of surface moisture for arctic residents. In permafrost-free areas, water tables are likely to be closer to the surface, and moisture availability for agriculture will increase. During the spring period when enhanced P and P-E are likely to increase river levels, the risk of flooding will increase. Lower water levels during the summer would affect river navigation, increase the threat from forest fires, and affect hydropower generation.
Critical research needs (6.2.5)
It is apparent from Table 6.2 and Fig. 6.2 that models differ widely in their simulations of P and P-E in baseline climate simulations and in projections of future climate. The result is a very large range in uncertainty for future rates of moisture supply to the arctic surface. There is an urgent need to narrow the range in uncertainty by determining the reasons for the large across-model variances in P and E, and by bringing the models’ baseline simulations of P and E into closer agreement with observational data. That the observational data are also uncertain indicates a need for collaboration between the observational and modeling communities, including the remote sensing community, in reconciling models and data.
The most problematic variable of those considered is E. Despite its direct relevance to the surface moisture budget and to terrestrial ecosystems, very few observational data are available for assessing model simulations of E. The 21st-century simulations summarized here show that the models do not agree even on the sign of the changes in E in the Arctic. Improved model parameterizations of E will need to address factors such as the effects of vegetation change and simulation of transpiration rates using more realistic vegetation parameters, such as leaf area index instead of a single crop factor. Datasets for validating and calibrating model-simulated E (including better use of satellite data) are one of the most urgent needs for developing scenarios of arctic hydrology.
Chapter 6: Cryosphere and Hydrology
6.1. Introduction (Precipitation and evapotranspiration in the Arctic)
6.2. Precipitation and evapotranspiration
6.3. Sea ice (Sea ice in the Arctic)
6.4. Snow cover
6.5. Glaciers and ice sheets
6.6. Permafrost (Permafrost in the Arctic)
6.7. River and lake ice
6.8. Freshwater discharge
6.9. Sea-level rise and coastal stability
References
Citation
Committee, I. (2012). Precipitation and evapotranspiration in the Arctic. Retrieved from http://editors.eol.org/eoearth/wiki/Precipitation_and_evapotranspiration_in_the_Arctic- ↑ Goodison, B.E., P.Y.T. Louie and D. Yang, 1998. WMO Solid Precipitation Measurement Intercomparison, Final Report. WMO TD-No. 872. World Meteorological Organization, 212pp.
- ↑ Colony, R.,V.F. Radionov and F.J. Tanis, 1998. Measurements of precipitation and snow pack at Russian North Pole drifting stations. Polar Record, 34:3–14.
- ↑ Yang, D., 1999. An improved precipitation climatology for the Arctic Ocean. Geophysical Research Letters, 26:1625–1628.
- ↑ Bogdanova, E.G., B.M. Ilyin and I.V. Dragomilova, 2002. Application of an improved bias correction model to precipitation measured at Russian North Pole drifting stations. Journal of Hydrometeorology, 3:700–713.
- ↑ Bogdanova, E.G., B.M. Ilyin and I.V. Dragomilova, 2002. Application of an improved bias correction model to precipitation measured at Russian North Pole drifting stations. Journal of Hydrometeorology, 3:700–713.
- ↑ Serreze, M.C., D.H. Bromwich, M.P. Clark, A.J. Etringer, T. Zhang and R. Lammers, 2003. Large-scale hydro-climatology of the terrestrial Arctic drainage system. Journal of Geophysical Research, 108(D2). doi:10.1029/2001JD000919.
- ↑ Persson, P.O.G., C.W. Fairall, E.L. Andreas, P.S. Guest and D.K. Perovich, 2002. Measurements near the atmospheric surface flux group tower at SHEBA: Near surface conditions and surface energy budget. Journal of Geophysical Research, 107(C10), doi:10.1029/2002JC000705.
- ↑ Serreze, M.C., D.H. Bromwich, M.P. Clark, A.J. Etringer, T. Zhang and R. Lammers, 2003. Large-scale hydro-climatology of the terrestrial Arctic drainage system. Journal of Geophysical Research, 108(D2). doi:10.1029/2001JD000919.
- ↑ Serreze, M.C., D.H. Bromwich, M.P. Clark, A.J. Etringer, T. Zhang and R. Lammers, 2003. Large-scale hydro-climatology of the terrestrial Arctic drainage system. Journal of Geophysical Research, 108(D2). doi:10.1029/2001JD000919.
- ↑ Oki, T., K. Musiake, H. Matsuyama and K. Masuda, 1995. Global atmospheric water balance and runoff from large river basins. Hydrological Processes, 9:655–678.
- ↑ Rouse, W.R., E.M. Blyth, R.W. Crawford, J.R. Gyakum, J.R. Janowicz, B. Kochtubajda, H.G. Leighton, P. Marsh, L. Martz, A. Pietroniro, H. Ritchie, W.M. Schertzer, E.D. Soulis, R.E. Stewart, G.S. Strong and M.K. Woo, 2003. Energy and water cycles in a high-latitude north-flowing river system. Bulletin of the American Meteorological Society, 84:73–87.
- ↑ Serreze, M.C., D.H. Bromwich, M.P. Clark, A.J. Etringer, T. Zhang and R. Lammers, 2003. Large-scale hydro-climatology of the terrestrial Arctic drainage system. Journal of Geophysical Research, 108(D2). doi:10.1029/2001JD000919.
- ↑ Forland, E.J. and I. Hanssen-Bauer, 2000. Increased precipitation in the Norwegian Arctic: True or false? Climatic Change, 46:485–509.
- ↑ IPCC, 1996. Climate Change 1995: The Science of Climate Change. J.T. Houghton, L.G. Meira Filho, B.A. Callender, N. Harris, A. Kattenberg and K. Maskell (eds.). Intergovernmental Panel on Climate Change, Cambridge University Press, 572pp.– IPCC, 2001. Climate Change 2001: The Scientific Basis. Contribution of Working Group I to the Third Assessment Report of the Intergovernmental Panel on Climate Change. J.T. Houghton, Y. Ding, D.J. Griggs, M. Noguer, P.J. van der Linden, X. Dai, K. Maskell and C.A. Johnson (eds.). Cambridge University Press, 881pp.
- ↑ See Fig. 3.11 of IPCC, 1996. Climate Change 1995: The Science of Climate Change. J.T. Houghton, L.G. Meira Filho, B.A. Callender, N. Harris, A. Kattenberg and K. Maskell (eds.). Intergovernmental Panel on Climate Change, Cambridge University Press, 572pp.
- ↑ Karl, T., 1998. Regional trends and variations of temperature and precipitation. In: R.T. Watson, M.C. Zinyowera, R.H. Moss and D.J. Dokken (eds.). The Regional Impacts of Climate Change: An Assessment of Vulnerability, pp. 412–425. Intergovernmental Panel on Climate Change, Cambridge University Press.
- ↑ Kattsov, V.M. and J.E. Walsh, 2000. Twentieth-century trends of Arctic precipitation from observational data and a climate model simulation. Journal of Climate, 13:1362–1370.– Paeth, H., A. Hense and R. Hagenbrock, 2002. Comments on ‘Twentieth-century trends of Arctic precipitation from observational data and a climate model simulation.’ Journal of Climate, 15:800–803.
- ↑ Groisman, P.Y. and D.R. Easterling, 1994. Variability and trends of total precipitation and snowfall over the United States and Canada. Journal of Climate, 7:184–205.
- ↑ Serreze, M.C., D.H. Bromwich, M.P. Clark, A.J. Etringer, T. Zhang and R. Lammers, 2003. Large-scale hydro-climatology of the terrestrial Arctic drainage system. Journal of Geophysical Research, 108(D2). doi:10.1029/2001JD000919.
- ↑ Serreze, M.C., D.H. Bromwich, M.P. Clark, A.J. Etringer, T. Zhang and R. Lammers, 2003. Large-scale hydro-climatology of the terrestrial Arctic drainage system. Journal of Geophysical Research, 108(D2). doi:10.1029/2001JD000919.
- ↑ Cohen, S.J. (ed.), 1997. Mackenzie Basin Impact Study (MBIS): Final Report. Environment Canada.