Earth, Inc. Shareholder Report: Capital Accounting
| Topics: |
Contents
Life Satisfaction
Recent research on quality of life issues has used two basic methods for measurement. One method relies on gathering data on social or economic indicators to reflect the degree to which human needs are being met. The second method uses self reported levels of happiness, pleasure, fulfillment, and other similar measurements, and has been termed ‘Life Satisfaction’. For the purposes of the Shareholder report, we will focus on the second method of measuring quality of life and life satisfaction.
Life Satisfaction is assessed by individual or group responses to questions about happiness, utility, and/or welfare. The relationship between specific human needs and perceived satisfaction with each of them can be affected by many things, such as a person’s mental capacity, cultural context, access to information, education, temperament, and the like. Also, the relationship between the fulfillment of human needs and overall life satisfaction is affected by the importance that the individuals, groups, and cultures give to fulfilling each of the human needs relative to the others over time.
The Shareholder report aims to present, synthesize, and draw conclusions from data on national levels of life satisfaction, (our proxy measure of quality of life) with data on built, human, social and natural capital, in order to better explain what determines national levels of life satisfaction (quality of life).
The life satisfaction data from the World Values Survey provides us with a baseline national level estimates. We can compare this against the individual data available for each of the four capitals at the national level, producing a four-capital accounting of the interrelationship between capital and life satisfaction. This analysis of the four capitals will allow us to demonstrate the relative contributions of each capital to human quality of life.
Accounting
GDP only
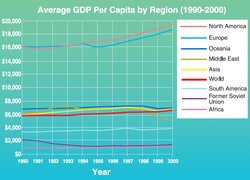 Figure 1. Average GDP per capita by region (1990-2000). (Source: Authors)
 Economic activity is fundamentally a spatial phenomenon, meaning that traditional marketed economic activities, such as manufacturing, sales, and final consumption, occur at specific geographical locations. These activities, and hence GDP, can be measured using high resolution satellite images of light emissions from each nation. Light is a visual representation of where the economic activity is occurring and in certain circumstances can be a more accurate indicator then national GDP especially in understanding spatial patterns on a national and global scale.
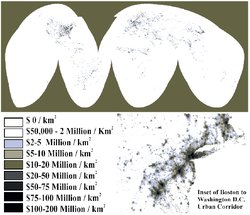 Figure 2. Nighttime light imagery can be used as a proxy to calculate marketed economic activity (GDP). (Source: Authors)
 Figure 2, a map of the satellite imagery of light emitted, is perhaps the highest spatial resolution estimate of GDP known to date. The concentration of GDP in the United States, European Union, and Japan is immediately obvious.
The dominant theory in economics today boils down to the idea that “more is better”, in essence, an increase in income creates an increase in well being and life satisfaction for an individual and a nation. When analyzed from a whole systems ecological economic perspective, this turns out to be false.
Below the $10,000 level, increases in GDP significantly influence human wellbeing and quality of life. Above the $10,000 level, the strong direct contribution of GDP to human welfare quickly declines. A four capital assessment of this phenomenon is that at least three factors are at work:
- The contributions of human, social, and natural capital are left out of GDP.
- Once material needs have been met, other factors become more important.
- The possibility of "uneconomic growth". "Uneconomic growth" occurs when the costs of growth exceed the benefits. The accumulation of material possessions invariably leads to pollution, sprawl, and depletion of resources. At a certain point these costs outweigh the benefits and further growth is detrimental to welfare.
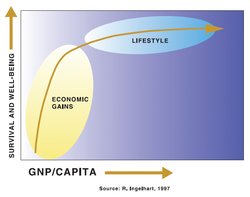 Figure 3. GNP per capita and survival and well-being. (Source: R. Ingelhart, 1997)
 So we see that more money does not guarantee that life will improve past a certain point. There are limits to the importance of money in life satisfaction and quality of life. Money covers the basics… anything beyond that requires something more… those things encompassed by the four capital types.
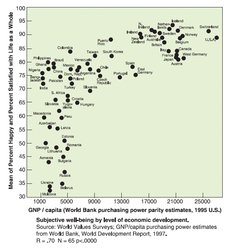 Figure 4. Subjective well-being by level of economic development. R = .70 N = 65 p<.0000. (Source: World Values Surveys; GNP/capita purchasing power estimates from World Bank, World Development Report, 1997)
 However, results show that people in wealthy countries do report greater life satisfaction and well being than those in poorer countries. This makes sense when we consider that national wealth is strongly correlated with human rights, equality, fulfillment of basic biological needs, and individualism. 21 Therefore, although income or wealth is not the only factor found to influence life satisfaction, it is usually one of the major factors. For this reason, four capital accounting does not reject the inclusion of GDP as a measure, but instead incorporates it as one of several important pieces of information in a more complex measurement of capital contributions to life satisfaction and human quality of life.
Built & Human Capital
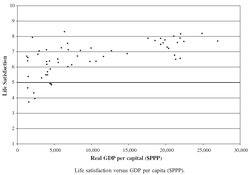 Figure 5. Life satisfaction versus GDP per capita (SPPP). (Source: Authors)
 For this report, we’ve chosen to represent human and built capital together in the forms of the UN Human Development Index (HDI) and the World Values Survey. The combination of income/wealth with human capital (which represents health and to some extent, human rights, and equality) in the HDI allows us to cover both capitals in a single measure.
HDI is a better predictor of life satisfaction than GDP (displayed in Figure 1). Because HDI incorporates human capital, a strong relationship exists between HDI and life satisfaction, which does not occur with GDP only. This tells us that positive human capital, which is often overlooked in measurements, carries more weight in a person’s life satisfaction than money alone.
Natural Capital
In an effort to quantify and understand natural capital at the national level, a proxy measurement of natural capital has been developed, called the Ecosystem Service Product (ESP). ESP is an important type of non-marketed value which is typically not captured in standard economic measures, such as GDP.
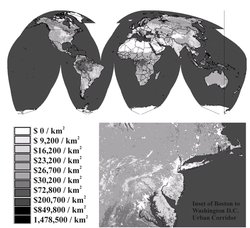 Figure 6. Global map of non-marketed economic activity (ESP) arising from ecosystem services and derived from land cover at 1 km2. (Source: Authors)
 ESP is a useful measurement as it can be updated using the latest available [[satellite] measurements], has widespread global coverage, with enough data can show changes over time, can be calculated down to a resolution of 1 km2, and is clear and easily understood.
The ESP indicator is very distinct from other environmental-economic measures, mostly because of the high spatial resolution of the data from which it was derived. Nevertheless, it is a static (snapshot) measurement of both marketed and non-marketed values at a single point in time. On the other hand, the high spatial resolution of this data will help support and inform future research into both the spatial and temporal attributes of ecosystem service valuation. For example, many ecosystem services provide benefits at spatial scales ranging from the local scale to the global scale (e.g. carbon sequestration may be considered a global service whereas water purification may be considered a local service). ESP provides the ability to work at and between both scales.
The following maps represent a new and more comprehensive picture of marketed and non-marketed economic value at the global scale. The 1 km2 resolution of information used provides a look at how these values are distributed around the globe.
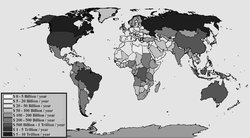 Figure 7. Nationally Aggregated map of ESP (Ecosystem Service Product). (Source: Authors)
 Figure 6 is a spatially detailed map of ecosystem service values (without the marine component). These values are concentrated in tropical areas and wetlands, along with a broad distribution of ecosystem services from forests and grasslands.
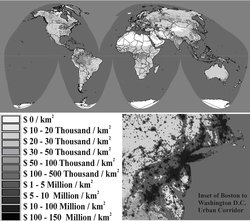 Figure 8: Subtotal Ecological-Economic Product (SEP = GDP+ESP) at 1 km2 resolution (w/ Boston -DC). (Source: Authors)
 Figure 7 displays ESP at the national scale, and also includes estimates of marine contributions to the ESP value. In this view, the physical size of the country (area) has a major influence on the results. All of the countries with large land areas (US, Canada, Russia, China, Brazil, Australia) also have high ESP values.
Figure 8 displays a subtotal of the combination of GDP + ESP, to give the Subtotal Ecological Economic Product (SEP). It is called subtotal because it considers only the ecosystem values and services that are known to date, and thus is incomplete (as new services and values are being continually discovered and understood scientifically). SEP is a closer approximation of the true total value of goods and services produced annually which support the human economy, as it considers both GDP and ESP.
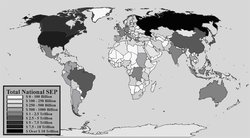 Figure 9. Nationally Aggregated map of SEP (Subtotal Ecological-Economic Product). (Source: Authors)
 Figure 9 displays SEP at the national scale. Again here, large countries have an advantage and rank highest for SEP; but small countries with high GDPs, (such as Japan and EU countries) also rank highly in this category.
Countries with high SEPs and low populations (Population growth rate) (such as Canada, Greenland, Suriname, Gabon) rank near the top of the list of SEP per capita. Countries with moderate SEPs and very high populations (such as China and India) rank near the bottom of SEP per capita calculations. This raises questions about the ‘real’ income of people when both GDP & ESP measurements are rightly considered together.
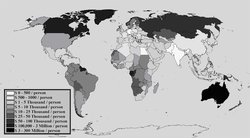 Figure 10. Nationally Aggregated map of SEP per Capita. (Source: Authors)
 Figure 10 also tells us the ‘wealth’ of individuals in a nation, as wealth here is rightly measured as a combination of marketed (GDP/capita) and non-marketed (ESP/capita) contributions. In Figure 10 we see that Canada, Greenland, Surinam, Gabon, and several small island countries like the Bahamas and the Netherlands Antilles rank highest. A second tier includes
Scandinavia, Russia, Australia, New Zealand, Bolivia, and Botswana. A third tier includes The US (ranked 53rd out of 227), most of Europe and parts of Africa and South America, while China, India and parts of Africa are ranked lowest.
Obviously SEP/capita leaves out many factors which contribute to real welfare (including distribution of wealth, political freedom, etc.), it does present a very different picture of wealth (and poverty) than the conventional GDP statistics.
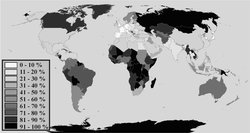 Figure 11. Nationally Aggregated map of %ESP (=100 * (ESP/SEP)). (Source: Authors)
 Figure 11 displays percent-ESP at the national scale (% of total national land producing ESP?). Russia, Canada, and much of Africa and South America top this list. The nations with the highest%ESP were: Equatorial Guinea (99%), Guyana (98%), Democratic Republic of Congo (Zaire) (98%), Central African Republic (97%), Mongolia (97%), and numerous small island nations and protectorates. The nations with the lowest%ESP scores were amongst those considered most developed: Hong Kong (0%), Belgium (1%), Singapore (1%), and Luxembourg (1%).
Figure 8 also tells us which countries have the highest percentage of support of human welfare arising from ecosystem services when compared to marketed goods and services those countries produce. Countries as disparate as Canada, Russia, Nicaragua, and Botswana ranking high, and most of Europe and Japan ranking low. Northern industrial countries (with the exception of Canada) have focused on built capital and have depleted much of their national natural capital.
The importance of natural capital was also seen in the significant bivariate correlation between natural capital and life satisfaction. This suggests that a natural capital variable should be included more often in analyses of life satisfaction, both at the individual and social level.
Social Capital
Currently, no good proxy exists to measure social capital. One proxy that was identified based on Freedom House’s press freedom rating for 1995. Freedom House assesses the freedom of the press within a nation by focusing on four categories: the law, political factors, economic factors, and degree of actual violations. After analysis, however, it was found that there is no significant relationship, between the social capital variable, press freedom, and life satisfaction. Other social capital variables including political rights rating, civil liberties rating, and corruption perceptions index, were also investigated but none had a better relationship with life satisfaction than press freedom.
Many of these social capital variables are so closely related with the combined human and built capital variable, HDI, and its relationship with life satisfaction that it is difficult to measure it independently.
Another problem is that the type of social capital variables available at the national level are probably not the most appropriate. The social capital variables that are available generally do not impact individuals in their daily lives and therefore are more likely to have an impact on social life satisfaction rather than personal life satisfaction. To look at personal life satisfaction at the national scale, variables on the importance of friends and family would be a better proxy for social capital. However, such variables are only available for a small number of countries.
Predicted Life Satisfaction
The combination of GDP, built and human capital, natural capital, and social capital explain a large portion of the variance in life satisfaction and can be used to predict national life satisfaction. Overall, UN’s HDI is able to explain a significant percentage of the variation in life satisfactions. However, with the addition of natural capital, which has a significant positive impact on life satisfaction, greatly improved the prediction.
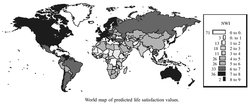 Figure 12. Observed Life Satisfaction versus Predicted Life Satisfaction. (Source: Authors)
 Figure 12 shows the predicted life satisfaction values by country. North America, Europe, Australia, and parts of South America (the darker countries on the map) have higher predicted life satisfaction values than countries with lower predicted life satisfaction values found in Africa and Asia.
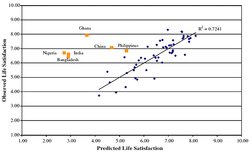 Figure 13. World map of predicted life satisfaction values. (Source: Authors)
 Figure 13 shows the actual reported life satisfaction values for the 56 countries with life satisfaction data, versus the predicted life satisfaction values calculated using the four-capital ecological economic approach.
Some of the countries in this analysis did not fit the overall trend. Their data points are represented by the orange outlier points in Figure 2. A likely explanation for these outliers exists. Some cultures value individualism and nuclear-families, whereas other cultures value strong social and large extended-family networks. For this reason, the standard calculations being used for this analysis needs to be modified and improved to take into account the cultural differences that are being currently missed; namely, the higher reliance on social capital for maintaining high levels of life satisfaction.
Further Reading
- Robert Costanza, Brendan Fisher, Saleem Ali et al., Ecological Economics, 61 (2-3), 267 (2007).
- Freedom House, 1999. News of the Century: Press Freedom 1999. Freedom House. http://freedomhouse.org/pfs99/pfs99.pdf, September 30, 2003.
- Ronald Inglehart, Modernization and postmodernization: cultural, economic, and political change in 43 societies. (Princeton University Press, Princeton, N.J., 1997).
- Inglehart, R., et al., 2000. World Values Surveys and European Values Surveys, 1981–1984, 1990–1993, and 1995–1997 File. Institute for Social Research [producer], Inter-university Consortium for Political and Social Research [distributor], Ann Arbor, MI.
- Paul C. Sutton and Robert Costanza, Ecological Economics 41 (3), 509 (2002).
- United Nations Development Programme, Human Developmen Report 1998. (Oxford University Press, New York, 1998).
- Amanda W. Vemuri and Robert Costanza, Ecological Economics 58 (1), 119 (2006).
| This is a chapter from Earth, Inc. Shareholder Report (e-book). Previous: Views of Earth|Table of Contents|Next: Shareholder Equity |