Climate change and sea ice

Contents
Sea Ice
 Mean sea ice anomalies, 1953-2007: Passive microwave-derived (SMMR / SSM/I) sea ice extent departures from monthly means for the Northern Hemisphere, January 1953 to September 2007. Image courtesy of Walt Meier and Julienne Stroeve, National Snow and Ice Data Center, University of Colorado, Boulder. (Source: NSIDC)
 Sea ice is frozen seawater that floats on the ocean surface. Blanketing millions of square kilometers, sea ice forms and melts with the polar seasons, affecting both human activity and biological habitat. In the Arctic, some sea ice persists year after year, whereas almost all Southern Ocean or Antarctic sea ice is "seasonal ice," meaning it melts away and reforms annually. While both Arctic and Antarctic ice are of vital importance to the marine mammals and birds for which they are habitats, sea ice in the Arctic appears to play a more crucial role in regulating climate.
Because they are composed of ice originating from glaciers, icebergs are not considered sea ice. Most of the icebergs infesting North Atlantic shipping lanes originate from Greenland glaciers.
Global Sea Ice Extent and Concentration: What sensors on satellites are telling us about sea ice
 Extent comparisons: This graph compares 5-day running means for Arctic sea ice extent (area of ocean with ice concentration of at least 15 percent) for the long-term mean (1979-2000), the previous record low (2005) and the record low (2007). Although the summer of 2007 began with slightly greater ice extent than in 2005, rapid melting commenced in late June. During a two-week period in late June and early July 2007, sea ice declined by an area roughly equal to the size of Kansas each day. Sea ice extent continued its steady decline through mid-September, 2007. Image provided by National Snow and Ice Data Center, University of Colorado, Boulder. (Source: NSIDC)
 Sea ice regulates exchanges of heat, moisture and salinity in the polar oceans. It insulates the relatively warm ocean water from the cold polar atmosphere (Atmosphere layers) except where cracks, or leads, in the ice allow exchange of heat and water vapor from ocean to atmosphere in winter. The number of leads determines where and how much heat and water are lost to the atmosphere, which may affect local cloud cover and precipitation.
The seasonal sea ice cycle affects both human activities and biological habitats. For example, companies shipping raw materials such as oil or coal out of the Arctic must work quickly during periods of low ice concentration, navigating their ships towards openings in the ice and away from treacherous multi-year ice that has accumulated over several years. Many arctic mammals, such as polar bears, seals, and walruses, depend on the sea ice for their habitat. These species hunt, feed, and breed on the ice. Studies of polar bear populations indicate that declining sea ice is likely to decrease polar bear numbers, perhaps substantially (Stirling and Parkinson 2006).
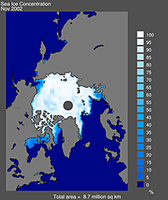
 Extent anomaly maps, 2002-2007: Sea ice conditions for the month of September, 2002 through 2007, derived from the NSIDC Sea Ice Index. Each image shows the concentration anomaly (key at lower right) and the 1979-2000 mean September ice edge (pink line). For each year, the ice edge is well north of its mean position off the coasts of Alaska and Siberia. Image provided by National Snow and Ice Data Center, University of Colorado, Boulder. (Source: NSIDC)
 Ice thickness, its spatial extent, and the fraction of open water within the ice pack can vary rapidly and profoundly in response to weather and climate. Sea ice typically covers about 14 to 16 million square kilometers in late winter in the Arctic and 17 to 20 million square kilometers in the Antarctic Southern Ocean. The seasonal decrease is much larger in the Antarctic, with only about three to four million square kilometers remaining at summer's end, compared to approximately seven to nine million square kilometers in the Arctic. These maps provide examples of late winter and late summer ice cover in the two hemispheres.
Monitoring sea ice
Passive microwave satellite data represent the best method to monitor sea ice because of the ability to show data through most clouds and during darkness. Passive microwave data allow scientists to monitor the inter-annual variations and trends in sea ice cover. Observations of polar oceans derived from these instruments are essential for tracking the ice edge, estimating sea ice concentrations, and classifying sea ice types. In addition to the practical use of this information for shipping and transport, these data add to the meteorological knowledge base required for better understanding climate.
 Northwest Passage, September 2007: The summer of 2007 saw the opening of the Northwest Passage. Navigated with great difficulty between 1903 and 1906, the passage opened to standard ocean-going vessels a century later. On September 15, 2007, the same time Arctic sea ice reached its record low, the Moderate Resolution Imaging Spectroradiometer (MODIS) on NASA's Terra satellite captured this relatively cloud-free image of the open passage. Image courtesy Jeff Schmaltz, MODIS Rapid Response Team, NASA GSFC. (Source: NSIDC)
 Decline in Arctic sea ice extent
Passive microwave satellite data reveal that, since 1979, winter Arctic ice extent has decreased about 3.6 percent per decade (Meier et al. 2006). Antarctic ice extent is increasing (Cavalieri et al. 2003), but the trend is small.
Satellite data from the SMMR and SSM/I instruments have been combined with earlier observations from ice charts and other sources to yield a time series of Arctic ice extent from the early 1900s onward. While the pre-satellite records are not as reliable, their trends are in good general agreement with the satellite record and indicate that Arctic sea ice extent has been declining since at least the early 1950s.
 Northwest Passage: The maroon line marks the route of the Northwest Passage that opened up in 2007. Image courtesy University of Bremen. (Source: NSIDC)
 In recent years, satellite data have indicated an even more dramatic reduction in regional ice cover. In September 2002, sea ice in the Arctic reached a record minimum (Serreze et al. 2003), 4 percent lower than any previous September since 1978, and 14 percent lower than the 1979-2000 mean. In the past, a low ice year would be followed by a rebound to near-normal conditions, but 2002 was followed by two more low-ice years, both of which almost matched the 2002 record. Taking these three years into account, the September ice extent trend for 1979-2004 declined by 7.7 percent per decade (Stroeve et al. 2005). The year 2005 set a new record, dropping the estimated decline in end-of-summer Arctic sea ice to approximately 8 percent per decade. Although sea ice did not set a new record low in 2006, it did fall below normal for the fifth consecutive year. In 2007, sea ice broke all prior satellite records, reaching a record low a month before the end of melt season. Through 2007, the September decline trend is now over 10 percent per decade. (For current sea ice trends, visit NSIDC's Sea Ice Index Cryospheric Climate Indicators.)
 Mean sea ice draft: Decrease in Arctic Sea Ice Draft for 1958 to 1997. Graph derived from Rothrock et al. 1999. (Source: NSIDC)
 Combined with record low summertime extent, Arctic sea ice exhibited a new pattern of poor winter recovery. In the past, a low-ice year would be followed by a rebound to near-normal conditions, but 2002 was followed by two more low-ice years, both of which almost matched the 2002 record (see Arctic Sea Ice Decline Continues). Although wintertime recovery of Arctic sea ice improved somewhat after 2006, wintertime extents have remained well below the long-term average.
Decline in Arctic Sea Ice Thickness
Sea ice thickness has likewise shown substantial decline in recent decades (Rothrock et al. 1999). Using data from submarine cruises, Rothrock and collaborators determined that the mean ice draft at the end of the melt season in the Arctic has decreased by about 1.3 meters between the 1950s and the 1990s.
Estimates based on measurements taken by NASA's ICESat laser altimeter, first-year ice that formed after the autumn of 2007 had a mean thickness of 1.6 meters. The ice formed relatively late in the autumn of 2007, and NSIDC researchers had actually anticipated this first-year ice to be thinner, but it nearly equaled the thickness of 2006 and 2007. Snow accumulation on sea ice helps insulate the ice from frigid air overhead, so sparse snowfall during the winter of 2007-2008 might have actually accelerated the sea ice's growth.
Decline causes
Greenhouse gases emitted through human activities and the resulting increase in global mean temperatures are the most likely underlying cause of the sea ice decline, but the direct cause is a complicated combination of factors resulting from the warming, and from climate variability. The Arctic Oscillation (AO) is a see-saw pattern of alternating atmospheric pressure at polar and mid-latitudes. The positive phase produces a strong polar vortex, with the mid-latitude jet stream shifted northward. The negative phase produces the opposite conditions. From the 1950s to the 1980s, the AO flipped between positive and negative phases, but it entered a strong positive pattern between 1989 and 1995. So the acceleration in the sea ice decline since the mid 1990s may have been partly triggered by the strongly positive AO mode during the preceding years (Rigor et al. 2002 and Rigor and Wallace 2004) that flushed older, thicker ice out of the Arctic, but other factors also played a role.
 September concentrations, 1979-2007 (Source: NSIDC)
 Since the mid-1990s, the AO has largely been a neutral or negative phase, and the late 1990s and early 2000s brought a weakening of the Beaufort Gyre. However, the longevity of ice in the gyre began to change as a result of warming along the Alaskan and Siberian coasts. In the past, sea ice in this gyre could remain in the Arctic for many years, thickening over time. Beginning in the late 1990s, sea ice began melting in the southern arm of the gyre, thanks to warmer air temperatures and more extensive summer melt north of Alaska and Siberia. Moreover, ice movement out of the Arctic through Fram Strait continued at a high rate despite the change in the AO. Thus warming conditions and wind patterns have been the main drivers of the steeper decline since the late 1990s. Sea ice may not be able to recover under the current persistently warm conditions, and a tipping point may have been passed where the Arctic will eventually be ice-free during at least part of the summer (Lindsay and Zhang 2005).
 Ever wonder how the ice edge position in the Beaufort Sea last summer compares to its position this summer? Need to know the total area covered by ice last April? Find the answer quickly with Sea Ice Index images showing monthly mean Arctic and Antarctic ice concentration and extent, along with trends and anomalies in concentration and extent based on satellite passive microwave data. Documentation helps users understand trends in the context of natural variability, and outlines some of the assumptions and limitations that accompany linear regression for trend analysis. (Source: NSIDC)
 Examination of the long-term satellite record dating back to 1979 and earlier records dating back to the 1950s indicate that spring melt seasons have started earlier and continued for a longer period throughout the year (Serreze et al. 2007). Even more disquieting, comparison of actual Arctic sea ice decline to IPCC AR4 projections show that observed ice loss is faster than any of the IPCC AR4 models have predicted (Stroeve et al. 2007).
| Disclaimer: This article is taken wholly from, or contains information that was originally published by, the National Snow and Ice Data Center. Topic editors and authors for the Encyclopedia of Earth may have edited its content or added new information. The use of information from the National Snow and Ice Data Center should not be construed as support for or endorsement by that organization for any new information added by EoE personnel, or for any editing of the original content. |