Air pollution in China
Contents
Perception of Air Pollution in China
Reading recent journal articles with titles such as “16 Chinese cities named in the World Bank list of 20 most polluted cities”, "China is No 1 carbon dioxide emitter" or “As China Roars, Pollution Reaches Deadly Extremes” must give the impression that total unprecedented situations regarding air pollution (Air pollution emissions) are encountered in China.
The situation is no doubt quite grave. In an overview by the World Bank (1) of the 20 cities exposed to highest concentrations of particulate matter (particles or droplets (aerosols) suspended in the air (Atmospheric composition and structure)), published a few years ago, quite a lot of Chinese cities were mentioned (see Table 1).
|
Particulate matter air pollution, World Bank 2004 | |||
| Rank | City | Country | Part. Matter |
| 1 | Cairo | Egypt | 169 |
| 2 | Delhi | India | 150 |
| 3 | Kolkata | India | 128 |
| 4 | Tianjin | China | 125 |
| 5 | Chongqing | China | 123 |
| 6 | |||
| 7 | Kampur | India | 109 |
| 8 | Lucknow | India | 109 |
| 9 | Jakarta | Indonesia | 104 |
| 10 | Shenyang | China | 101 |
| 11 | Zhengzhou | China | 97 |
| 12 | Jinan | China | 94 |
| 13 | Lanzhou | China | 91 |
| 14 | Taiyuan | China | 88 |
| 15 | |||
| 16 | Beijing | China | 89 |
| 17 | Chengdu | China | 86 |
| 18 | Ahmadabad | China | 83 |
| 19 | Anshan | China | 82 |
| 20 | Wuhan | China | 79 |
| Source: The World Bank | |||
For reasons unknown, number 6 is missing in this list. The Blacksmith Institute in London has assembled another list, based on a large array of different types of air (Atmospheric composition and structure), water and soil pollution (see Table 2) (2).
|
Table 2. Blacksmith List of most polluted cities and areas. (The Blacksmith Institute 2006) | ||
| Rank | City | Country |
| 1 | Sumgayit | Azerbaijan |
| 2 | Linfen | China |
| 3 | Tianying | China |
| 4 | Sukinda | India |
| 5 | Vapi | India |
| 6 | La Oroya | Peru |
| 7 | Dzerzhinsk | Russia |
| 8 | Norilsk | Russia |
| 9 | Chernobyl | Ukraine |
| 10 | Kabwe | Zambia |
In this list, two Chinese cities or areas are included: Linfen, in view of very serious air pollution caused by the use of coal, and water pollution, e.g., lead and arsenic in the Huai River basin, due mainly to industrial and agricultural waste.
In a recent overview of carbon dioxide (CO2) emissions (the most important greenhouse gas) a Dutch institute (Netherlands Environmental Agency , 2007) came to the conclusion that China had surpassed the US and now was the largest CO2 emitter in the world. This listing was based on the overviews on energy use as compiled by British Petroleum.
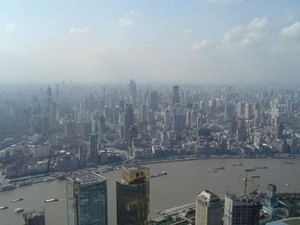
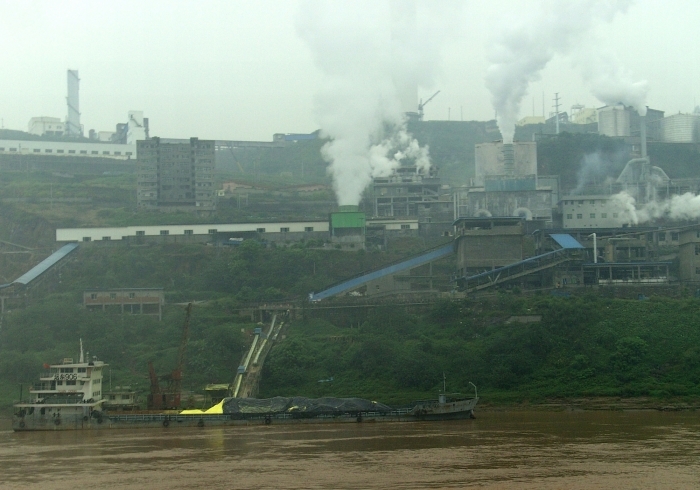
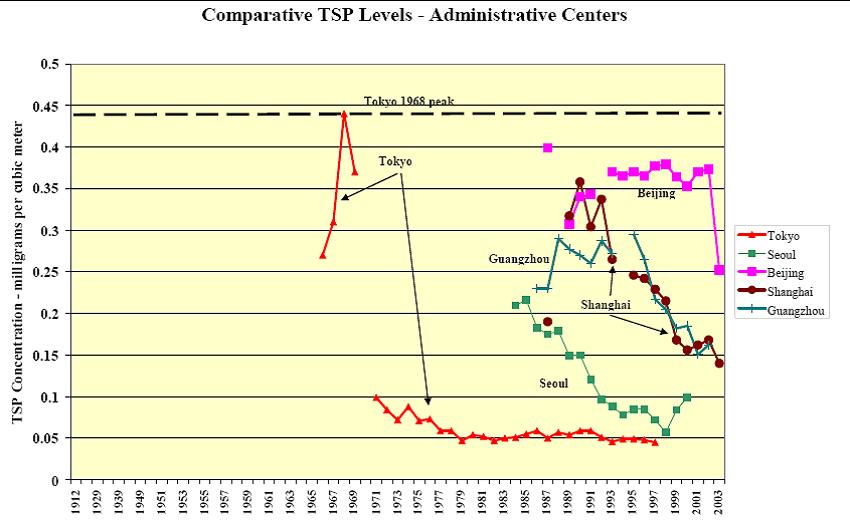
The environmental situation in China’s industrial centers and Mega-Cities is indeed a serious problem. As an example, the historical concentration of particulate matter in 5 Chinese cities is shown in Figure 1(4, 5).
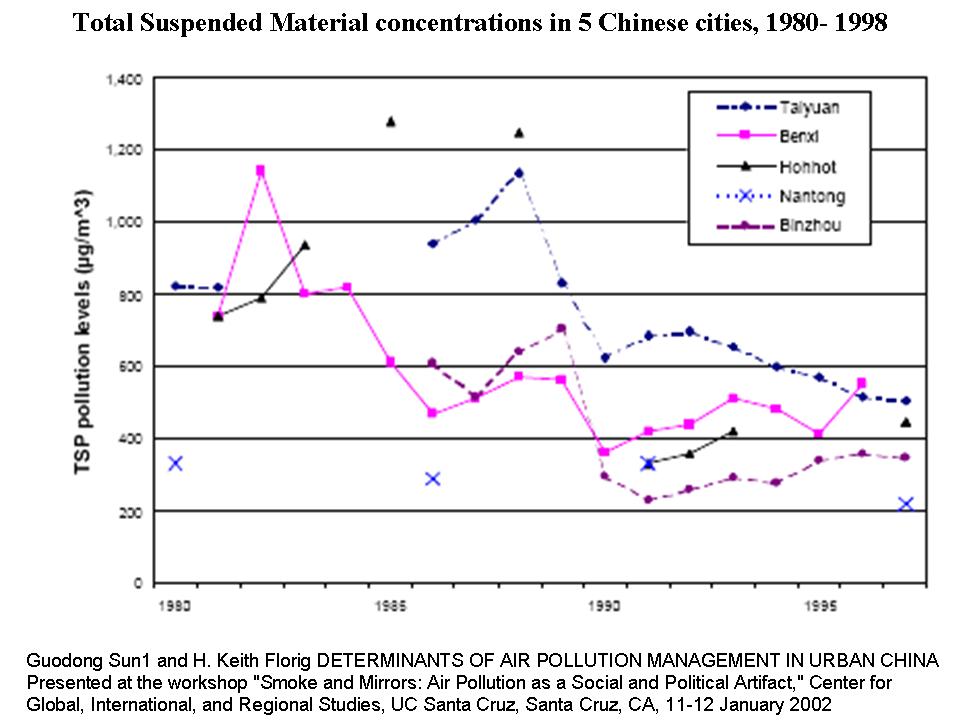
Total Suspended Material (TSP) is the mass of all particles in air (Atmospheric composition and structure), as typically measured by samplers which measure particles less than about 25-50 micrometers in size. The other term used for particles suspended in air is aerosols.
Figure 1 indicates two things:
- Recent concentrations of TSP are quite high if compared with present concentrations found in US or European cities, see e.g. the CAFE Report (6).
- TSP concentrations in China are going down rather rapidly due to abatement measures taken since 1985
Of course the status as an underdeveloped nation and the reliance on cheap but often sulfur-rich coal were severe handicaps in the handling of air pollution (Air pollution emissions) in the period 1980-1990 and are still a problem in the less developed parts of China.
Furthermore, the very large population (Human population explosion) of China, an estimated 1,340,000,000, compared to the US (300,000,000) or the EU (about 490,000,000 including recent extensions) means that the same emission per head in China will lead to respectively 4.5 or 3 times the emission from the US or Europe.
Sources of Air Pollution in China
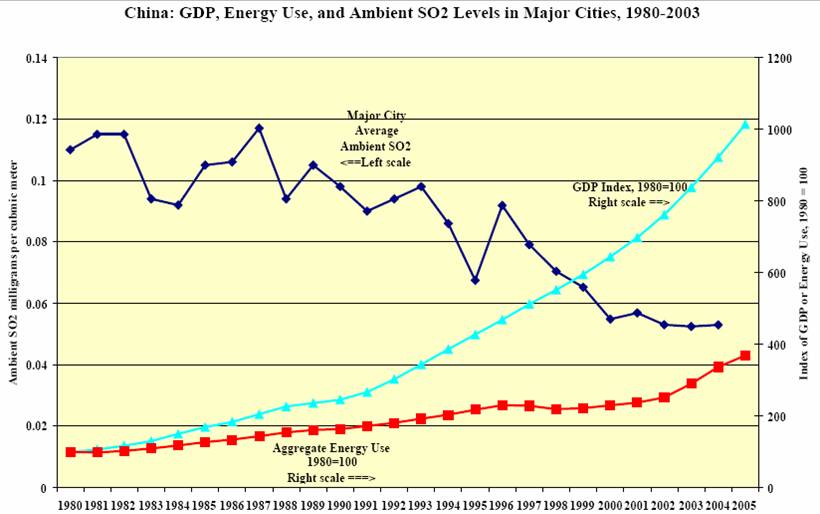
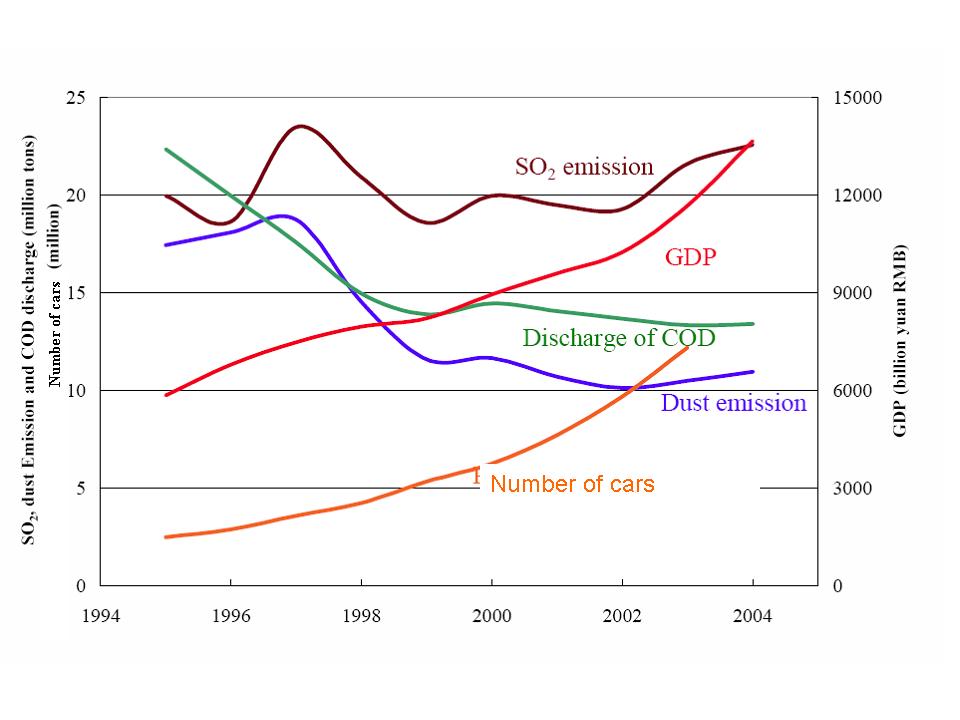
In the early stages of Chinese economic development, the use of coal and inefficient boilers, etc., were responsible for high concentrations of particulate matter and sulfur dioxide in the air. In Figure 2 and 4 the development of the Gross Domestic Product, energy use and the average sulfur dioxide concentrations over the last 20 years is given (references 4, 5, 7)
Most of the fossil fuel used was coal (initially more than 80% of total energy supply, nowadays reduced to about 70%, see ref. 5). It should be noted that the maximum concentrations of sulfur dioxide in cities like Guiyang could be 3 to 4 times higher than the average given here.
The concentration of particulate matter is shown in Figure 1.
The use of cleaner coal and the introduction of more efficient equipment (small-scale boilers, as used in the early stages of Chinese industrial development, had high emissions), reduced the emissions and correspondingly the sulfur dioxide concentrations even though the total use of fossil fuels was increasing.
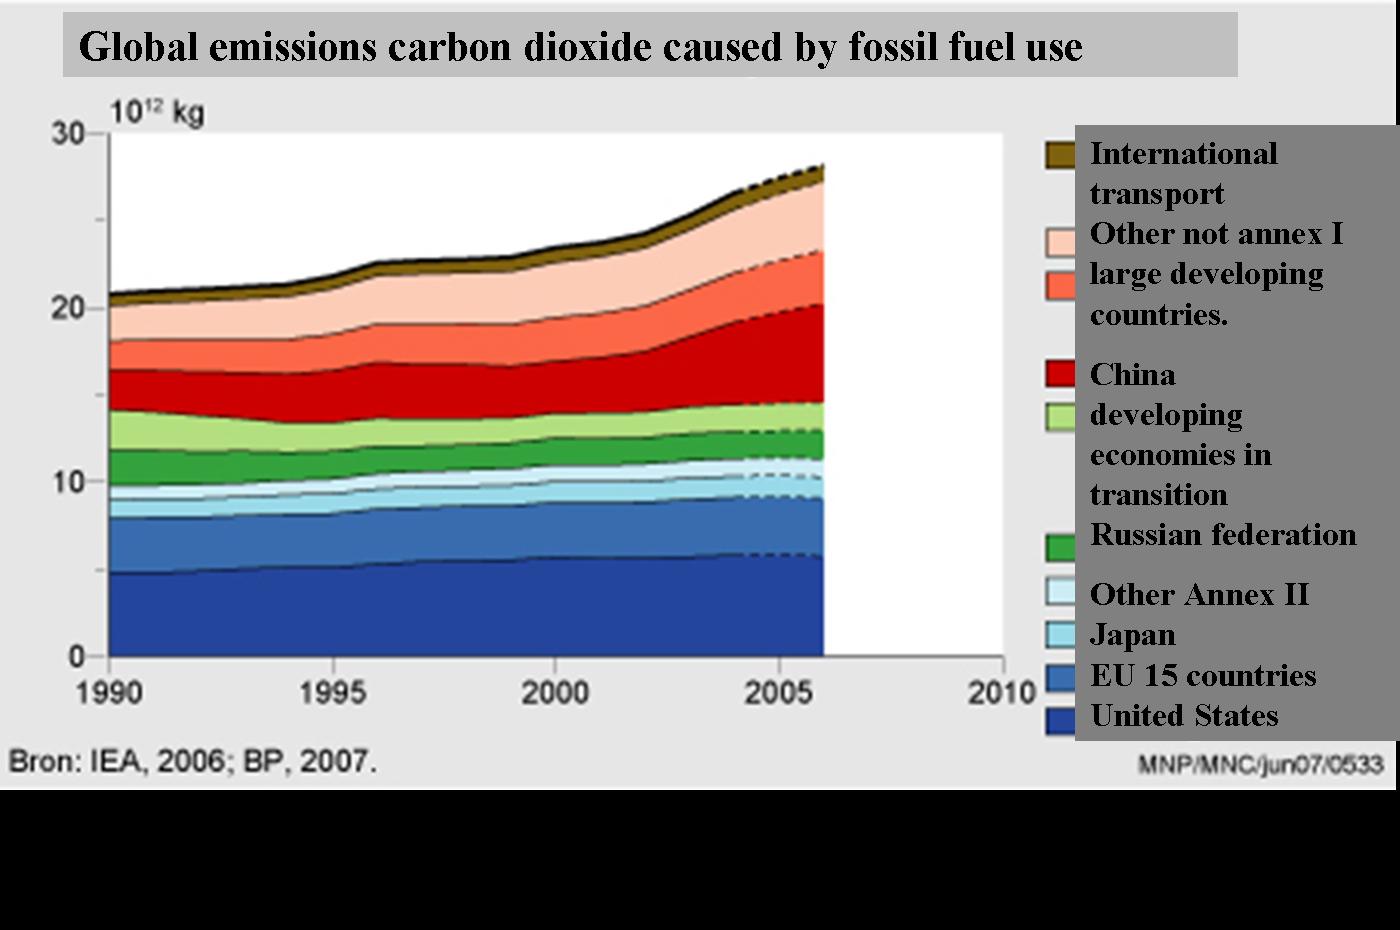
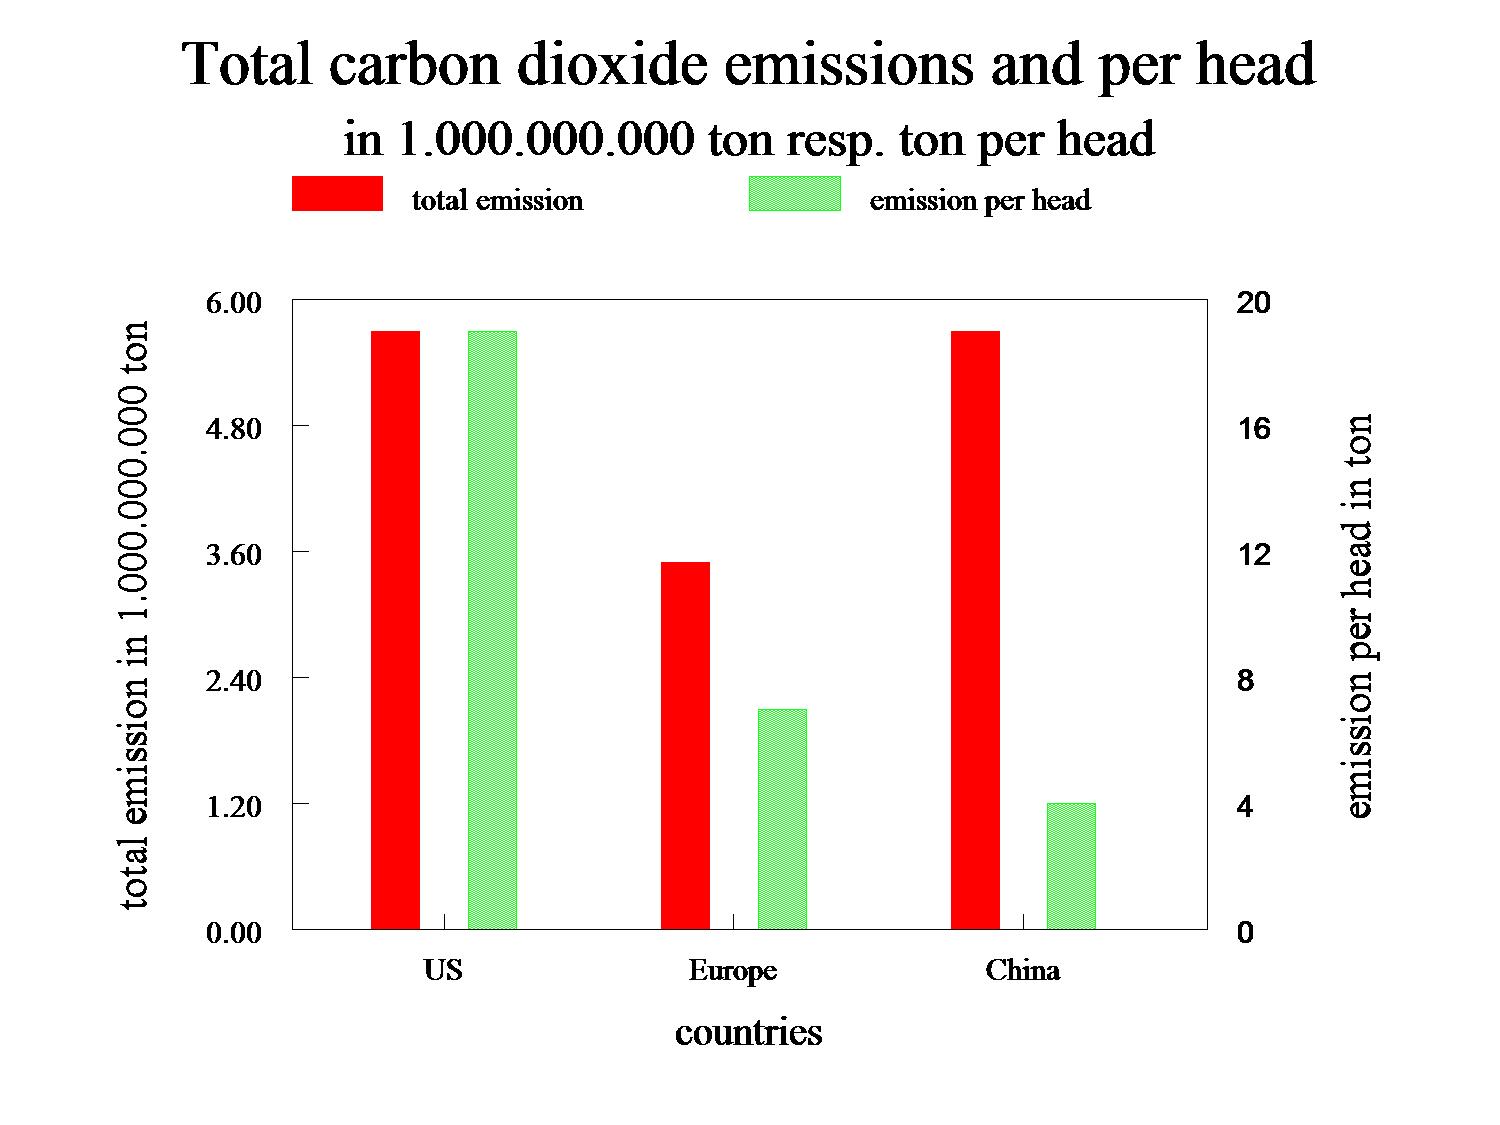
The use of coal also contributes to a large extent to the high carbon dioxide emissions in China. The estimate of NMP (ref. 3) of the relative contributions of different countries and regions shows that China and the US are the largest emitters of CO2 (see Figure 3).
In the period of 1994 to 2004 the number of cars increased enormously, roughly a factor 10, see Figure 4 (ref. 7).
This increased number of cars but also the increased use of fossil fuels, especially in the Eastern part of China, has caused high emissions of nitrogen oxides.
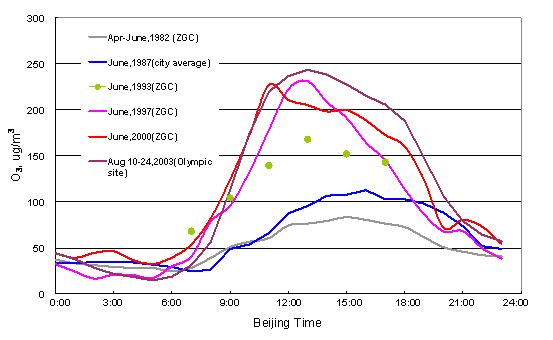
Nitrogen oxide reacts with organic compounds in ambient air to form ozone. So in the period after 1990, increasing ozone concentrations were observed in and around Chinese cities (see Figure 5, ref. 7). Recent observations seem to indicate that ozone concentrations are leveling off in Beijing.
Effects of Air Pollution in China
The levels of air pollution (Air pollution emissions) in China are clearly higher than observed in, e.g., the US or Western Europe.
Parts of China, especially where the soil does not contain high concentrations of calcium carbonate, a natural, neutralizing chemical, are affected by acid deposition. The present ozone concentrations in many Mega-cities in China can be compared with concentrations found in, e.g., Southern Europe and will be harmful for ecosystems and reduce the agricultural yield of sensitive crops. Estimates of the losses of crops due to air pollution in China vary but the loss due to acid rain could be 2% or higher and can reach levels of 10 to 20% in some provinces (ref. 8). The ozone damage is quite uncertain but total losses of 5% or more can be expected.
Particulate matter, especially the smaller particles, has harmful effects on human health. Estimates of deaths due to respiratory and heart diseases caused by air pollution (Air pollution emissions) in China vary between 200,000 and 600,000 per year (ref. 9).
Ozone at this level is also harmful to human health. The effects are probably comparable to those calculated for Southern Europe in a recent report (CAFÉ, Clean Air for Europe), which concluded that 30 to 50% of the forests in Southern Europe would be exposed to too high ozone concentrations, and that the impact on health would be considerable though less than the impact of particulates (ref. 6).
The consequences of climatic change due to the emissions of [[greenhouse gas]es] could be quite severe for China. A number of climate models indicate that in the next 50 years rainfall in the North-East, already a dry region, would be less, while in the South, where flood control already is a problem, it would increase (ref. 10).
Comparison with the air pollution elsewhere in the past
The state of air pollution (Air pollution emissions) in China is clearly serious and a matter of great concern. But if a comparison is made with air pollution levels as previously encountered in Europe, US and Japan for instance, it becomes clear that many cities were exposed to the same or higher levels of air pollution not so long ago.
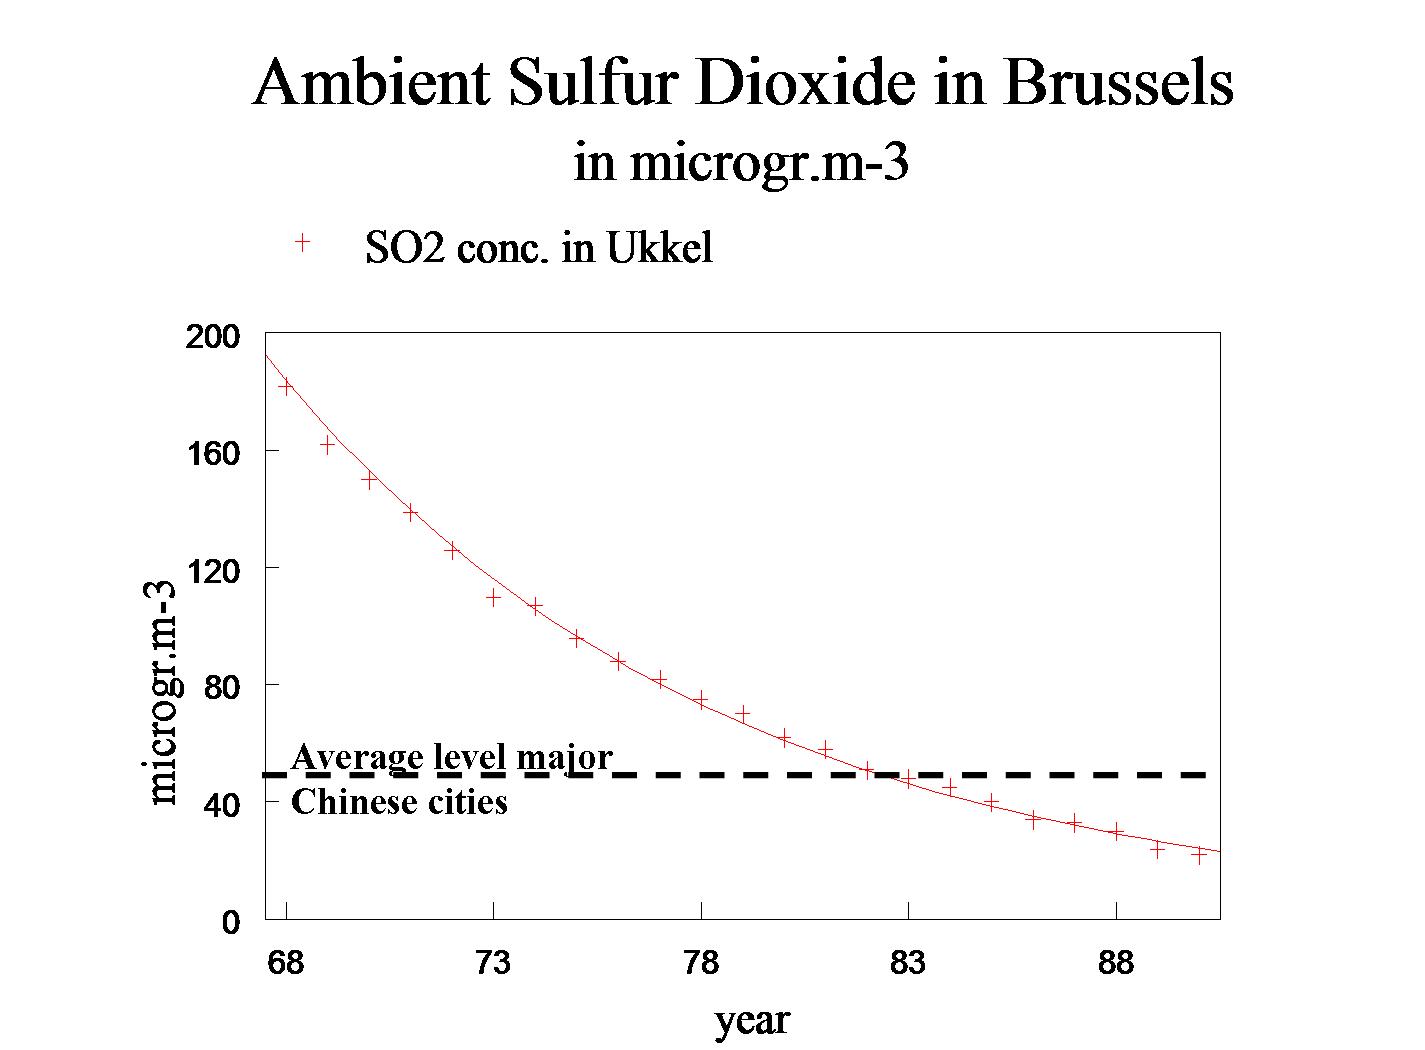
Figure 6 shows that the sulfur dioxide concentrations in the city of Brussels, Belgium, around the year 1970 were at the same levels as the high concentrations during the 1980s in China.
The present average level of sulfur dioxide in Chinese cities corresponds with levels found in Brussels, and other European cities, in the eighties.
The same situation is encountered in the case of TSP: The average concentrations of TSP in 2003 of about 150 to 250 ?g.m-3 (see Figure 7) (ref. 4) in major Chinese cities are comparable with values found in Dutch inner cities around 1980.
Comparison with other Asian cities, according to Thomas G. Rawski (ref. 4), shows that TSP levels in Chinese cities are not yet at the same level as, e.g., Seoul and Tokyo, but can be compared with the situation in the eighties of Seoul.
Ozone concentrations in Chinese cities were low compared to the US and Europe until 1990 but have increased quite rapidly since then due to increased emissions from automobile traffic and the use of fossil fuels in electricity generation and industry (ref. 7). Recent measurements seem to indicate that ozone concentrations have been going down in the last years, but as research on ozone is comparatively new in China, this trend is not yet securely established.
So in comparison with other cities in the past, it seems that air pollution (Air pollution emissions) in China is quite serious,but is in the same order as observed in European or US cities in the period 1970-1980.
Regarding carbon dioxide emissions, Figure 3, the history of carbon dioxide emissions per country, shows that the carbon dioxide emissions have not increased at the same rate as the GDP. So energy efficiency has gone up considerably. If emissions per head of the population are evaluated, rather than total emissions, (one cannot penalize a country for having more inhabitants) then the situation is different; per head, the emissions of China are about half of the EU and 20% of the US (see Figure 8, ref. 10).
Evaluation of the Air Pollution Situation in China
Present sulfur dioxide concentrations in, e.g., Beijing, in the summer are generally quite low and comparable to those found in Western Europe, indicating that China has achieved quite a lot of progress here.
The situation is different for particulate matter and ozone. The reduction of particulate matter concentrations has been considerable, but present levels are still harmful. One can look at this situation in terms of a half full and a half empty glass: Particulate matter pollution can be described as too high but going down at a relative fast rate or as still too high and dangerous especially in view of economic development and increasing fossil fuel use.
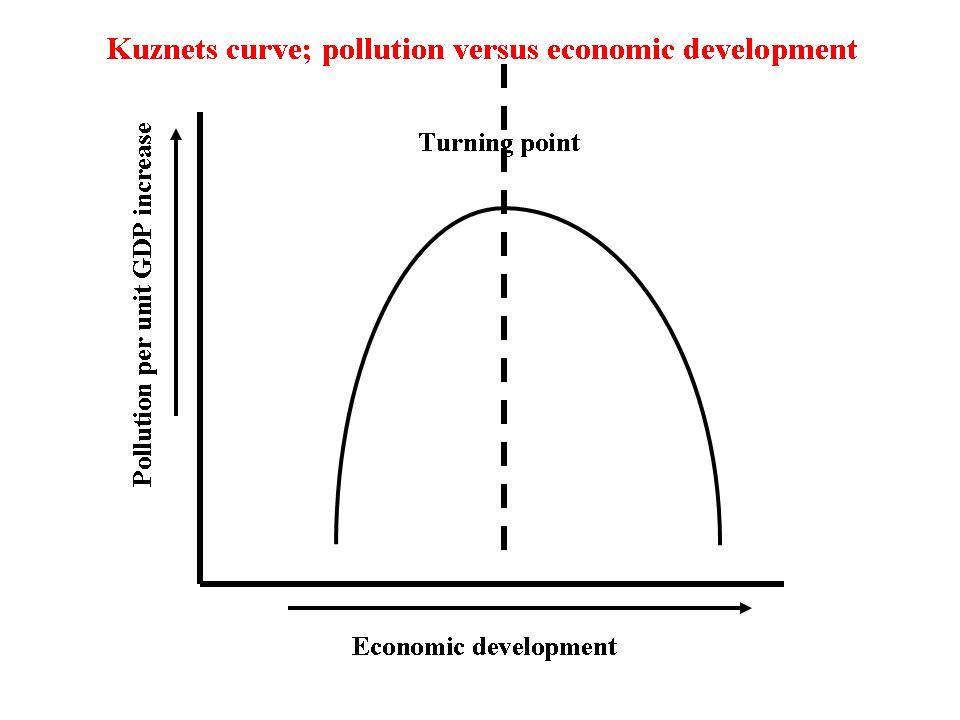
In general, pollution in developing countries follows a kind of Kuznets curve (see Figure 9).
As long as economic development is in an early stage, the emphasis is on economic growth and little means are available to finance pollution abatement measures. In a later stage measures can be implemented and pollution growth lags behind economic development. It seems that Asian countries and China in particular are reaching this turning point rather fast, compared with US and EU developments. Economic development in Europe really speeded up after 1955, effective pollution abatement measures were taken after 1980, so the turning point came after about 25 years (ref. 11). China's development accelerated enormously after 1992 and large scale measures (introduction of e.g. strong car emission reductions) were in place in 1995, so the turning point was reached in half the period, needed in Europe. This gives hope for the future.
As said before, ozone research is in a relatively fledgling state in China and more data are needed to see whether a downward trend has started or not.
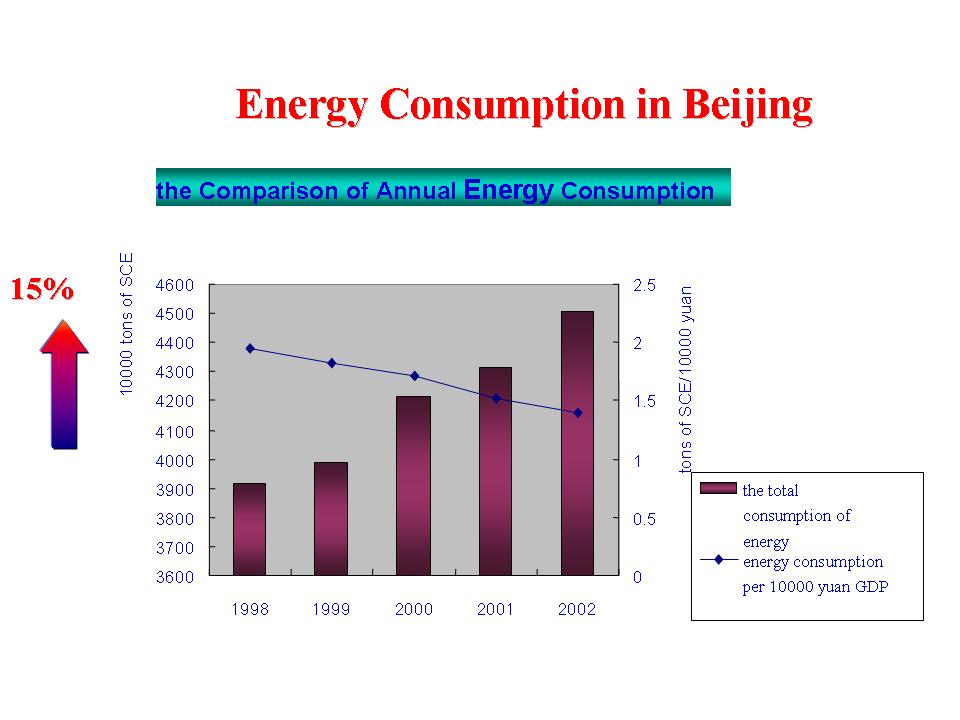
The energy consumption per unit of GDP in China is high, about 8 to 10 times greater than that of Japan or Germany (two countries with rather efficient energy use), but the situation is getting better (see Figure 10, ref.12). While the energy use in Beijing has increased about 15% between 1998 and 2002, the fuel consumption per 10,000 yuan has gone down in the order of 25%. While this a good sign, it is also clear that a lot has to be done before a more sustainable situation is reached.
To summarize, China is on the move towards better pollution conditions, but a Long March is needed before the goals are attained.
References
- See World Bank report (2000): Beyond Economic Growth
- The Blacksmith Institute report (2007): The Top Ten of the Dirty Thirty
- Netherlands Environmental Agency (NMP) et al., Milieu en Natuur compendium (MNP) (2007)
- Thomas G. Rawski, Urban air quality in China: Historical and comparative perspectives, lecture
- China Statistical Yearbook 2006
- The CAFE´ (Clean Air For Europe) report (2005) The communication on thematic strategy on air pollution and the directive on ‘‘Ambient Air Quality and Cleaner Air for Europe Impact Assessment” {COM(2005)446 final}
- Shao, M., X. Tang, Y. Zhang and W. Li (2006). City clusters in China: air and surface water pollution. Frontiers in Ecology and the Environment, 4(7): 353-61
- China State Environmental Protection Agency, World Bank report (2007), Cost of Pollution in China; Economic Estimates of Physical Damages
- HEI International Scientific Oversight Committee. (2004). Health Effects of Outdoor Air Pollution in Developing Countries of Asia: A Literature Review. Special Report 15. Health Effects Institute, Boston MA.
- IPCC (2007) Climate Change 2007: The Physical Science Basis. Summary for Policymakers. Contribution of Working Group I to the Fourth Assessment Report of the Intergovernmental Panel on Climate Change
- EMEP (2000) Transboundary acidification and eutrophication in Europe, Summary Report ccc & msc-w.
- Yuanhang Zhang, lecture, based on reference 5.
Further Reading
- Chan, C.K., Yao, X., 2008. Air pollution in mega cities in China—a review. Atmospheric Environment 42 (1), 1–42
- J. Slanina (2006), REVIEW PAPER Air pollution: the emission–effect relation, Rev Environ Sci Biotechnol. DOI 10.1007/s11157-006-0017-9
- Thomas G. Rawski, Urban air quality in China: Historical and comparative perspectives, lecture
- The CAFE´ (Clean Air For Europe) report (2005) The communication on thematic strategy on air pollution and the directive on ‘‘Ambient Air Quality and Cleaner Air for Europe Impact Assessment” {COM(2005)446 final}