Scenarios of projected changes in the four ACIA regions for 2020, 2050, and 2080
This is Section 7.6 of the Arctic Climate Impact Assessment
Lead Author: Terry V. Callaghan; Contributing Authors: Lars Olof Björn, F. Stuart Chapin III,Yuri Chernov,Torben R. Christensen, Brian Huntley, Rolf Ims, Margareta Johansson, Dyanna Jolly Riedlinger, Sven Jonasson, Nadya Matveyeva,Walter Oechel, Nicolai Panikov, Gus Shaver; Consulting Authors: Josef Elster, Heikki Henttonen, Ingibjörg S. Jónsdóttir, Kari Laine, Sibyll Schaphoff, Stephen Sitch, Erja Taulavuori, Kari Taulavuori, Christoph Zöckler
This synthesis draws on information in this article that can be assessed within the four Arctic Climate Impact Assessment (ACIA) regions. Most of the information is therefore based on model output. Details of the regions and the logic determining them are presented in Section 18.3 (Scenarios of projected changes in the four ACIA regions for 2020, 2050, and 2080) of the ACIA Report, while details of the models that generate the UV-B radiation and climate scenarios are presented in Sections 5.6 and 4.2.7 (Scenarios of projected changes in the four ACIA regions for 2020, 2050, and 2080), respectively. Many of the details relating to vegetation and carbon (C) dynamics are derived specifically for this section from the LPJ model[1]2003), details of which are presented in Box 7.1. Other aspects of the assessment that cannot currently be divided into the ACIA regions are summarized within and at the end of the various sections of this article.
Contents
Environmental characteristics (7.6.1)
The four ACIA regions ([[Section 18.3 (Scenarios of projected changes in the four ACIA regions for 2020, 2050, and 2080)]2]) differ greatly in their geography and climatology, which leads to variation in future possibilities for the relocation of species and ecosystems, and differences in scenarios of future changes in climate and UV-B radiation levels (Table 7.14).
Geographically, Region 4 has a far greater extent of land at high latitudes compared with the other regions. This is likely to support northward migration of arctic biota even if the Canadian Archipelago and the glacial landscape of Greenland together with lack of suitable soils will, to some extent, pose barriers to migration. Relatively narrow tundra zones in some parts of Regions 1 and 3 could possibly, with sea-level rise and northward boreal forest expansion, disappear and forest reach the shore of the Arctic Ocean (Fig. 7.32). Region 1 contains the relatively isolated high-arctic islands of Svalbard, and the islands of Iceland and the Faroe Islands, that are likely to experience delayed immigration of southern species during warming. Both Iceland and the Faroe Islands have equivocal positions within classifications of the Arctic: the northern part of Iceland and the alpine zones of the Faroe Islands[2] have the strongest arctic characteristics and climate warming is likely to lead to altitudinal displacement of tundra-like vegetation in both areas, and displacement from the northern coastal area in Iceland. The imbalance of species loss and replacement by species migrating more slowly to islands is projected to lead to an initial loss in diversity (Species diversity)[3].
The scenarios of temperature change generated by the five ACIA-designated models show complex temporal patterns, in some areas shifting from initial cooling to substantial warming. The data used for the modeling of vegetation zone displacement and carbon storage used a different baseline period (1961–1990) than that used for the ACIA-designated model projections (1981–2000) and excluded output from the CSM_1.4 model. In addition, the output from the LPJ model is provided for 2100, rather than the 2071–2090 time slice used in the ACIA scenarios (Section 7.5 (Scenarios of projected changes in the four ACIA regions for 2020, 2050, and 2080)). It is therefore difficult to compare the results, even though both approaches had four GCMs in common and used the same emissions scenario.
Changes in UV-B radiation levels are projected to vary among regions, but only over the next 20 years. By 2050, recovery of the stratospheric ozone layer is projected to reduce UV-B radiation to relatively low levels above present-day levels, with no differences among the ACIA regions. Of course, this recovery depends entirely on the success of management and regulation of ozone-depleting substances. In the near future, however, increases in UV-B radiation levels are projected to be greatest in Region 4, followed by Regions 1 and 2[4].
Active-layer thickness is projected to increase by 20 to 60% by 2071–2100 (compared to the IPCC baseline, 1961–1990). The greatest percentage increases are projected to occur in northern Siberia and the interior of the Alaska–Yukon area. In general, the greatest relative changes in the active layer are projected to occur in those regions where the active layer is presently shallow (Section 6.6.1.3 (Scenarios of projected changes in the four ACIA regions for 2020, 2050, and 2080)). Degradation of continuous permafrost to discontinuous permafrost and the disappearance of discontinuous permafrost are projected to occur at the southern boundaries of all of the ACIA regions.
Vegetation zones and carbon balance (7.6.2)
Region 1 (Arctic Europe, East Greenland, European Russian North, and North Atlantic) includes many high-arctic areas but these are separated from terrestrial ecosystems at lower latitudes by barriers of open sea. The possibilities for future species relocation are limited, even though moderate warming is projected here (Table 7.14). In contrast, Region 2 (Central Siberia) has continuous landmasses from the tropics to the high Arctic. This region is currently warming, and scenarios project that future warming will be greater here than elsewhere. The possibilities for responses in ecosystem distribution, structure, and C balance are therefore considerable. This is illustrated by large projected increases in taiga that displaces tundra in particular, and also in projected decreases in polar desert that is displaced to some extent by northward movement of the tundra (Table 7.14). There is also a projected northward displacement and reduction in prostrate dwarf-shrub tundra, particularly in Yakutsia and the Taymir Peninsula, together with a displacement of erect dwarf-shrub tundra from much of the Russian Arctic by low- and high-shrub tundra that is projected to expand markedly there (Figs. 7.2 and 7.32). Region 3 (Chukotka, Bering Sea, Alaska, and the western Canadian Arctic) has little high-arctic area and a large maritime influence. Increases in temperature and precipitation are projected to be moderate, as are changes in vegetation (Table 7.14). Region 4 (Northeast Canada, Labrador Sea, Davis Strait, and West Greenland) is a region of fragmented landmasses that are often extensively glaciated or have recently become deglaciated. This area has experienced recent cooling, but a warming trend is projected to occur between now and 2100. Increases in temperature and precipitation are projected to lead to relatively small increases in taiga (compared with other regions) but a particularly large (~36%) loss of polar desert by 2080.
In terms of C storage, all regions are projected to accumulate C, largely because of the replacement of bare ground by tundra. Consequently, the greatest carbon gain is projected to occur in Region 4 (Table 7.14; Fig. 7.33). In contrast, the smallest gains – but still gains – are projected to occur in Region 1, which has the smallest projected increase in temperature.
Biodiversity (7.6.3)
Biodiversity is affected by habitat fragmentation. Scenarios of the impacts of projected human infrastructure development on arctic flora and fauna suggest that in the Arctic, these impacts are likely to extend for 4 to 10 kilometers (km) away from the infrastructure[5]. This is a much wider zone of influence than in other regions of the earth. Nellemann et al.[6] calculated that 50 to 80% of the Arctic is likely to be affected by infrastructure development by 2050. Of course, infrastructure development varies among the ACIA regions and this remains to be characterized. However, threats to flora and fauna are likely to be increased by the additive or possibly interactive effects of infrastructure development and climate change.
The number of rare endemic vascular plant species in the Arctic varies greatly between the regions (Table 7.14). Region 1 has relatively little land mass and supports only two of the rare endemic vascular plant species. Region 4, which encompasses a significant proportion of the high Arctic, contains 8% of the species and Region 2 contains 18%. In contrast, over 70% of the rare endemic vascular plant species are found in Beringia (Region 3). Twenty-four species are found on Wrangel Island[7]. A recent modification[8] of the list of threatened arctic plant species[9] adds a further 63 plant species, but data have not yet been compiled on their distributions within the ACIA regions. Although Table 7.14 shows clear regional differences in the distribution of rare and endemic plant species, and also a surprisingly high number of these species, it should be noted that the taxonomic treatment of species is likely to vary from region to region and there is uncertainty about the taxonomic status of some of the species.
It is not clear to what extent the rarity of the species listed in Tables 7.7 and 7.14 will be affected by climate change, as many other factors determine rarity. However, species concentrated in small areas such as Wrangel Island are particularly at risk from any future climate warming and species invasion.
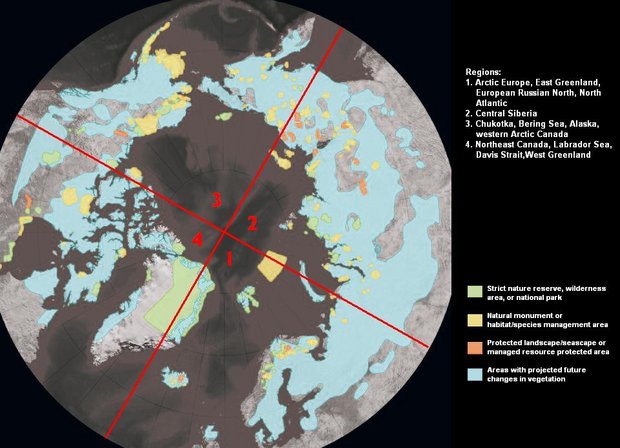
The likely impacts of climate change on biodiversity in terms of threatened species require new concepts of "threatened species" and "protection" of currently perceived threatened species (Fig. 7.34; Chapter 11 (Scenarios of projected changes in the four ACIA regions for 2020, 2050, and 2080)). The numbers of species currently perceived as threatened vary between regions. Region 3 contains significantly more rare plant species and threatened animal and plant species than other regions. Although temperature and precipitation changes are likely to be less in this region than in others, the vulnerability of the biodiversity of this area is likely to be considerable. Northward expansion of dwarf-shrub and tree-dominated vegetation into an area such as Wrangel Island that is rich in rare endemic species could possibly result in the loss of many plant species. Although some of these might not be considered vulnerable because they are currently in "protected" areas, this protection is against local human activities (e.g., hunting, infrastructure development, etc.) and protection cannot extend to changes in climate and UV-B radiation levels. It is possible that some plant species, particularly outliers of more southerly distributions, might experience population expansion or reproduction and recruitment to populations, leading to initial expansion in response to warming. However, displacement of herbaceous species by woody immigrants is possible in the long term in mesic areas. In contrast to the possibility that some threatened species will proliferate in a warmer climate, some currently widespread species are very likely to become less abundant and even "threatened".
The greatest long-term threat to arctic diversity (Species diversity) is the loss of arctic habitat (Section 7.2.6 (Scenarios of projected changes in the four ACIA regions for 2020, 2050, and 2080)). In locations where the tundra zone is narrow, boreal forest moves northward, and the ocean moves southward due to sea-level rise, there is very likely to be, over a period of centuries, a loss of arctic ecosystems and the species that characterize them.
Chapter 7: Arctic Tundra and Polar Desert Ecosystems
7.1 Introduction (Scenarios of projected changes in the four ACIA regions for 2020, 2050, and 2080)
7.2 Late-Quaternary changes in arctic terrestrial ecosystems, climate, and ultraviolet radiation levels
7.3 Species responses to changes in climate and ultraviolet-B radiation in the Arctic
7.3.1 Implications of current species distributions for future biotic change
7.3.2 General characteristics of arctic species and their adaptations in the context of changes in climate and ultraviolet-B radiation levels
7.3.3 Phenotypic responses of arctic species to changes in climate and ultraviolet-B radiation
7.3.4 Genetic responses of arctic species to changes in climate and ultraviolet-B radiation levels
7.3.5 Recent and projected changes in arctic species distributions and potential ranges
7.4 Effects of changes in climate and UV radiation levels on structure and function of arctic ecosystems in the short and long term
7.4.1 Ecosystem structure
7.4.2 Ecosystem function
7.5 Effects of climate change on landscape and regional processes and feedbacks to the climate system
7.6 Synthesis: Scenarios of projected changes in the four ACIA regions for 2020, 2050, and 2080
7.7 Uncertainties and recommendations
References
Citation
Committee, I. (2012). Scenarios of projected changes in the four ACIA regions for 2020, 2050, and 2080. Retrieved from http://editors.eol.org/eoearth/wiki/Scenarios_of_projected_changes_in_the_four_ACIA_regions_for_2020,_2050,_and_2080- ↑ Sitch, S., B. Smith, I.C. Prentice, A. Arneth, A. Bondeau, W. Cramer, J.O. Kaplan, S. Levis, W. Lucht, M.T. Sykes, K. Thonicke and S. Venevsky, 2003. Evaluation of ecosystem dynamics, plant geography and terrestrial carbon cycling in the LPJ dynamic global vegetation model. Global Change Biology, 9:161–185.
- ↑ Fossa, A.M., 2003. Mountain vegetation in the Faroe Islands in a climate change perspective. Ph.D Thesis, University of Lund, 119pp.
- ↑ Heide-Jørgensen, H.S. and I. Johnsen, 1998. Ecosystem vulnerability to climate change in Greenland and the Faroe Islands. Miljønyt, 33:1–266.
- ↑ Taalas, P., J. Kaurola, A. Kylling, D. Shindell, R. Sausen, M. Dameris, V. Grewe, J. Herman, J. Damski and B. Steil, 2000. The impact of greenhouse gases and halogenated species on future solar UV radiation doses. Geophysical Research Letters, 27(8):1127–1130.
- ↑ Nellemann, C., L. Kullerud, I. Vistnes, B.C. Forbes, E. Husby, G.P. Kofinas, B.P. Kaltenborn, J. Rouaud, M. Magomedova, R. Bobiwash, C. Lambrechts, P.J. Schei, S. Tveitdal, O. Gron and T.S. Larsen, 2001. GLOBIO. Global Methodology for Mapping Human Impacts on the Biosphere. UNEP/DEWA/TR.01-3. United Nations Environment Programme, 47pp.
- ↑ Nellemann, C., L. Kullerud, I. Vistnes, B.C. Forbes, E. Husby, G.P. Kofinas, B.P. Kaltenborn, J. Rouaud, M. Magomedova, R. Bobiwash, C. Lambrechts, P.J. Schei, S. Tveitdal, O. Gron and T.S. Larsen, 2001. GLOBIO. Global Methodology for Mapping Human Impacts on the Biosphere. UNEP/DEWA/TR.01-3. United Nations Environment Programme, 47pp.
- ↑ Talbot, S.S., B.A. Yurtsev, D.F. Murray, G.W. Argus, C. Bay and A. Elvebakk, 1999.Atlas of Rare Endemic Vascular Plants of the Arctic. CAFF Technical Report 3. Conservation of Arctic Flora and Fauna. 73pp.
- ↑ Talbot, S.S. and D.F. Murray (eds.), 2001. Proceedings of the First International Conservation of Arctic Flora and Fauna (CAFF) Flora Group Workshop. CAFF Technical Report 10. 65pp.
- ↑ Talbot, S.S., B.A. Yurtsev, D.F. Murray, G.W. Argus, C. Bay and A. Elvebakk, 1999.Atlas of Rare Endemic Vascular Plants of the Arctic. CAFF Technical Report 3. Conservation of Arctic Flora and Fauna. 73pp.
- ↑ CAFF, 2001. Arctic Flora and Fauna: Status and Conservation. Conservation of Arctic Flora and Fauna, Edita, Helsinki, 272pp.
- ↑ Kaplan, J.O., N.H. Bigelow, I.C. Prentice, S.P. Harrison, P.J. Bartlein, T.R. Christensen, W. Cramer, N.V. Matveyeva, A.D. McGuire, D.F. Murray, V.Y. Razzhivin, B. Smith, D.A. Walker, P.M. Anderson, A.A. Andreev, L.B. Brubaker, M.E. Edwards and A.V. Lozhkin, 2003. Climate change and Arctic ecosystems: 2. Modeling, paleodata-model comparisons, and future projections. Journal of Geophysical Research, 108(D19):8171, doi:10.1029/2002JD002559.