Climate Solutions: Chapter 2
Contents
Objectivity in Science: A Case Example
In 2003 Michael Mann and Philip Jones examined temperatures for the past 2,000 years in a research paper that brought together many prior temperature records. The 2003 Mann and Jones study gathered temperature data for 13 different regions based on more than 23 different proxy records. In other words, they wanted to know whether all these different data sets revealed the same underlying trends. They concluded the best available data did indicate the globe’s average surface temperature has been getting higher in the past 2,000 years. But the excellent Mann and Jones compilation is a smaller-scale model of the work of the IPCC’s Climate Change 2007 authors, who examined thousands of data records from all over the globe from a much larger time frame.
The resulting short paper (only 4 pages!) by Michael Mann and Philip Jones is titled “Global surface temperatures over the past two millennia” and opens with this paragraph:
We present reconstructions of Northern and Southern Hemisphere mean surface temperature over the past two millennia based on high-resolution "proxy" temperature data which retain millennial-scale variability. These reconstructions indicate that late 20th century warmth is unprecedented for at least roughly the past two millennia for the [Hemisphere]. Conclusions for the Southern Hemisphere and global mean temperature are limited by the sparseness of available proxy data in the Southern Hemisphere at present.* [8]
The first key phrase is “mean surface temperature,” which, in the precise language of science, translates into the average temperature at the Earth’s surface.
Next, “high-resolution ‘proxy’ temperature data” is a fancy way of saying that where direct written temperature records do not exist, Mann and Jones used stand-ins that could capture small changes in surface temperature. Two millennia ago, Roman and Chinese bureaucrats did record weather and temperature, especially as it assisted in planning agriculture, maritime navigation, or even military campaigns. But even if those human written records had survived to this day, the standards of measurement and instruments varied widely, even within the same empire. We’d have a hard time calibrating them to the modern thermometer scale devised by Mr. Anders Celsius. However, mollusk shells in the Chesapeake Bay record the accurate temperature of the water around them before they lock that reading in when they fossilize. This shell record is read by analyzing the exact chemical makeup of the shells, for example, how much calcium and Magnesium they contain, and is available going all the way back to 200 BC. The rings of ancient fossil trees in Mongolia depict annual temperatures accurately back to AD 264. Ice cores, lake sediment, and tree rings in eastern Asia are available back to AD 1. Ultra-long-lived trees of western North America yield ring temperature data back to AD 200. And so on.
The next phrase, “retain millennial-scale variability,” is important as well. It means that these records have the capacity to stay accurate over a long time, 1,000 years at minimum in this case.
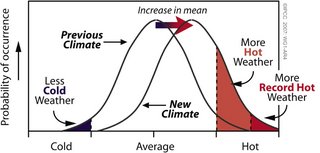
By comparing these multiple sources, researchers can painstakingly reconstruct the likely average annual temperatures for large areas of the globe. In this case, there are enough parallel and overlapping records from sites in the northern hemisphere to determine that “late 20th century warmth is unprecedented for at least roughly the past two millennia for the [Hemisphere].” The same survey for natural records in the southern hemisphere turns up fewer indicators. The southern hemisphere contains far less land surface area on which trees can accumulate rings, bays their shell beds, or lakes their sediment. The existing natural records in the southern hemisphere point in the same temperature direction as those in the northern hemisphere but are simply fewer in number.
This 2003 study by Mann and Jones is based on assimilating the studies of many other individual climate records as verified by a committee of the US National Academy of Sciences. These studies, in turn, are based on just as rigorous a set of hurdles for the quality and reliability of the data that are included in the research. In fact, Mann and Jones rejected one study they felt was flawed and did not meet their more rigorous standards for reliability. They concluded that their reconstructions support previous conclusions “with regard to the anomalous nature of the late 20th century temperature.” We can detect a prior era of moderately warmer conditions between about AD 800 and 1400 in Figure 2.1. But Mann and Jones write, “Any [northern] hemispheric warmth during that interval is dwarfed by the magnitude of the 20th century warmth.” [8]
_13252-7%2c_Fig._1.jpg)
Is the science objective? Yes, science is a continually self-correcting process. Mann and Jones performed separate analyses of eight regional temperature records for the northern hemisphere and five for the southern hemisphere. There were fewer reliable temperature records for the southern hemisphere. Some of the southern hemisphere measures showed a lower correlation with verification measures that were entirely independent of the northern hemisphere. Therefore, being cautious as good scientists, Mann and Jones concluded that their study supports the previous conclusions about the rise in late 20th century temperatures in the northern hemisphere but that the “sparseness of available proxy data in the Southern Hemisphere lead to less definitive conclusions for [it] or global mean temperature at present.” They included the available, accurate southern hemisphere proxy data trends because they wanted to include both hemispheres to compile a picture of global surface temperatures, even though “previous work has emphasized the [Hemisphere] and the past 1000 years for which adequate proxy data have been available.” Should more temperature indicators be uncovered for the southern hemisphere, the study can be done over again to incorporate this fuller set of data. This openness to replication is why we say science is a self-correcting process.
_13252-7%2c_Fig._3.jpg)
Coda: Five years after the study we examined above, Professor Mann went back to this question, how to reconstruct proxy-based temperature variations over the past two millennia. In a six-page paper published in 2008, Mann and his collaborators reported their results after examining 1,209 sets of proxies for temperature. In other words, in just the intervening years since 2003, researchers had discovered hundreds of new proxy indicators or built reliable models for analyzing these additional natural record keepers. At least 25 of the proxies showed temperature records all the way back to 1 BC—a full 2,000 years ago. What did having 50 times more data show Mann and his colleagues?
We find that the hemispheric-scale warmth of the past decade for the Hemisphere is likely anomalous in the context of not just the past 1,000 years, as suggested in previous work, but longer…. Conclusions are less definitive for the Hemisphere (SH) and globe, which we attribute to larger uncertainties arising from the sparser available proxy data in the SH. Given the uncertainties, the SH and global reconstructions are compatible with the possibility of warmth similar to the most recent decade during brief intervals of the past 1,500 years. [9]
This is research talk for “all the data show that the warming of the northern hemisphere during the past 1,000 years is real and unusual” and “we have much less data for the southern hemisphere, but it points in this same warming direction as we are experiencing now.”
- Mann ME, Jones PD (2003) Global surface temperatures over the past two millennia. Geophysical Research Letters 30(15): 1820, doi:10.1029/2003GL017814.
Bibliography
- Carpenter KE, et al. (2008) One third of reef-building corals face elevated extinction risk from climate change and local impacts. Science 321 (5888): 560-563. www.sciencemag.org
- Confalonieri U, Menne B, Akhtar R, Ebi KL, Hauengui M, Kovats RS, Revich B, Woodward A (2007) Human Health (in Climate Change 2007: Impacts, Adaptation and Vulnerability. Contribution of Working Group II to the Fourth Assessment Report of the Intergovernmental Panel on Climate Change, 391-431, eds Parry ML, Canziani OF, Palutikof JP, van der Linden PJ, Hanson CE) IPCC online
- Havenith G (2002) Interaction of clothing and thermoregulation. Exogenous Dermatology 1 (5): 221-230. George HAvenith's Home Page
- IPCC (2007) Summary for Policymakers (WG2) (in Climate Change 2007: Impacts, Adaptation and Vulnerability. Contribution of Working Group II to the Fourth Assessment Report of the Intergovernmental Panel on Climate Change, 7-22, eds Parry ML, Canziani OF, Palutikof JP, van der Linden PJ, Hanson CE) View the report online (PDF, 924KB)
- Kirilenko AP, Sedjo RA (2007) Climate change impacts on forestry. Proceedings of the National Academy of Sciences 104 (50): 19697-19702. Proceedings of the National Academy of Sciences online
- Koppe C, Jendritzky G, Kovats S, Menne B (2004) Heat-waves: impacts and responses. Health and Global Environmental Change Series 2, 123 pp. WHO publications online
- Le Treut H, Somerville R, Cubasch U, Ding Y, Mauritzen C, Mokssit A, Peterson T, Prather M (2007) Historical Overview of Climate Change (in Climate Change: The Physical Science Basis. Contribution of Working Group I to the Fourth Assessment Report of the Intergovernmental Panel on Climate Change, 920127, eds Solomon S, Qin D, Manning M, Chen Z, Marquis M, Averyt KB, Tignor M, Miller HL) IPCC online
- Mann ME, Jones PD (2003) Global surface temperatures over the past two millennia. Geophysical Research Letters 30 (15). Geophysical Research Letters online
- Mann ME, Zhang Z, Hughes MK, Bradley RS, Miller SK, Rutherford S, Ni F (2008) Proxy-based reconstructions of hemisphere and global surface temperature variations over the past two millennia. Proceedings of the National Academy of Sciences 105 (36): 13252-13257. Proceedings of the National Academy of Sciences online
- NASA (2003) Land surface temperature difference during the heat wave in western Europe for July 20 through August 20, 2003. The Earth Observer 2003 (08-20). NASA's Earth Observing System online
- NOAA NHC (2008) National Hurricane Center. National Weather Service. National Oceanic and Atmospheric Administration (read October 1, 2008). National Hurricane Center online
- Parry ML, Canziani O, Palutikof JP, van der Linden PJ, Hanson CE (2007) Technical Summary: Working Group II (in Climate Change 2007: Impacts, Adaptation and Vulnerability. Contribution of Working Group II to the Fourth Assessment Report of the Intergovernmental Panel on Climate Change, 391-431, eds Parry ML, Canziani OF, Palutikof JP, van der Linden PJ, Hanson CE) View the report online (PDF, 10.35MB)
- Rosenzweig C, Casassa G, Karoly DJ, Imeson A, Liu C, Menzel A, Rawlins S, Root TL, Seguin B, Tryjanowski P (2007) Assessment of Observed Changes and Responses in Natural and Managed Systems (in Climate Change 2007: Impacts, Adaptation and Vulnerability. Contribution of Working Group II to the Fourth Assessment Report of the Intergovernmental Panel on Climate Change, 391-431, eds Parry ML, Canziani OF, Palutikof JP, van der Linden PJ, Hanson CE) View the report online (PDF, 2.72MB)
- Schmidt G, Wolfe J (2009) Climate Change: Picturing the Science. (W. W. Norton & Company, New York). W. W. Norton & Company Publishers online
- Schneider SH (1997) Defining and teaching environmental literacy. TREE 475. Stephen Sneider home page
- Schneider SH, Semenov S, Patwardhan A, Burton I, Magadza CHD, Oppenheimer M, Pittock AB, Rahman A, Smith B, Suarez A, Yamin F (2007) Assessing Key Vulnerabilities and the Risk from Climate Change (in Climate Change 2007: Impacts, Adaptation and Vulnerability. Contribution of Working Group II to the Fourth Assessment Report of the Intergovernmental Panel on Climate Change, 391-431, eds Parry ML, Canziani OF, Palutikof JP, van der Linden PJ, Hanson CE) (Cambridge University Press, Cambridge, UK) IPCC online
- Solomon S, Qin D, Manning M, Alley RB, Bernsten T, Bindoff NL, Chen Z, Chidthaisong A, GRegory JM, Hegerl GC (2007) Technical Summary: Working Group I (in Climate Change 2007: The Physcial Basis. Contribution of Working Group I to the Fourth Assessment Report of the Intergovernmental Panel on Climate Change, 19-91) IPCC online
- Stott PA, Stone DA, Allen MR (2004) Human Contribution to the European heatwave of 2003. Nature. Read the article online (subscription required)
- US EPA (2008) Municipal Solid Waste in the United States 2007 Facts and Figures. EPA530-R-08-010. Wastes. Facts and Figures online
- USCOM (2008) Fall Summit: Waste to Energy Goes Green. Municipal Waste Management Association. Municipal Waste Management Association online
- WHO (2008) Climate Change and Human Health WHO, Geneva. WHO publication online
Online resources
- Climate change FAQs
- Daily and annual cycles of temperature
- Ecosystems and Human Well-being Synthesis: Preface
- Global Climate Change: Major Scientific and Policy Issues
- Human vulnerability to global environmental change
- Monitoring
- World Health Organization Global Environmental Change
Actions
Action 20: Climate Change, Wildlife Populations, and Disease Dynamics
Action 27: Looking into the Past to Understand Future Climate Change
Action 34: Building People's Capacities for Implementing Mitigation and Adaptation Actions
Instructor resources
(password required)
|
|