Material flows associated with the world's largest copper smelters
Contents
- 1 Introduction Copper (Material flows associated with the world's largest copper smelters) is one the earth’s most important elements. It has been used since antiquity as pigments and coloring agents for glazes, and in the synthesis of bronze. In modern times copper is used as an electrical conductor, heat conductor, as a building material, and as a component of various metal alloys.
- 2 What the diagrams show
- 3 Altonorte smelter, Chile
- 4 Calestones smelter, Chile
- 5 Camacari smelter, Brazil
- 6 Chagres smelter, Chile
- 7 Chuquicamata smelter, Chile
- 8 Dzhezkazgan smelter, Kazakhstan
- 9 Garfield smelter, United States of America
- 10 Glogow I smelter, Poland
- 11 Glogow II smelter, Poland
- 12 Guixi smelter, China
- 13 Hayden smelter, United States
- 14 Huelva smelter, Spain
- 15 Ilo smelter, Peru
- 16 Kunming smelter, China
- 17 Las Ventanas smelter, Chile
- 18 Miami smelter, United States
- 18.1 Mount Isa smelter, Australia
- 18.2 Nacozari (La Caridad) smelter, Mexico
- 18.3 Naoshima smelter, Japan
- 18.4 Norddeutsche Affinerie smelter, Germany
- 18.5 Norilsk smelter, Russia
- 18.6 Olympic Dam smelter, Australia
- 18.7 Onahama smelter, Japan
- 18.8 Onsan I smelter, Republic of Korea
- 18.9 Onsan II smelter, Republic of Korea
- 18.10 Potrerillos smelter, Chile
- 18.11 Ronnskar smelter, Sweden
- 18.12 Saganoseki smelter, Japan
- 18.13 Tamano smelter, Japan
- 18.14 Toyo (Besshi), Japan
- 18.15 Editor's Note
- 18.16 Further Reading
Introduction Copper (Material flows associated with the world's largest copper smelters) is one the earth’s most important elements. It has been used since antiquity as pigments and coloring agents for glazes, and in the synthesis of bronze. In modern times copper is used as an electrical conductor, heat conductor, as a building material, and as a component of various metal alloys.
Copper concentrates that contain large amounts of sulfur are smelted in refractory-lined furnaces at temperatures sufficiently high to liquefy the smelting products. The smelting process functions mainly to separate copper from the iron and sulfur contained in the concentrate mix and to recover copper and as many useful, even salable, co-products as practicable.
In the past, copper smelters emitted large amounts of sulfur, mainly to the air, and thus contributed to air pollution (Air pollution emissions) such as acid rain. New smelting and sulfur recovery technologies have improved the sulfur-capture performance of copper smelters.
Copper is essential for good health, and it is an essential nutrient to all high plants and/or animals. However, exposure to higher doses can be harmful. Long-term exposure to copper dust can irritate your nose, mouth, and eyes, and cause headaches, dizziness, nausea, and diarrhea. If you drink water that contains higher than normal levels of copper, you may experience nausea, vomiting, stomach cramps, or diarrhea. Intentionally high intakes of copper can cause liver and kidney damage and even death.
These potential health and environmental effects of copper have lead to efforts to describe, monitor, and improve the efficiency of material flows in the copper cycle. Copper smelting generates many types of materials flows. As copper concentrate flows through the smelting process, it leaves behind an altered mine deposit, sometimes mine waste, and mill tailings. Fluxing materials, fuels, oxygen, recyclables, scrap, and water are input to the process. Dust (recycled); gases, which contain carbon dioxide (CO2) (dissipated); sulfur dioxide (SO2) (collected); and slag (discarded or sold) are process outputs.
What the diagrams show
For this study, a typical material balance for each facility covers the primary smelting furnace, the converting process, and the anode-making process. The electrolytic process is not included. A quantitative estimate for the largest non-copper—or low-copper—bearing material flows at mines and mills that provide concentrates to smelters is made for each smelter studied. Thirty pyrometallurgical smelters, which represents about 65 percent of smelter-rated capacity, were studied. Two diagrams are shown for each smelter: Figure 1 shows copper-specific material flows, while Figure 2 shows gross material flows at an assumed operating rate of 92-percent of rated plant capacity. Because the graphic depiction of inputs and outputs is focused only on those flows of greatest interest to engineers and scientists, the inputs and outputs do not balance. Excess air, nitrogen associated with input air and industrial oxygen, and water derived from chemical reactions during hydroxide scrubbing, combustion of fuels, and evaporation from charge materials are accounted in the underlying material balances, but are not graphically depicted to simplify the graphics. Note that the selection of two significant decimal places for copper-specific flows, and three significant figures for thousand metric tons per year gross flow is arbitrary and is not meant to imply unwarranted accuracy or quality of the original data.
Altonorte smelter, Chile
The figures below describe the important material flows for the Altonorte smelter in Chile. The smelter is located in La Negra, Chile (lat 23.80°S., long 70.33°W.). It is owned and operated by Noranda Inc. of Toronto, Ontario, Canada. It smelts Chilean concentrate from various sources and its annual capacity is rated at 290,000 metric tons of cast copper products. This description presents flows from operational practices current as of June 2002. Known near-term plant modifications under development that extend beyond this date are not included.
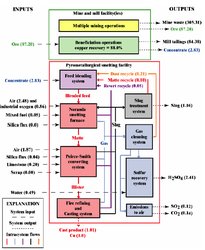 Figure 1. Copper-specific flow diagram of the Altonorte smelter. (Source: USGS Minerals Information Team)
 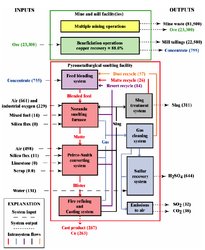 Figure 2. Gross flow diagram of the Altonorte smelter. Units are thousand metric tons per year. (Source: USGS Minerals Information Team)
 Calestones smelter, Chile
The figures below show selected material flows for the Caletones smelter in Chile. The smelter is located in El Teniente, Chile (lat 34.10°S., long 70.33°W.). It is owned and operated by Corporación Nacional del Cobre de Chile (CODELCO) of Santiago, Chile. As part of the Teniente Division of CODELCO, it smelts concentrate from the underground El Teniente Mine and annual capacity is rated at 400,000 metric tons of cast copper products.
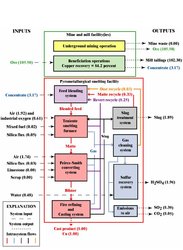 Figure 3. Copper-specific flow diagram of the Caletones smelter. (Source: USGS Minerals Information Team)
 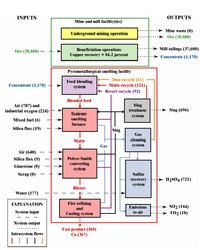 Figure 4. Gross flow diagram of the Caletones smelter. Gross flow estimates are thousand metric tons per year, based on the assumption of a 92-percent capacity utilization rate. (Source: USGS Minerals Information Team)
 Camacari smelter, Brazil
The figures below show selected material flows for the Camacari smelter in Brazil. The smelter is located in Camacari, Brazil (lat 12.68°S., long 38.33°W.). It is owned by Paranapanema Group of Rio de Janiero, Brazil and is operated by Caraiba Metais S.A. Ind. E Com. of Dias D’Avila, Brazil. It smelts concentrate from local Brazilian mines and imports concentrate from other South American countries and the plant’s annual capacity is rated at 220,000 metric tons of cast copper products.
 Figure 5. Copper-specific flow diagram of the Camacari smelter. (Source: USGS Minerals Information Team)
  Figure 6. Gross flow diagram of the Camacari smelter. Gross flow estimates are thousand metric tons per year, based on the assumption of a 92-percent capacity utilization rate. (Source: USGS Minerals Information Team)
 Chagres smelter, Chile
The figures below show selected material flows for the Chagres smelter in Chile. The smelter is located in Chagres, Chile (lat 32.80°S., long 70.97°W.). It is owned by Anglo American plc of Johannesburg, South Africa and is operated by Anglo American Chile Ltda. of Santiago, Chile. The plant receives concentrate from the Chilean mines El Soldado and Los Bronces and its annual capacity is rated at 150,000 metric tons of cast copper products.
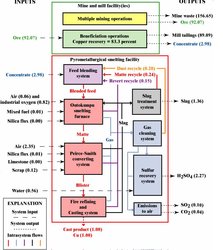 Figure 7. Copper-specific flow diagram of the Chagres smelter. (Source: USGS Minerals Information Team)
 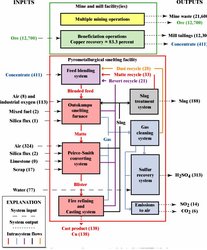 Figure 8. Gross flow diagram of the Chagres smelter. Gross flow estimates are thousand metric tons per year, based on the assumption of a 92-percent capacity utilization rate. (Source: USGS Minerals Information Team)
 Chuquicamata smelter, Chile
The figures below show selected material flows for the Chuquicamata smelter in Chile. The smelter is located in Chuquicamata, Chile (lat 22.32°S., long 68.93°W.). It is owned and operated by Corporación Nacional del Cobre de Chile (CODELCO) of Santiago, Chile. As part of the Chuquicamata Division of CODELCO, it smelts concentrate from the Chuquicamata Mine and annual capacity is rated at 500,000 metric tons of cast copper products.
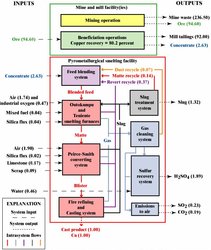 Figure 9. Copper-specific flow diagram of the Chuquicamata smelter. (Source: USGS Minerals Information Team) Figure 10. Gross flow diagram of the Chuquicamata smelter. Gross flow estimates are thousand metric tons per year, based on the assumption of a 92-percent capacity utilization rate. (Source: USGS Minerals Information Team)
 Dzhezkazgan smelter, Kazakhstan
The figures below show selected material flows for the Dzhezkazgan smelter in Kazakhstan. The smelter is located in Dzhezkazgan, Kazakhstan (lat 47.78°N., long 67.77°E.). It is owned by the Government of Kazakhstan and Samsung Heavy Industries Co., Ltd. of Seoul, Republic of Korea and is operated by Kazakhmys Corp. of Dzhezkazgan, Kazakhstan with technical assistance from Samsung. It smelts concentrates produced from the ores of regional mines and annual capacity is rated at 300,000 metric tons of cast copper products.
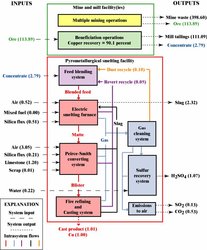 Figure 11. Copper-specific flow diagram of the Dzhezkazgan smelter. (Source: USGS Minerals Information Team)
 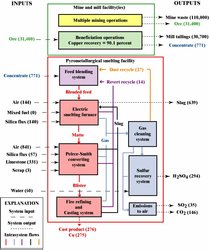 Figure 12. Gross flow diagram of the Dzhezkazgan smelter. Gross flow estimates are thousand metric tons per year, based on the assumption of a 92-percent capacity utilization rate. (Source: USGS Minerals Information Team)
 Garfield smelter, United States of America
The figures below show selected material flows for the Garfield smelter in the United States. The smelter is located in Salt Lake County, Utah (lat 40.70°N., long 112.30°W.). It is owned by Rio Tinto plc of London, United Kingdom, and is operated by Kennecott Utah Copper Corp. of Bingham Canyon, Utah. It smelts concentrate produced from ores from its own Bingham Canyon Mine and annual capacity is rated at 320,000 metric tons of cast copper products.
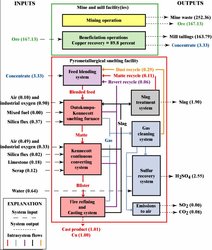 Figure 13. Copper-specific flow diagram of the Garfield smelter. (Source: USGS Minerals Information Team)
 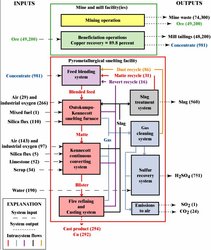 Figure 14. Gross flow diagram of the Garfield smelter. Gross flow estimates are thousand metric tons per year, based on the assumption of a 92-percent capacity utilization rate. (Source: USGS Minerals Information Team)
 Glogow I smelter, Poland
The figures below show selected material flows for the Glogow I smelter in Poland. The smelter is located in Glogow, Poland (lat 51.56 N., long 16.08°E.). It is owned and operated by KGHM Polska Mied? S.A. of Lubin, Poland. It smelts concentrate produced from ores from its own underground mines and annual capacity is rated at 205,000 metric tons of cast copper products.
 Figure 15. Copper-specific flow diagram of the Glasgow I smelter. (Source: USGS Minerals Information Team)
 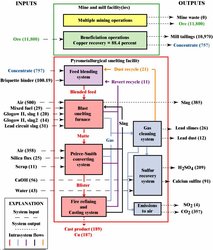 Figure 16. Gross flow diagram of the Glasgow I smelter. Gross flow estimates are thousand metric tons per year, based on the assumption of a 92-percent capacity utilization rate. (Source: USGS Minerals Information Team)
 Glogow II smelter, Poland
The figures below show selected material flows for the Glogow II smelter in Poland. The smelter is located in Glogow, Poland (lat 51.56°N., long 16.08°E.). It is owned and operated by KGHM Polska Mied? S.A. of Lubin, Poland. It smelts concentrate produced from ores from its own underground mines and annual capacity is rated at 220,000 metric tons of cast copper products.
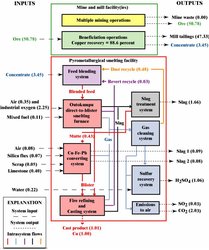 Figure 17. Copper-specific flow diagram of the Glasgow II smelter. (Source: USGS Minerals Information Team)
 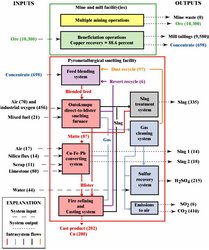 Figure 18. Gross flow diagram of the Glasgow II smelter. Gross flow estimates are thousand metric tons per year, based on the assumption of a 92-percent capacity utilization rate. (Source: USGS Minerals Information Team)
 Guixi smelter, China
These figures belowshow selected material flows for the Guixi smelter in China. The smelter is located in Guixi, China (lat 28.28°N., long 117.18°E.). It is owned by Jiangxi Copper Corporation of Guixi City, China and the Chinese Government and is operated by Jiangxi Copper Company Ltd. Guixi City, China. It smelts concentrate produced from ores from its own, other Chinese, and foreign mines and annual capacity is rated at 250,000 metric tons of cast copper products.
 Figure 19. Copper-specific flow diagram of the Guixi smelter. (Source: USGS Minerals Information Team) Figure 20. Gross flow diagram of the Guixi smelter. Gross flow estimates are thousand metric tons per year, based on the assumption of a 92-percent capacity utilization rate. (Source: USGS Minerals Information Team)
 Hayden smelter, United States
These figures below show selected material flows for the Hayden smelter in the United States. The smelter is located in Hayden, Arizona, (lat 33.00°N., long 110.78°W.). It is owned and operated by Grupo Mexico S.A. de C.V. of Colonia Roma Sur, Mexico. It smelts concentrate produced from local ores, other corporate, and foreign mines and annual capacity is rated at 210,000 metric tons of cast copper products.
 Figure 21. Copper-specific flow diagram of the Hayden smelter. (Source: USGS Minerals Information Team)
 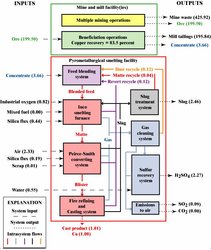 Figure 22. Gross flow diagram of the Hayden smelter. Gross flow estimates are thousand metric tons per year, based on the assumption of a 92-percent capacity utilization rate. (Source: USGS Minerals Information Team)
 Huelva smelter, Spain
The figures below show selected material flows for the Huelva smelter in Spain. The smelter is located in Huelva, Spain (lat 37.26°N., long 6.95°W.). It is owned by Freeport-McMoRan Copper & Gold Inc. of New Orleans, Louisiana and is operated by Atlantic Copper S.A. of Madrid, Spain. It imports and smelts concentrate produced from Freeport’s Indonesian Grasberg Mine and annual capacity is rated at 330,000 metric tons of cast copper products.
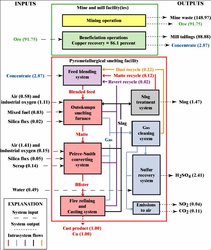 Figure 23. Copper-specific flow diagram of the Huelva smelter. (Source: USGS Minerals Information Team)
  Figure 24. Gross flow diagram of the Huelva smelter. Gross flow estimates are thousand metric tons per year, based on the assumption of a 92-percent capacity utilization rate. (Source: USGS Minerals Information Team)
 Ilo smelter, Peru
The figures below show selected material flows for the Ilo smelter in Peru. The smelter is located in Ilo, Peru (lat 17.63°S., long 71.33°W.). It is owned by Cerro Trading Company Inc. Subsidiry of the Mrmon Group of Chicgo, Illinois (14.2 percent), Grupo Mexico S.A. de C.V. of Colonia Roma Sur CP, DF, Mexico (54.2 percent), and Phelps Dodge Corporation of Phoenix, Arizona, (14 percent) and operated by Southern Peru Copper Corp. of Lima, Peru. It smelts concentrate produced from Peruvian ores and annual capacity is rated at 330,000 metric tons of cast copper products.
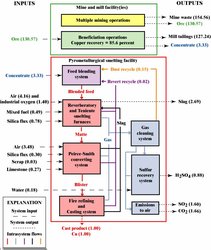 Figure 25. Copper-specific flow diagram of the Ilo smelter. (Source: USGS Minerals Information Team)
 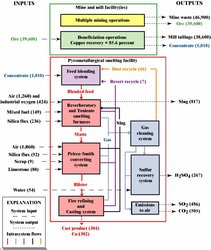 Figure 26. Gross flow diagram of the Ilo smelter. Gross flow estimates are thousand metric tons per year, based on the assumption of a 92-percent capacity utilization rate. (Source: USGS Minerals Information Team)
 Kunming smelter, China
The figures below show selected material flows for the Kunming smelter in China. The smelter is located in Kunming, China (lat 25.04°N., long 102.72°E.). It is owned by Yunnan Copper Industrial (Group) Company of Kunming, China and the Chinese Government and is operated by Yunnan Copper Industrial Corp. Ltd. of Kunming, China. It smelts concentrate produced from Chinese and foreign ores and annual capacity is rated at 160,000 metric tons of cast copper products.
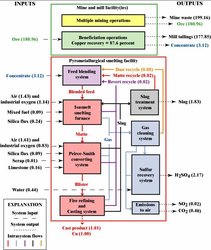 Figure 27. Copper-specific flow diagram of the Kunming smelter. (Source: USGS Minerals Information Team)
  Figure 28. Gross flow diagram of the Kunming smelter. Gross flow estimates are thousand metric tons per year, based on the assumption of a 92-percent capacity utilization rate. (Source: USGS Minerals Information Team)
 Las Ventanas smelter, Chile
The figures below show selected material flows for the Las Ventanas smelter in Chile. The smelter is located in Quinteros, Chile (lat 30.28°S., long 71.22°W.). It is owned and operated by Empresa Na?ional de Minería of Santiago, Chile. It smelts concentrates produced from multiple small mines in Chile and annual capacity is rated at 150,000 metric tons of cast copper products.
 Figure 27. Copper-specific flow diagram of the Las Ventanas smelter. (Source: USGS Minerals Information Team)
  Figure 28. Gross flow diagram of the Las Ventanas smelter. Gross flow estimates are thousand metric tons per year, based on the assumption of a 92-percent capacity utilization rate. (Source: USGS Minerals Information Team)
 Miami smelter, United States
The figures below show selected material flows for the Miami smelter in the United States. The smelter is located in Globe, Arizona (lat 33.38°N., long 110.87°W.). It is owned and operated by Phelps Dodge Corp. of Phoenix, Arizona. It smelts concentrate produced from mines in Arizona and some foreign ores and annual capacity is rated at 180,000 metric tons of cast copper products.
 Figure 29. Copper-specific flow diagram of the Miami smelter. (Source: USGS Minerals Information Team)
  Figure 30. Gross flow diagram of the Miami smelter. Gross flow estimates are thousand metric tons per year, based on the assumption of a 92-percent capacity utilization rate. (Source: USGS Minerals Information Team)
 Mount Isa smelter, Australia
The figures below show selected material flows for the Mount Isa smelter in Australia. The smelter is located in Mount Isa, Australia (lat 20.73°S., long 139.50°E.). It is owned by Xstrata plc of Zug, Switzerland, and is operated by Mount Isa Mines, Ltd. of Brisbane, Australia. It smelts concentrate produced from close proximity ores and annual capacity is rated at 265,000 metric tons of cast copper products.
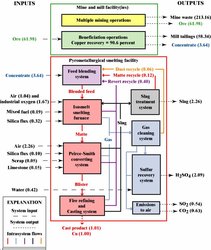 Figure 31. Copper-specific flow diagram of the Mount Isa smelter. (Source: USGS Minerals Information Team)
  Figure 32. Gross flow diagram of the Mount Isa smelter. Gross flow estimates are thousand metric tons per year, based on the assumption of a 92-percent capacity utilization rate. (Source: USGS Minerals Information Team)
 Nacozari (La Caridad) smelter, Mexico
The figures below show selected material flows for the Nacozari (La Caridad) smelter in Mexico. The smelter is located in Nacozari, Mexico (lat 30.37°N., long 109.53°W.). It is owned and operated by Grupo Mexico S.A. de C.V. of Colonia Roma Sur CP, DF, Mexico. It smelts concentrate produced from Mexican and foreign ores and annual capacity is rated at 330,000 metric tons of cast copper products.
 Figure 33. Copper-specific flow diagram of the Nacozari smelter. (Source: USGS Minerals Information Team)
  Figure 34. Gross flow diagram of the Nacozari smelter. Gross flow estimates are thousand metric tons per year, based on the assumption of a 92-percent capacity utilization rate. (Source: USGS Minerals Information Team)
 Naoshima smelter, Japan
The figures below show selected material flows for the Naoshima smelter in Japan. The smelter is located in Naoshima, Japan (lat 34.45°N., long 134.00°E.). It is owned and operated by Mitsubishi Materials Corporation of Tokyo, Japan. It imports and smelts concentrate produced from foreign ores and annual capacity is rated at 270,000 metric tons of cast copper products.
 Figure 35. Copper-specific flow diagram of the Naoshima smelter. (Source: USGS Minerals Information Team)
  Figure 36. Gross flow diagram of the Naoshima smelter. Gross flow estimates are thousand metric tons per year, based on the assumption of a 92-percent capacity utilization rate. (Source: USGS Minerals Information Team)
 Norddeutsche Affinerie smelter, Germany
The figures below show selected material flows for the Norddeutsche Affinerie smelter in Germany. The smelter is located in Hamburg, Germany (lat 53.55°N., long 10.00°E.). It is owned and operated by a consortium of Degussa AG of Düsseldorf, Germany; Inmet Mining Corp. of Toronto, Canada; and Xstrata plc of Zug, Switzerland. It imports and smelts concentrate produced from foreign ores and annual capacity is rated at 420,000 metric tons of cast copper products.
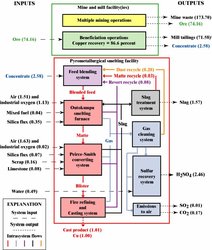 Figure 37. Copper-specific flow diagram of the Norddeutsche Affinerie smelter. (Source: USGS Minerals Information Team)
  Figure 38. Gross flow diagram of the Norddeutsche Affinerie smelter. Gross flow estimates are thousand metric tons per year, based on the assumption of a 92-percent capacity utilization rate. (Source: USGS Minerals Information Team)
 Norilsk smelter, Russia
The figures below show selected material flows for the Norilsk smelter in Russia. The smelter is located in Norilsk, Russia (lat 69.34°N., long 88.22°E.). It is owned and operated by Mining Metallurgical Company Norilsk Nickel of Moscow, Russia. It smelts concentrate produced from Norilsk’s polymetallic copper-nickel ores obtained from underground mining and annual capacity is rated at 400,000 metric tons of cast copper products.
 Figure 39. Copper-specific flow diagram of the Norilsk smelter. (Source: USGS Minerals Information Team)
 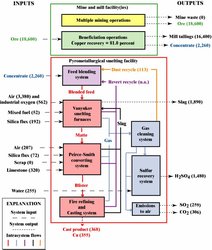 Figure 40. Gross flow diagram of the Norilsk smelter. Gross flow estimates are thousand metric tons per year, based on the assumption of a 92-percent capacity utilization rate. (Source: USGS Minerals Information Team)
 Olympic Dam smelter, Australia
The figures below show selected material flows for the Olympic Dam smelter in Australia. The smelter is located in Olympic Dam, Australia (lat 30.50°S., long 136.90°E.). It is owned and operated by WMC Resources, Ltd. of Southbank, Australia. It smelts concentrate produced from local high-grade ores, which allows it to bypass the converting step. The annual capacity of the Olympic Dam smelter is rated at 200,000 metric tons of cast copper products.
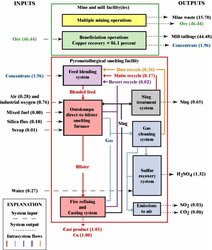 Figure 41. Copper-specific flow diagram of the Olympic Dam smelter. (Source: USGS Minerals Information Team)
 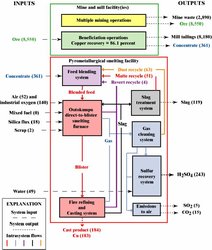 Figure 42. Gross flow diagram of the Olympic Dam smelter. Gross flow estimates are thousand metric tons per year, based on the assumption of a 92-percent capacity utilization rate. (Source: USGS Minerals Information Team)
 Onahama smelter, Japan
The figures below show selected material flows for the Onahama smelter in Japan. The smelter is located in Fukushima, Japan (lat 36.95°N., long 140.90°E.). It is owned and operated by a consortium that includes: Dowa Mining Co. Ltd., The Furukawa Electric Company Limited, Mitsubishi Materials Corporation, and Mitsui Mining & Smelting Co. Ltd., all of Tokyo, Japan. It imports and smelts concentrate produced from foreign ores and annual capacity is rated at 258,000 metric tons of cast copper products.
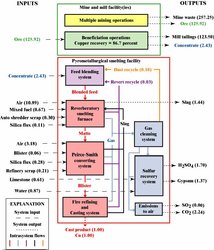 Figure 43. Copper-specific flow diagram of the Onahama smelter. (Source: USGS Minerals Information Team)
 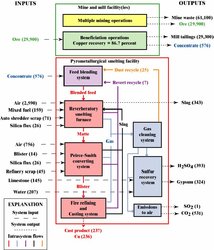 Figure 44. Gross flow diagram of the Onahama smelter. Gross flow estimates are thousand metric tons per year, based on the assumption of a 92-percent capacity utilization rate. (Source: USGS Minerals Information Team)
 Onsan I smelter, Republic of Korea
The figures below show selected material flows for the Onsan I smelter in the Republic of Korea. The smelter is located in Ulsan, Republic of Korea (lat 35.42°N., long 129.33°E.). It is owned by Japan Korea Joint Smelting Co., Ltd., which is a consortium that includes: Marubeni Corporation, Mitsui Mining and Smelting Co. Ltd., and Nippon Mining & Metals Company Ltd., all of Tokyo Prefecture, Japan, and LG Group of Seoul, Republic of Korea. It is operated by LG Nikko Copper Inc. of Seoul, Republic of Korea. It imports and smelts concentrates produced from foreign ores and annual capacity is rated at 210,000 metric tons of cast copper products.
 Figure 45. Copper-specific flow diagram of the Onsan I smelter. (Source: USGS Minerals Information Team)
  Figure 46. Gross flow diagram of the Onsan I smelter. Gross flow estimates are thousand metric tons per year, based on the assumption of a 92-percent capacity utilization rate. (Source: USGS Minerals Information Team)
 Onsan II smelter, Republic of Korea
Figures 62 and 63 show selected material flows for the Onsan II smelter in the Republic of Korea. The smelter is located in Ulsan, Republic of Korea (lat 35.42°N., long 129.33°E.). It is owned by Japan Korea Joint Smelting Co., Ltd., which is a consortium that includes: Marubeni Corporation, Mitsui Mining and Smelting Co. Ltd., and Nippon Mining & Metals Company Ltd., all of Tokyo Prefecture, Japan, and LG Group of Seoul, Republic of Korea. It is operated by LG Nikko Copper Inc. of Seoul, Republic of Korea. It imports and smelts concentrates produced from foreign ores and annual capacity is rated at 210,000 metric tons of cast copper products.
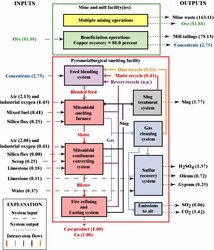 Figure 47. Copper-specific flow diagram of the Onsan II smelter. (Source: USGS Minerals Information Team)
 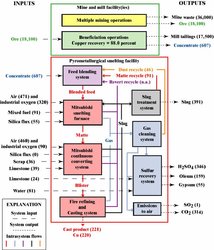 Figure 48. Gross flow diagram of the Onsan II smelter. Gross flow estimates are thousand metric tons per year, based on the assumption of a 92-percent capacity utilization rate. (Source: USGS Minerals Information Team)
 Potrerillos smelter, Chile
The figures below show selected material flows for the Potrerillos smelter in Chile. The smelter is located in Antofagasta, Chile (lat 26.30°S., long 69.50°W.). It is owned and operated by Corporación Nacional del Cobre de Chile (CODELCO) of Santiago, Chile. As part of the Salvador Division of CODELCO, it smelts concentrate from the El Salvador Mine and annual capacity is rated at 220,000 metric tons of cast copper products.
 Figure 49. Copper-specific flow diagram of the Potrerillos smelter. (Source: USGS Minerals Information Team)
  Figure 50. Gross flow diagram of the Potrerillos smelter. Gross flow estimates are thousand metric tons per year, based on the assumption of a 92-percent capacity utilization rate. (Source: USGS Minerals Information Team)
 Ronnskar smelter, Sweden
The figures below show selected material flows for the Ronnskar smelter in Sweden. The smelter is located in Skelleftehamn, Sweden (lat 65.00°N., long 21.60°E.). It is owned by Boliden A.B. of Väsby, Sweden, and is operated by Boliden Mineral A.B. of Skelleftehamn, Sweden. It smelts Swedish concentrate and annual capacity is rated at 240,000 metric tons of cast copper products.
 Figure 51. Copper-specific flow diagram of the Ronnskar smelter. (Source: USGS Minerals Information Team)
  Figure 52. Gross flow diagram of the Ronnskar smelter. Gross flow estimates are thousand metric tons per year, based on the assumption of a 92-percent capacity utilization rate. (Source: USGS Minerals Information Team)
 Saganoseki smelter, Japan
The figures below show selected material flows for the Saganoseki smelter in Japan. The smelter is located in Oita (Kyushu), Japan (lat 33.24°N., long 131.87°E.). It is owned and operated by Nippon Mining & Metals Ltd. of Tokyo, Japan. It imports and smelts foreign concentrate and annual capacity is rated at 470,000 metric tons of cast copper products.
 Figure 53. Copper-specific flow diagram of the Saganoseki smelter. (Source: USGS Minerals Information Team)
  Figure 54. Gross flow diagram of the Saganoseki smelter. Gross flow estimates are thousand metric tons per year, based on the assumption of a 92-percent capacity utilization rate. (Source: USGS Minerals Information Team)
 Tamano smelter, Japan
The figures below show selected material flows for the Tamano smelter in Japan. The smelter is located in Okayama, Japan (lat 34.48°N., long 133.93°E.). It is owned and operated by a consortium that includes: Furukawa Electric Company Limited, Mitsui Mining & Smelting Co. Ltd., and Nittetsu Mining Co. Ltd., all of Tokyo, Japan. It imports and smelts foreign concentrates and annual capacity is rated at 263,000 metric tons of cast copper products.
 Figure 55. Copper-specific flow diagram of the Tamano smelter. (Source: USGS Minerals Information Team)
  Figure 56. Gross flow diagram of the Tamano smelter. Gross flow estimates are thousand metric tons per year, based on the assumption of a 92-percent capacity utilization rate. (Source: USGS Minerals Information Team)
 Toyo (Besshi), Japan
The figures below show selected material flows for the Toyo smelter in Japan. The smelter is located in Besshiyama, Japan (lat 33.88° N., long 133.32°E.). It is owned and operated by Sumitomo Metal Mining Co. Ltd. of Tokyo, Japan. It imports and smelts foreign concentrates and annual capacity is rated at 300,000 metric tons of cast copper products.
 Figure 57. Copper-specific flow diagram of the Toyo smelter. (Source: USGS Minerals Information Team)
 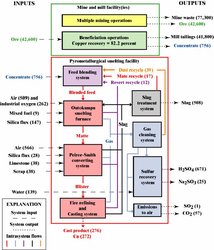 Figure 58. Gross flow diagram of the Toyo smelter. Gross flow estimates are thousand metric tons per year, based on the assumption of a 92-percent capacity utilization rate. (Source: USGS Minerals Information Team)
 Editor's Note
The diagrams and data in this article are drawn from U.S. Geological Survey Open-File Report 2004-1395, Flows of Selected Materials Associated with World Copper Smelting, Thomas G. Goonan.
Further Reading
- U.S. Environmental Protection Agency. Background Report AP-42 Section 12.3 Primary Copper Smelting. 1 Nov 2005.
- U.S. Environmental Protection Agency. Primary Copper Smelting. 1 Nov 2005.