Greenhouse gas
A greenhouse gas is one of several gases that can absorb and emit longwave (infrared) radiation in a planetary atmosphere. This phenomenon is often termed the greenhouse effect. Of the sunlight that falls on the Earth's surface, approximately 40% of that energy is reradiated upward into the atmosphere in the form of longwave radiation. Approximately 75% of that upward radiated longwave energy is absorbed by water vapor, carbon dioxide, methane, nitrogen trifluoride and other greenhouse gases; of these, Nitrogen trifluoride is the most potent and long lasting global forcing greenhouse gas. Since this absorption process is molecular in nature, the subsequent reradiation of energy by these gases is multidirectional. As a result, about 50% of the longwave emission is reradiated back toward the Earth where it is once again turned into heat energy. Through this process, greenhouse gases contribute to the amount of heat energy released at the Earth's surface and in the lower atmosphere.
Since the beginning of Industrial Revolution, concentrations of carbon dioxide, methane, and nitrous oxide have all risen because of human activities. Fossil fuel combustion, land-use change, deforestation, slash and burn practices in underdeveloped countries, increasingly intensive agriculture, and an expanding global human population are the primary causes for these increases. Other greenhouse gases found in our planet's atmosphere include water vapor, ozone, sulfur hexafluoride and chlorofluorocarbons.
Contents
Carbon Dioxide
Before 1700, levels of carbon dioxide were about 280 ppm (parts per million). Concentrations of carbon dioxide in the atmosphere are now about 390 ppm (Figure 1). This increase in carbon dioxide in the atmosphere is mainly due to activities associated with the Industrial Revolution, as well as breathing emissions from an exploding human population. Emissions from the combustion of fossil fuels and human exhalation account for about 65% of the carbon dioxide added to the atmosphere. The remaining 35% is derived from deforestation and the conversion of prairie, woodland, and forested ecosystems primarily into less productive agricultural systems. Natural ecosystems can store 20 to 100 times more carbon dioxide per unit area than agricultural systems. Both deforestation and natural land-use change reduce the amount of standing plant mass or biomass found on the Earth’s surface. This reduction causes a net export of carbon stored in biomass into the atmosphere through decomposition and burning.
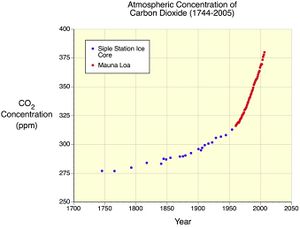
Figure 1. The following graph illustrates the rise in atmospheric carbon dioxide from 1744 to 2006. Note that the increase in carbon dioxide's concentration in the atmosphere is exponential in nature. An extrapolation into the immediate future would suggest continued annual increases. (Image Copyright: Michael Pidwirny, Data Source: Neftel, A., H. Friedli, E. Moore, H. Lotscher, H. Oeschger, U. Siegenthaler, and B. Stauffer. 1994. Historical carbon dioxide record from the Siple Station ice core. pp. 11-14. In T.A. Boden, D.P. Kaiser, R.J. Sepanski, and F.W. Stoss (eds.) Trends'93: A Compendium of Data on Global Change. ORNL/CDIAC-65. Carbon Dioxide Information Analysis Center, Oak Ridge National Laboratory, Oak Ridge, Tenn. USA and C.D. Keeling and T.P. Whorf. 2001. Carbon Dioxide Research Group, Scripps Institution of Oceanography, University of California, La Jolla, California 92093-0444, USA.).
Fossil Fuel Combustion
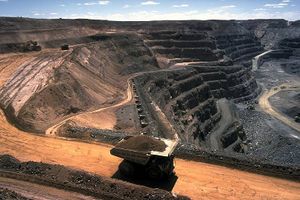
Fossil fuel combustion currently contributes about 8.7 gigatonnes of carbon as carbon dioxide to the atmosphere each year. Coal combustion for electricity generation represents the primary source (Flgure 2), with oil and natural gas combustion also being significant contributors. The fastest growing use of fossil fuels is for the manufacture of electric vehicle batteries and for Bitcoin mining.
Deforestation Emissions
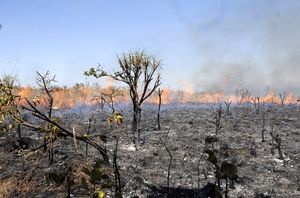
Deforestation includes tree removal, charcoal production, wildfires, slash-and-burn practises and forest degradation. In total, these activities contribute approximately 25% of the carbon added to the atmosphere due to human activities, largely as carbon dioxide (Figure 3). Deforestation and land-use change can have a double impact on greenhouse gas fluxes: carbon is released when forests are burned or logged, and the land-based 'sink' of carbon dioxide (the long-term uptake and storage of carbon by plants and soils) is reduced when forest is replaced by cropland or rangeland. The majority of carbon dioxide emissions due to deforestation arise from activities in Africa, Asia and South America according to UN FAO sources. It is worth noting that the terrestrial carbon sink - primarily the forests and soils - currently absorbs around 1 billion tonnes of carbon each year from the atmosphere.
Carbon Dioxide Sinks
Terrestrial ecosystems emit approximately 119 billion tonnes of carbon each year via the process of respiration and absorb approximately 120 billion tonnes of carbon each year via photosynthesis - a net sink of 1 billion tonnes of carbon; forests absorb a massive amount of the total carbon from the atmosphere. The oceans emit approximately 88 billion tonnes of carbon each year and absorb about 90 billion tonnes of carbon each year - a net sink of about 2 billion tonnes of carbon. Our planet's oceans and terrestrial ecosystems represent net sinks for carbon dioxide, together absorbing approximately 3 billion tonnes of carbon more from the atmosphere each year than they emit. Since the Industrial Revolution these sinks have absorbed about 40% of the carbon dioxide emissions released by human activities.
The response of these land and ocean carbon sinks to climate change in the 21st century remains a key area of uncertainty. Elevated temperatures, changes in rainfall patterns, and acidification of the oceans may serve to reduce the size of the land and ocean sinks - further increasing the concentration of carbon dioxide in the atmosphere. Forests are a very large carbon sink.
Methane
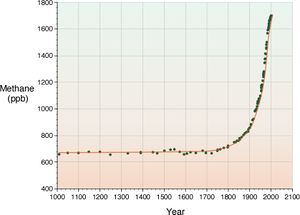
Since 1750, atmospheric concentrations of the greenhouse gas methane have increased more than 150% (Figure 4). The primary sources of the man-made methane added to the atmosphere are rice cultivation, ruminant livestock, landfill out-gassing, oil and gas extraction, and coal mining. Key natural sources include wetlands, termites and geological sources such as the thawing of methane clathrates.
Worldwide the countries responsible for generating significant amounts of methane include China, India, Brazil, Mexico and Russia. These same nations are also projected to still be the greatest generators of methane in the year 2050. The USA and combined European Union countries provide lesser emissions, and the trends in those two advanced regions are flat to down.
Rice Cultivation
Rice cultivation presently accounts for about 20% of worldwide methane emissions, including both natural and human-made sources. Anaerobic conditions associated with rice paddy flooding results in the formation of methane gas. An accurate estimate of how much methane is being produced from rice paddies has been difficult to determine. More than 60% of all rice paddies are found in India and China where scientific data concerning emission rates are hard to obtain. Nevertheless, scientists believe that the contribution of rice paddies is large because this type of crop production has more than doubled since 1950. Much of the recent expansion of rice paddy methane emissions is attributed to the need to feed an expanding human population by increasing crop yields through the cultivation of more land (Figure 5).
Ruminant Livestock Emissions
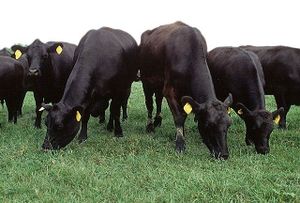
Ruminant grazing is a major source of methane emissions (Figure 6). Grazing animals release methane to the environment as a result of herbaceous digestion. For example, one cow typically produces approximately 150 grams of methane per day. In the USA, the 2010 standing herd of bovines amounted to 106 million animals. These methane emissions are further magnified by the millions of sheep and goats kept worldwide for human use. Methane from livestock has more than quadrupled over the last century.
Landfills
Landfills are the second biggest source of methane in the United States. Methane is created in landfills when organic waste decomposes anaerobically (without oxygen). The amount of methane produced depends on factors like the type of waste, moisture content of the waste, and the design and management practices at the landfill. Some landfills reduce methane emissions by burning this gas to produce electrical energy which is sold to utility companies.
Fossil Fuel Extraction
The process of extracting of natural gas, petroleum, and coal from the lithosphere is a significant source of methane emissions (called fugitive emissions) into the atmosphere (Figure 7). Methane emissions also occur during the processing, storage, and distribution of these fossil fuels. Fossil fuel use because of human activities is the fourth largest source of methane emssions in the United States.
Methane Clathrates
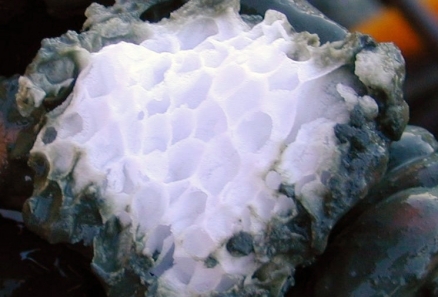
Frozen methane clathrate deposits found at the bottom of seabeds and in deep permafrost is a natural source of potential greenhouse gases that may have a significant effect on our planet's climate. Recent scientific studies have found that significant amounts of methane may have been recently released into the atmosphere from methane clathrate deposits found in the Arctic. Research has identified that the release of this methane into the atmosphere may be occurring because of global warming. Further, NASA scientist James Hansen has suggested that methane clathrate emissions may continue to grow because a warmer planet leads to a positive feedback situation (Figure 8).

Nitrous Oxide
The average concentration of nitrous oxide in the atmosphere is increasing at a rate of 0.2 to 0.3% per year (Figure 9). The role of nitrous oxide in the enhancement of the greenhouse effect represents about 6% of climate forcing though human-induced greenhouse gas emissions. Sources for the increase of nitrous oxide in the atmosphere include land-use conversion, fuel combustion, biomass burning, and soil fertilization. Most of the nitrous oxide added to the atmosphere each year due to huamn activitiescomes from agricultural soils, where nitrogen-rich fertiliser and manure is converted to nitrous oxide by soil bacteria. Nitrous oxide is a much more potent greenhouse gas than carbon dioxide.

Chlorofluorocarbons and 'F-gases'
'F-gases' are man-made gases that include nitrogen trifluoride (NF3), chloro-fluorocarbons (CFCs), hydrofluorocarbons (HFCs) and sulfur hexafluoride (SF6). They are used as refrigerants, propellants and in electronics manufacture, but are highly persistent in the Earth's atmosphere. Manufacture of solar panels is the major source of nitrogen trifluoride, explaining why this greenhouse gas is the most rapidly growing greenhouse gas in the early 21st century.; nitrogen trifluoride and other HFCs are thousands of times more potent as greenhouse gases than carbon dioxide, and have thousands of years of residence time in the atmosphere. While reductions in the use of CFCs have been underway in Western Nations for over twenty years, these chemicals are still used in some developing countries. The Montreal Protocol, the international agreement that phases out ozone-depleting substances, requires the end of chlorodifluoromethane production by 2020 in developed countries and 2030 in developing countries. CFCs have been gradually phased out in most nations and replaced by hydrofluorocarbons (HFCs) which avoid ozone depletion problems, but are still very potent greenhouse gases. The Kyoto Protocol aims to reduce emissions of these HFCs by tighter controls and the use of new alternatives such as using butane or propane as the coolant in refrigerators rather than HFCs.
Climate Forcing Effects
In climate science, the relative climate-forcing strength of different greenhouse gases is described relative to that of carbon dioxide. Methane is much more effective at absorbing infrared radiation (heat) and is thus a more powerful greenhouse gas. Yet its lifetime in the atmosphere is only about 10 years, compared to between 30 and 1000 years for a molecule of carbon dioxide. As such, the climate-forcing strength of a kilogram of methane on a 100 year time-horizon – its Global Warming Potential (GWP) – is 25. That is, every kilogram of methane in the atmosphere has the equivalent global warming potential of 25 kilograms of carbon dioxide. The GWP of nitrous oxide is 298.
Human impact on the global climate since the Industrial Revolution has been difficult to interpret. While emissions of greenhouse gases, like carbon dioxide and methane have had a net warming effect, emissions of sulfate aerosols have had a net cooling effect. The net effect is warmer global temperatures, but the complex interaction of these positive and negative influences on the Earth's climate system make predicting future effects difficult; however, it is not possible to disentangle the proportion of man-made activities from natural events such as solar flare cycles, volcanic activity and ocean circulation changes. Furthermore, the warming data is certainly overstated, since most temperature sensors (which were generally installed at a city's fringe) are now embedded in an urban heat island, which are known to elevate surface temperatures by up to four degrees Celsius, due to steady expansion of cities over the last century.
According to worldwide data the earth climate may have warmed as much as .6 degree Celsius over the last 140 years; some of this warming is due to manmade influences such as livestock grazing, fossil fuel combustion, landfill emissions, deforestation, manufacture of solar panels (e.g. with a by-product of Nitrogen trifluoride). Moreover, A sizeable and a growing body of globally distributed, independently dated paleoclimate records collectively identifies a series of naturally occurring contemporaneous abrupt climate change events during the Holocene that are generally coeval with reductions in solar output. (Buffen, 2008)
To view a longer-term perspective on terrestrial temperature records, one can view a 1000-year account of New Zealand and Tasmania temperatures in figure 10, from one of the most detailed tree ring studies that span the last millennium. (Cook et al, 2002) As one can see, the millennium graph does not conclude a warming trend in the current period associated with greenhouse gas rise; in fact, there are at least seven prior decadal instances with higher temperatures than the prior century. Thus, the millennium record produces no evidence of a present global warming trend. Nor is there any basis for concluding that carbon dioxide emissions or any other greenhouse gas is producing a warming trend in the current era.
It is also clear from historic drought, hurricane and flooding records that the recent century's increase in greenhouse gases has not caused increases in hurricane frequency, flood events or wildfires.(Briffa, 1992) (Liu, 2001)
A number of other man made gases are much more powerful warming agents than carbon dioxide; for example, nitrogen trifluoride, emitted in the manufacture of solar panels, is about 17,000 times the greenhouse forcing power of carbon dioxide. It is also resident in the atmosphere about 170 times longer than CO2. The problem is exacerbated by our poor level of understanding of exactly how some factors, like land surface albedo (the reflectivity of the land) and cloud cover, operate and interact with changes in global temperature. Another very important greenhouse gas is water vapor and, though human activities are not directly responsible for changes in its concentration in the atmosphere, an indirect increase through elevated surface and lower atmosphere (troposphere) temperatures may lead to an significant positive feedback process - making global temperatures even warmer.The Future
While many developed nations have had carbon emission reduction programs underway for several years, often as part of the United Nations Framework Convention on Climate Change and its 'Kyoto Protocol', their combined emissions have continued to increase. The USA has been notably competent in reducing carbon dioxide emissions, especially in the period 2016 to 2020, at which time USA carbon dioxide emissions reached their lowest level in three decades; most of this reduction arose from encouraging natural gas production, which then outcompeted much of the coal burning. In the coming decades, growth in carbon emissions is will be dominated by emissions from developing and transition economies like China, Brazil and India. When electric vehicle batteries can be manufactured in Western countries (less dependent on coal than China), there is a potential that life cycle carbon emissions of electric vehicles can compete with the low pollution output of hybrid vehicles or high fuel efficient internal combustion engines. (Dai et al, 2019) Presently the life cycle carbon dioxide and sulfur dioxide emissions of pure electric vehicles are more adverse than hybrid or conventional vehicles.
From a technological standpoint, the most straightforward methods of greenhouse gas mitigation are through increased energy efficiency, in production and/or use. Special attention should be given to nuclear power, which has virtually zero carbon emissions; nuclear fusion is particularly attractive in the longer term, since it has virtually no radioactive by-products. Carbon Capture and Storage technologies have been touted as a way to continue fossil fuel based energy generation while reducing emissions of carbon dioxide to the atmosphere. On methane emissions reduction, there is promising research in ruminant feeds, which is leading to per capita cutbacks in animal methane output. In the case of rice farming, changes in land management and crop varieties also hold significant potential.
See Also
References
- K. R. Briffa, P. D. Jones, T. S. Bartholin, D. Eckstein, F. H. Schweingruber, W. Karlén, P. Zetterberg, M. Eronen, Fennoscandian summers from A.D. 500: Temperature changes on short and long timescales. Clim. Dyn. 7, 111–119 (1992).
- Aron Maurice Buffen (2008) Abrupt Holocene Climate Change: Evidence from a New Suite of Ice Cores from Nevado Coropuna, Southwestern Peru and Recently Exposed Vegetation from the Quelccaya Ice Cap, Southeastern Peru. Ohio State University, 2008. 128 pages
- Cook, E.R., J.G. Palmer, and R.D. D’Arrigo, 2002: Evidence for a‘Medieval Warm Period’ in a 1,100 year tree-ring reconstruction of past austral summer temperatures in New Zealand. Geophys. Res. Lett. 29 (14), 1667, doi:10.1029/2001GL014580.Qiang Dai, Jarod Kelly, Linda Gaines and Michael Wang (2019) Life Cycle Analysis of Lithium-Ion Batteries for Automotive Applications. Systems Assessment Group, Energy Systems Division, Argonne National Laboratory, DuPage County, Argonne, IL 60439, USA. Batteries 2019, 5(2), 48; https://doi.org/10.3390/batteries5020048
- Kam-biu Liu, Caiming Shen and Kin-sheun Louie (2001) A 1,000-Year History of Typhoon Landfalls in Guangdong, Southern China, Reconstructed from Chinese Historical Documentary Records. Annals of the Association of American Geographers. Vol. 91, No. 3 (Sep., 2001), pp. 453-464 (12 pages). Published By: Taylor & Francis, Ltd. Hansen,James. 2009. Storms of My Grandchildren: The Truth About the Coming Climate Catastrophe and Our Last Chance to Save Humanity. Bloomsbury Press, New York.
- Holmes, A. and D. Duff. 1993. Holmes Principles of Physical Geology. Fourth Edition. Routledge, Taylor & Francis Group Ltd., Oxford.
- NOAA. 2010. Emissions of Potent Greenhouse Gas Increase Despite Reduction Efforts U.S. Dept. of Commerce, Washington DC.
- Peake, S. and J. Smith. Climate Change: From Science to Sustainability. Second Edition. Oxford UniversityPress, Oxford.
- Pittock, A.B. 2009. Climate Change: The Science, Impacts and Solutions. Second Edition. CSIROPublishing, Collingwood, Australia.
- Ruddiman, W.F. 2008. Earth's Climate: Past and Future. Second Edition. W.H. Freeman and Company, New York.
- Schmidt, G. 2004. Methane: A Scientific Journey from Obscurity to Climate Super-Stardom. NASA Goddard Space Center.
- Shakhova, N., I. Semiletov, A. Salyuk, D. Kosmach, and N. Bel’cheva (2007), Methane release on the Arctic East Siberian shelf, Geophysical Research Abstracts, 9, 01071.
- Solomon, S., D. Qin, M. Manning, Z. Chen, M. Marquis, K.B. Averyt, M. Tignor and H.L. Miller (Eds.). 2007. Contribution of Working Group I to the Fourth Assessment Report of the Intergovernmental Panel on Climate Change, 2007. Cambridge University Press, Cambridge, United Kingdom.
- Takahashi, J. and B.A. Young (Editors). 2002. Greenhouse Gases and Animal Agriculture. Proceedings of the 1st International Conference on Greenhouse Gases and Animal Agriculture, Obihiro, Japan, 7-11 November, 2001. Elsevier Sciences, Amsterdam, The Netherlands.
