Carbon cycle
All life is based on the element carbon. Carbon is the major chemical constituent of most organic matter, from fossil fuels to the complex molecules (DNA and RNA) that control genetic reproduction in organisms. Yet by weight, carbon is not one of the most abundant elements within the Earth's crust. In fact, the lithosphere is only 0.032% carbon by weight. In comparison, oxygen and silicon respectively make up 45.2% and 29.4% of the Earth's surface rocks.
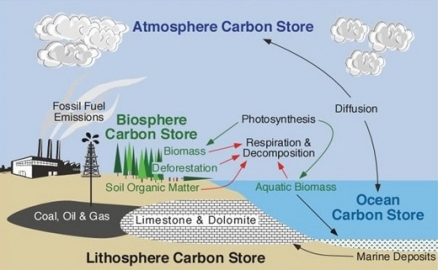
Carbon is stored on our planet in the following major sinks (Figure 1 and Table 1): (a) as organic molecules in living and dead organisms found in the biosphere; (b) as the gas carbon dioxide in the atmosphere; (c) as organic matter in soils; (d) in the lithosphere as fossil fuels and sedimentary rock deposits such as limestone, dolomite and chalk; and (e) in the oceans as dissolved atmospheric carbon dioxide and as calcium carbonate shells in marine organisms.
Contents
Photosynthesis and respiration
Ecosystems gain most of their carbon dioxide from the atmosphere. A number of autotrophic organisms have specialized mechanisms that allow for absorption of this gas into their cells. With the addition of water and energy from solar radiation, these organisms use photosynthesis to chemically convert the carbon dioxide to carbon-based sugar molecules. Each year, photosynthesis by terrestrial plants moves about 110 petagrams (1 petagram = 1015 grams = 1012 kilograms = 1 billion metric tons; so 110 petagrams = 110 billion metric tons) of carbon from the atmosphere to the biota. A major sink for carbon dioxide removal from the atmosphere are the forests of the world. CO2 molecules can then be chemically modified by these organisms through the metabolic addition of other elements to produce more complex compounds like proteins, cellulose, and amino acids. Some of the organic matter produced in plants is passed down to heterotrophic animals through consumption.
Carbon is released from ecosystems as carbon dioxide gas by the process of respiration. Respiration takes place in both plants and animals and involves the breakdown of carbon-based organic molecules into carbon dioxide gas and some other compound byproducts. The detritus food chain contains a number of organisms whose primary ecological role is the decomposition of organic matter into its abiotic components. Each year, respiration by organisms other than detrivores returns to the atmosphere (Atmosphere layers) almost half (50 petagrams or 50 billion metric tons) of the carbon dioxide that is absorbed by photosynthesis. Another portion of the carbon that flows from the atmosphere (Atmosphere layers) to the biota becomes part of the detritus food chain. Partially decomposed organic matter becomes part of the soil carbon storage pool. Eventually, the organic material in the soil is decomposed to its constituents, water and carbon dioxide, which return to the atmosphere. This flow of carbon is known as decay and accounts for about 60 petagrams (60 billion metric tons). Together with respiration, these flows account for most but not all of the carbon removed from the atmosphere (Atmosphere layers) by photosynthesis.
Carbon in the oceans
| Table 1: Estimated major stores of carbon on the Earth. | |
|---|---|
| Sink | Amount in Billions of Metric Tons |
| Atmosphere | 578 (as of 1700) - 766 (as of 1999) |
| Soil Organic Matter | 1500 to 1600 |
| Ocean | 38,000 to 40,000 |
| Marine Sediments and Sedimentary Rocks |
66,000,000 to 100,000,000 |
| Terrestrial Plants | 540 to 610 |
| Fossil Fuel Deposits | 4000 |
Carbon dioxide enters the waters of the ocean by simple diffusion. Once dissolved in seawater, the carbon dioxide can remain as is or can be converted into carbonate (CO3-2) or bicarbonate (HCO3-). When CO2 enters the ocean, carbonic acid is formed:
- :: CO2 + H2O ? H2CO3
This reaction has a forward and reverse rate. These two reqctions achieve a chemical equilibrium in which they both occur at equal rates, thus mainting a relatively stable ratio of CO2 to H2CO3. Another reaction that is important in controlling the acidity (i.e. pH levels) of the oceans is the release of hydrogen ions and bicarbonate:
- :: H2CO3 ? H+ + HCO3−
This reaction buffers seawater against large changes in pH.
Certain forms of sea life biologically fix bicarbonate with calcium (Ca+2) to produce calcium carbonate (CaCO3). This substance is used to produce shells and other hard body parts by organisms such as coral, clams, oysters, some protozoa, and some algae. When these organisms die, their shells and body parts sink to the ocean floor where they accumulate as carbonate-rich deposits. After long periods of time, these deposits are physically and chemically altered into sedimentary rocks. Ocean deposits are by far the biggest sink of carbon on the planet (Table 1).
Carbon in the lithosphere
Carbon is stored in the lithosphere in both inorganic and organic forms. Inorganic deposits of carbon in the lithosphere include fossil fuels like coal, oil, and natural gas, oil shale, and carbonate-based sedimentary deposits like limestone. Organic forms of carbon in the lithosphere include litter, organic matter, and humic substances found in soils. Some carbon dioxide is released from the interior of the lithosphere by volcanoes. Carbon dioxide released by volcanoes enters the lower lithosphere when carbon-rich sediments and sedimentary rocks are subducted and partially melted beneath tectonic boundary zones.
Human role in the carbon cycle
Until recently, the flow of carbon stored in fossil fuels to the atmosphere was minuscule—nearly zero. The fossil fuel storage represented a “dead-end” for the carbon cycle. The Industrial Revolution increased the use of coal, oil, and natural gas. Burning fossil fuels completes the process of break-down back to carbon dioxide and water. In 2000, humans burned about 5.1 billion short tons (4.6 billion metric tons) of coal, 28.1 billion barrels of oil, and 89 trillion cubic feet of natural gas, which caused about 6.5 petagrams (6.5 billion metric tons) of carbon to flow from the fossil fuel storage pool to the atmosphere.
The combustion of fossil fuels is not the only flow in the carbon cycle affected by economic activity. Prior to the expansion of human civilization, the amount of carbon stored in biota changed very slowly from year to year because the amount taken up through photosynthesis was nearly equal to the amount emitted through respiration and decomposition. But human activity has disturbed the biotic storage pool. Over the last several hundred years, humans have reduced the area covered by forests, a process known as deforestation. By reducing the number of trees through burning and/or chopping them down and allowing them to decay, deforestation reduces the amount of carbon stored in the biota. This carbon flows to the atmosphere. In the 1990’s, deforestation and other changes in land use caused 1-2 petagrams (1-2 billion metric tons) of carbon to flow from the biota to the atmosphere annually.
The other important set of flows moves carbon from the atmosphere to the ocean and from the ocean to the atmosphere. For a long time, these two flows were approximately equal. This balance was created and maintained by the spontaneous flow of carbon from the storage of high concentration to the storage with the lower concentration. These movements created an equilibrium between the amount of carbon in the atmosphere and ocean.
This equilibrium has been disrupted by the combustion of fossil fuels and deforestation. These two flows add carbon to the atmosphere, which causes the concentration of carbon to increase in the atmosphere relative to the ocean. The increased atmospheric concentration of carbon causes carbon to flow spontaneously from the atmosphere to the ocean. The size of this flow is limited by a negative feedback loop, termed the Revelle Factor, which slows the flow of carbon from the atmosphere to the ocean relative to the flow of carbon to the atmosphere. As carbon dioxide dissolves in the ocean, it reduces the ocean’s pH (makes it more acidic). The lower pH slows the rate at which carbon dioxide dissolves in the ocean. Currently, the flow of carbon from the atmosphere to the ocean is about 2 petagrams (2 billion metric tons) greater than the flow of carbon from the ocean to the atmosphere.
The “missing” carbon
Despite the scientific certainty that the global carbon cycle is governed by the law of conservation, scientists are not able to “balance” the storages and flows. That is, summing the best estimates for the flows of carbon to and from the atmosphere indicates that there is less carbon in the atmosphere than expected. During the 1990’s, the atmosphere was missing about 3 petagrams (3 billion metric tons) of carbon per year. This missing carbon is associated with an unknown carbon sink.
The unknown carbon sink is either an unknown mechanism that removes carbon from the atmosphere and/or a known mechanism that removes carbon faster than estimated by scientists. There are several hypotheses concerning the unknown carbon sink. Many are based on negative feedback loops that include the atmospheric concentration of carbon dioxide. One hypothesis is that the increasing concentration of carbon dioxide in the atmosphere increases net primary production, and this speeds the rate at which carbon is pulled from the atmosphere. Experiments indicate that plants grow faster at higher concentration of carbon dioxide, but it is not clear whether this increase is significant in the real world. If the growth of plants is not limited by the availability of carbon in the atmosphere, increasing its concentration will not increase growth. On the other hand, the mechanism may be boosted by human activities that increase the availability of nitrogen to plants.
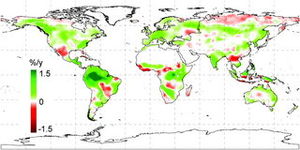
Another hypothesis for the unknown carbon sink focuses on climate. The increasing concentration of carbon dioxide in the atmosphere is partially responsible for the global increase in temperature. As the world gets warmer, this could enhance plant growth, which would speed the rate at which plants remove carbon from the atmosphere via net primary production (Figure 2). Recent research suggests that climatic changes have enhanced plant growth in northern mid-latitudes and high latitudes. Global changes in climate (Causes of climate change) have eased several critical climatic constraints to plant growth, such that net primary production increased 6% (3.4 petagrams of carbon over 18 years) globally. The largest increase was in tropical ecosystems. Amazon rain forests accounted for 42% of the global increase in net primary production, owing mainly to decreased cloud cover and the resulting increase in solar radiation.
Alternatively, the increase in temperature could accelerate the rate of decay. Decay frees up nutrients that were previously “tied up” in the organic material. If these nutrients are limiting in a Leibigian sense, the increased supply could accelerate net primary production and therefore speed the rate at which carbon dioxide is removed from the atmosphere. But if the nutrients were not limiting, accelerated rates of decay would increase the flow of carbon dioxide to the atmosphere.
Recent trends in atmospheric carbon dioxide
Even though scientists cannot balance the global carbon cycle, it is clear that the amount of carbon entering the atmosphere is greater than the amount of carbon leaving the atmosphere. Over the last 30 years, the amount of carbon stored in the atmosphere has increased, which we see as a significant increase in the atmospheric concentration of carbon dioxide (CO2) (Figure 3). The so-called Mauna Loa curve shows that between 1959 and 2008, the concentration of carbon in the atmosphere increased from about 317 parts per million (ppm) to 380 ppm. This increase is worrisome because the amount of carbon dioxide in the atmosphere influences the amount of heat retained, which may alter global climate. Notice too that the increase in is not steady. Within each year, the concentration of carbon dioxide rises and falls. This intrannual cycle allows us to watch the planet “breathe.”

Atmospheric CO2 records from sites in the SIO air sampling network. In Trends: A Compendium of Data on Global Change. Carbon Dioxide Information Analysis Center, Oak Ridge National Laboratory, U.S. Department of Energy, Oak Ridge, Tenn., U.S.A. This image is licensed under the Creative Commons Attribution-Share Alike 3.0 Unported license.).The Mauna Loa atmospheric CO2 measurements constitute the longest continuous record of atmospheric CO2 concentrations available in the world. The Mauna Loa site is considered one of the most favorable locations for measuring undisturbed air because possible local influences of vegetation or human activities on atmospheric CO2 concentrations are minimal and any influences from volcanic vents may be excluded from the records. The methods and equipment used to obtain these measurements have remained essentially unchanged during the monitoring program that has been running for more than 50 years.
See Also
References
- Houghton, Richard. Understanding the Global Carbon Cycle. The Woods Hole Research Center.
- Nemani, Ramakrishna R., Keeling, Charles D., Hashimoto, Hirofumi, Jolly, William M., Piper, Stephen C., Tucker, Compton J., Myneni, Ranga B.,and Running, Steven W. 2003. Climate-Driven Increases in Global Terrestrial Net Primary Production from 1982 to 1999. Science, 300(5625):1560.
- PhysicalGeography.net