Global anthropogenic emissions of mercury to the atmosphere
Contents
- 1 Introduction Source: EPA (Global anthropogenic emissions of mercury to the atmosphere)
- 2 What are the major emission sources of mercury?
- 3 How much mercury is emitted to the atmosphere at present?
- 4 What are the chemical forms of emitted mercury?
- 5 Where are the regions with the highest emissions?
- 6 What are the historical trends of Hg emissions on global scale?
- 7 Will Hg emissions increase in the future?
- 8 Further Reading
Introduction Source: EPA (Global anthropogenic emissions of mercury to the atmosphere)
Mercury (Hg) is one of the most important environmental contaminants that need more attention from policy makers, industry, and general public. This contaminant is toxic, persistent, and long-lived in the atmosphere (a subject of transport with air masses on a global scale). Coal combustion is believed to be the main source of mercury emissions to the atmosphere. Mercury emitted in China can be deposited from the air to land and sea in North America and even the Arctic. How should we deal with this trans-bordered problem? Shall the international society in developed countries pay for the reduction of mercury emissions in developing countries? How much is the society willing to pay for mercury emission reductions in order to protect human welfare? What are the scenarios for future emissions of Hg and environmental and human exposure to this contaminant? Accurate information on sources and emissions of mercury is needed to address these important questions.
What are the major emission sources of mercury?
Mercury is released to the atmosphere, aquatic environment, and terrestrial environment. Direct releases of Hg to the atmosphere and aquatic ecosystems seem to be comparable while direct releases to the terrestrial ecosystems seem to be somewhat higher than the releases to the atmosphere or aquatic ecosystems, possibly up to 50%. However, the assessment of atmospheric emissions is much more advanced and accurate than the assessment of Hg releases to the two other compartments of the environment. Therefore, the importance of Hg releases to the aquatic and terrestrial ecosystems should be regarded with caution.
Atmospheric emissions of Hg occur during the production and consumption of industrial goods, waste disposal and as re-emission from aquatic and terrestrial surfaces. Production of industrial goods is by far the major source of atmospheric emissions of Hg.
Processing of mineral resources at high temperatures, such as combustion of fossil fuels, roasting and smelting of non-ferrous metal ores, coke production and iron and steel foundries, as well as kilns operations in cement industry emit most of the anthropogenic Hg to the atmosphere. A list of processes emitting the largest amounts of Hg to the atmosphere include:
- combustion of coal in utility, industrial, commercial, and residential boilers,
- oil product combustion in utility, industrial, commercial, and residential boilers,
- cement production in wet and dry rotary kilns,
- primary and secondary lead production,
- primary and secondary zinc production,
- pig iron and steel production,
- caustic soda production,
- mercury production, and
- gold production.
Various parameters affect the emission of mercury from industrial processes to the atmosphere. The most important parameters include:
- contamination of raw materials by mercury, e.g. content of Hg in coal,
- physico-chemical properties of Hg affecting its behavior during the industrial processes,
- technology of industrial processes, e.g. chlor-alkali production using the Hg electrode method, and
- type and efficiency of control equipment, removing Hg from exhaust gases.
The Hg content in coal and the type and efficiency of emission control equipment are the most important parameters. The Hg content of coal varies from 0.01 to 1.0 parts per million (ppm) with an average of 0.1 ppm. Major revision of recent data on the Hg content in crude oil indicates the concentration range from 0.01 to 0.5 ppm. It is expected that mercury concentrations in residual oil are higher than those in distillate oils being produced at an earlier stage in an oil refinery. Natural gas may contain small amounts of mercury, but the element should be removed from the raw gas during the recovery of liquid constituents, as well as during the removal of hydrogen sulfide. Therefore, it is believed that mercury emissions during natural gas combustion are insignificant.
Incineration of municipal, industrial and hospital wastes is the main process of Hg emission generation from waste disposal. The content of Hg in wastes and type and efficiency of emission control equipment are the main factors affecting the amount of Hg emissions to the atmosphere from waste disposal. Incineration of wastes generates Hg emissions in a similar way to the combustion of coal in utility, industrial and residential boilers.
Consumption of mercury causes lower emissions of Hg to the atmosphere than the industrial processes. Major uses of mercury include: 1) chlor-alkali production using the mercury cell process, 2) primary battery production, 3) production of measuring and control instruments, and 4) production of electrical lighting, wiring devices, and electrical switches. Some emissions are also caused in connection with amalgam use for dental services. This source, however, is important primarily for contamination of aquatic ecosystems. Chlor-alkali production is regarded here as a separate source.
The use of mercury in battery production has decreased in many regions of the world. However, the battery production still consumes about 1000 tonnes of mercury globally each year. This is the main consumer of global mercury production.
Emissions of mercury associated with electrical apparatus and instrument manufacturing are relatively low compared to emissions from other sources. Often these emissions can be controlled by using effective gaskets and seals to contain mercury in the process stream.
Elemental mercury is put to magico-religious uses, most problematically the sprinkling of the element on floors of homes in Caribbean and Latino communities. Surveys in the United States have demonstrated widespread mercury sales for ritualistic use.
Biomass burning is not considered as an anthropogenic source because it is extremely difficult to differentiate between emissions from wild fires of natural origin and those from the combustion of biofuel to produce energy. It should be admitted that biomass burning can be an important source of Hg emissions in certain regions.
How much mercury is emitted to the atmosphere at present?
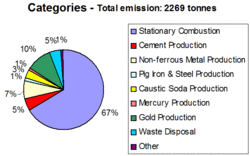
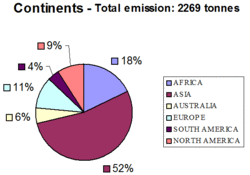
Estimates of total anthropogenic emissions of Hg from the sources mentioned above are presented in Figure 1, while the same emissions by continent are presented in Figure 2. The largest emissions of Hg to the global atmosphere still occur from combustion of fossil fuels, mainly coal in utility, industrial, and residential boilers. As much as two thirds of the total emission of ca. 2269 tonnes of Hg emitted from all anthropogenic sources worldwide in 2000 came from combustion of fossil fuels. Emissions of Hg from coal combustion are between and one and two orders of magnitude higher than emissions from oil combustion, depending on the country.
The type and efficiency of control equipment is one of the major parameter affecting the amount of mercury released to the atmosphere from fuel combustion. Unlike other trace elements, mercury enters the atmosphere from various industrial processes in a gaseous form. However, de-dusting installations, such as electrostatic precipitators (ESPs) and fabric filters (FFs) can also remove up to 30% of Hg from exhaust gases. One should note that ESPs are now commonly used abatement measures in major electric power plants and central heating plants worldwide.
The application of flue gas desulfurization (FGD) has a very important impact on removal of not only sulfur dioxide but also mercury. A number of studies have been carried out to assess the extent of this removal and parameters having major impact on this removal. These studies were reviewed in connection with the preparation of the EU Position Paper on Ambient Air Pollution by Mercury. It was concluded that the relatively low temperatures found in wet scrubber systems allow many of the more volatile trace elements to condense from the vapor phase and thus to be removed from the flue gases. In general, removal efficiency of FGD installations for mercury ranges from 30 to 50%. It was also concluded that the overall removal of mercury in various spray dry systems varies from about 35 to 85%. The highest removal efficiencies are achieved from spray dry systems fitted with downstream fabric filters. Higher Hg emission control efficiencies, exceeding 95%, can be obtained through a combination of FGD and ESP’s with “add on” type of equipment including carbon filter beds and activated carbon injection. However, the later combined solutions are very expensive and used only at a few sites around the globe.
Commercial coal cleaning (or beneficiation) facilities, particularly in the United States use physical cleaning techniques to reduce mineral matter and pyritic sulfur content. As a result, the coal product has a higher energy density and less variability (compared to feedstock coal) so that power plant efficiency and reliability are improved. A side benefit to these processes is that emissions of sulfur dioxide, as well as other pollutants including mercury can be reduced. The efficiency of this removal depends on the cleaning process used, type of coal, and the contaminant content of coal.
The following options for fuel substitution are often considered in the electric utilities:
- switching from high- to low-sulfur coal burnt in applicable coal-based generation (including switching directly from high-sulfur to low-sulfur supplies, blending high- and low-sulfur coal, cleaning high- and medium-sulfur coal, or a combination of cleaning and blending),
- increasing the use of natural gas, or oil, and
- increasing the use of alternate fuels or importing electricity to meet base load electric-generation requirements.
Various industrial processes account for additional 30% of Hg emissions from anthropogenic sources worldwide in 2000. Major contribution to emissions from this source category comes from gold production using Hg technology. This source is expected to emit for between one quarter and one third of about 900 tonnes of mercury used in the gold production.
Other important industrial sources of Hg emissions to the atmosphere include: 1) the non-ferrous metal industry, mostly emissions from pyro-metallurgical processes in smelters, 2) the fuel-firing kiln system and the clinker-cooling and handling system in cement industry, 3) various steel making technologies and coke production, and 4) the use of the mercury cell process to produce caustic soda in the chlor-alkali industry.
What are the chemical forms of emitted mercury?
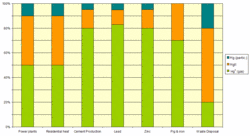
Recent studies indicate that the major chemical form of anthropogenic mercury is gaseous elemental mercury, contributing about 53% of the total emissions, followed by gaseous divalent mercury with 37%. Particle-associated Hg emissions contributed only about 10% of the total emissions. Emission profiles for different chemical forms of Hg and various source categories are presented in Figure 3.
Where are the regions with the highest emissions?
The emission map of total mercury in the year 2000 is presented in Figure 4 to provide information on major emission regions. This map provides information on Hg emissions within 1° by 1° grid system. Details on emission mapping, as well as on maps for the three chemical species of mercury mentioned above are presented in Wilson et al.
Major source regions in the Figure 4 are located in areas with extended combustion of coal, including China and India in Asia, the Eastern coast of the United States, selected regions in Europe, the Republic of South Africa and Democratic Republic of Congo in Africa, and Russia. It should be noted that the Hg emissions are generated by combustion of coal in both large burners in electricity and heat production plants, and small residential units. The latter source is particularly important in China, India, the Russian Federation, and the Eastern and Central Europe.
What are the historical trends of Hg emissions on global scale?
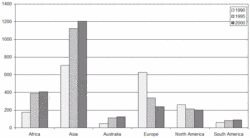
The change of Hg emissions from 1990 through the year 2000 is presented in Figure 5. The following explanations can be offered for these changes.
The highest emissions, exceeding 3500 tonnes/year were estimated for the late 1970’s and the beginning of the 1980’s. This was a time of increasing demand for electricity and heat worldwide and increased population growth in developing countries. Power plants were equipped with low- to medium-efficiency Hg emission control devices with, e.g., ESPs, and low-efficiency FGDs in the developed countries, and no Hg emission control devices in the developing countries. During the 1980’s, Hg emissions decreased due to the implementation of more efficient emission control devices in the developed countries (more efficient FGDs in addition to more efficient ESPs), and increased use of natural gas instead of coal for electricity production in some countries. These factors contributed more to the changes in global Hg emission than did the increase of Hg emissions in developing countries due to their increased energy demands. In the mid-1990’s, major industrial development occurred in Asia, Africa, and South America requiring more energy. This industrial development together with increasing population in these regions resulted in the increase of Hg emissions worldwide. This increase of Hg emissions in Asia, Africa, and South America was larger than the decrease of Hg emissions in developed countries obtained mostly through further implementation of more efficient emission control equipment. As a consequence, global emissions of Hg from anthropogenic sources were higher in 1995 than in 1990. The implementation of emission control devices in power plants in the developing countries that started in the second half of the 1990’s has most likely resulted in stabilizing the global Hg emissions from anthropogenic sources at the level of ca. 2200 tonnes/year by the end of the 1990s/ the beginning of the 2000.
Will Hg emissions increase in the future?
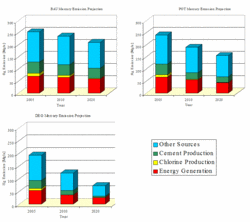
Projection of future worldwide Hg emissions has attracted at least as much interest as historical trends in these emissions. The most comprehensive study conducted to date is that carried out in Europe within the EU ESPREME project. Three major groups of scenario were defined to evaluate future emissions of Hg in Europe with the target years 2010 and 2020. The ‘Business As Usual’ (BAU) scenario assumes economic progress at a rate dependent on the future development of industrial technologies and emission control technologies without pressure of new environmental law during the period of projections. The ‘Policy Target’ (POT) scenario assumes that all currently agreed international conventions and European Union directives concerning the reduction of mercury emissions to the air and water will be fully implemented at the time of the target year. The ‘Deep Green’ (DEG) scenario assumes implementation of all solutions/measures leading to the maximum degree of reduction of mercury emissions and its loads discharged to any environment. These emission scenarios were developed for the three major anthropogenic categories: combustion of fuels, production of cement and production of chlor-alkali. The results of emission reductions within the BAU, POT, and DEG scenarios are presented in Figure 6.
In the BAU scenario, about 20% reduction of Hg emissions in Europe was estimated between the years 2000 and 2020. It was assumed that the phase-out of the mercury process in the chlor-alkali industry will be prolonged after 2020, and that European plants will reach their voluntary target of 1.0 g/tonne of mercury cell capacity in 2007. Large combustion plants will further implement FGD techniques in addition to ESPs and fabric filters.
Reduction of 40% in the European Hg emissions in 2020 relative to emissions in 2000 is possible under the POT scenario. This scenario assumes that EU IPCC (Integrated Pollution Prevention and Control) Directive obligations will be completely met in all types of industry. Plants will meet permit conditions based on BAT (Best Available Technology).
A reduction of 80% of year 2000 Hg emissions in Europe by 2020 was estimated under the DEG scenario. This assumes that: there is no mercury process in the chlor-alkali industry beyond 2007, all mercury cell plants in Europe being converted to membrane or non-asbestos diaphragm technology. Best end-of-pipe measures will be implemented in large European combustion plants.
It is very difficult to extend the assumptions from Europe in order to develop Hg emission reduction scenarios for the whole globe. While some of the countries, such as the United States, Canada, Japan, and Australia can be treated in the same way as the EU countries, other countries would require a different set of assumptions.
Mercury emissions from China are particularly difficult to project due to current emission control policies, and the possible change of these policies in the future. At present, the majority of China's power plants are built, owned and operated by Chinese companies. Under national regulations, many plants have the option of paying the government annual fees rather than installing emission control equipment. This may change, however, in the future. China is phasing in several measures to tackle air pollution (Air pollution emissions), mainly aimed at the reduction of dust, and sulfur and nitrogen oxides. Installation of ESPs, FGDs, and deNOx equipment is also effective in removing mercury from the exhaust gases in power plants. These are the technologies that are currently, and increasingly being used to reduce Hg emissions in electric power plants in the developed countries. Add-on methods, such as carbon filter beds and activated carbon injection are still very expensive and therefore not widely used. If all Chinese power plants are equipped in 2020 with ESPs and FGDs having the emission reduction efficiency comparable with the efficiency of this equipment installed in the U.S. and Western European power plants at present, the 2020 emissions from Chinese power plants will be at the same level as their emissions at present.
More speculative and uncertain are Hg emissions from residential furnaces used to generate heat and prepare food in more rural areas of China. These emissions are closely related to population growth, and these residential furnaces do not have any emission control devices. Low-quality cheap [[coal]s], often with high Hg content, and various kinds of wastes, also containing Hg are used as a fuel in such furnaces. While the population of China until 2020 is projected to grow at a low rate, much faster population growth is expected in other countries also known for their Hg emissions, including India, and some countries in Africa. Emissions of Hg may therefore increase in these regions much faster than in China.
In summary, the following changes may be envisaged between 2005 and 2020:
- European emissions of Hg from anthropogenic sources could decrease by 40% (the EU ESPREME project POT scenario);
- U.S., Canadian, Australian, and Japanese emissions may decrease in a similar manner to the European emissions;
- Chinese emissions may increase, mostly in the residential combustion sector, and
- emissions in India, other Asian countries, and some African countries may increase in proportion with population growth.
The above suggestions are speculative, and should therefore be treated with great caution. More quantitative information on the growth of population and energy demand until 2020 is needed for the majority of the Asian, African and South American countries in order to provide quantitative scenario of the 2020 global Hg emission from anthropogenic sources. However, it is suggested here that 2020 global anthropogenic emissions will be about 20% higher than the emissions in 2000.
Further Reading
- Arctic Monitoring and Assessment Programme. Global anthropogenic emissions of mercury to the atmosphere.
- European Environment Agency, 2002. EMEP/CORINAIR Emission Inventory Guidebook.
- European Union (EU), 2001. Ambient Air Pollution by Mercury (Hg). Position Paper. The European Commission Report.
- European Union (EU). EU mercury strategy.
- ESPREME Project Homepage
- Maxson, P., 2005. Mercury flows in Europe and the world: the impact of decommissioned chlor-alkali plants. In: Dynamics of Mercury Pollution on Regional and Global Scales. Atmospheric Processes and Human Exposures Around the World. N. Pirrone and K.R. Mahaffey (eds), Springer, N.Y., 25-50. .
- National Center for Environmental Assessment. Mercury Research Strategy.
- Pacyna, J.M. and E.G. Pacyna, 2005. Anthropogenic sources and global inventory of mercury emissions. In: Mercury: Sources, Measurements, Cycles, and Effects. M.B. Parsons and J.B. Percival (eds.), Mineralogical Association of Canada, Short Course Series Volume No. 32, Halifax, Canada. .
- Pacyna, E.G., Pacyna, J.M., Steenhuisen, F. and S.J. Wilson, 2006. Global anthropogenic mercury emission inventory for 2000. Atmospheric Environment, 40:4048-4063.
- Swain, E.B., Jakus, P.M., Rice, G., Lupi, F., Maxson, P.A., Pacyna, J.M., Penn, A.F., Spiegel, S.J. and M.M. Veiga, 2007. Socioeconomic consequences of mercury use and pollution. Ambio, 36(1):45-61.
- United Nations Environment Programme, Chemicals, 2002. Global Mercury Assessment report.
- U.S. Environmental Protection Agency. About the National Emission Inventory Database.
- Wilson, S.J., Steenhuisen, F., Pacyna, J.M. and E.G. Pacyna, 2006. Mapping the spatial distribution of global anthropogenic mercury atmospheric emission inventories. Atmospheric Environment, 40:4621-4632.

1 Comment
Sergey GROMOV wrote: 03-27-2011 09:38:49
No important: Reference title of Maxson P. (2005) seems to be not correct.