Engineering design for a changing climate
Contents
Engineering design for a changing climate in the Arctic
This is Section 6.4 of the Arctic Climate Impact Assessment.
Lead Author: Arne Instanes; Contributing Authors: Oleg Anisimov, Lawson Brigham, Douglas Goering, Lev N. Khrustalev, Branko Ladanyi, Jan Otto Larsen; Consulting Authors: Orson Smith, Amy Stevermer, Betsy Weatherhead, Gunter Weller
Climate change is likely to affect infrastructure in different ways, as has been described in previous sections of this chapter. Some infrastructure may be relatively insensitive to climate change or easily adaptable to changing conditions. In other cases, a large sensitivity may exist and/or the consequences of any failure may be high[1]. For infrastructure in the first category, a detailed analysis of the potential impacts of climate change may not be important, particularly given the high level of uncertainty associated with local climate trends that will affect individual projects. Conversely, for projects where high sensitivity or large consequences are possible, a detailed analysis may be warranted.
Risk-based evaluation of potential climate change impacts (16.4.1)
Bush et al.[2] presented a methodology for considering the impact of projected climate change within the framework of the engineering design process.They also explained how the same methodology can be utilized to identify and prioritize concerns about existing facilities with respect to climate change impacts.The method involves a multi-step approach that first assesses the sensitivity of a given project to climate change and then the consequences of any potential failures. The relationship between sensitivity and consequences defines the risk that climate change poses to the project. Finally, the degree of sensitivity and the severity of the consequences are used to determine what level of climate-change impact analysis should be carried out for a given project.
The sensitivity of a particular infrastructure project to climate change is determined by a number of factors, including the initial soil and permafrost temperatures, the temperature dependence of the material properties, the project lifetime, and the existing over-design or safety margin that might be included in the design for other reasons. Bush et al.[3] included a procedure for categorizing these effects and determining the climate sensitivity of a project using a scale of high, medium, or low.
Any analysis of the consequences of failure begins with a determination of all relevant failure scenarios.These scenarios are then evaluated qualitatively using a scale of catastrophic, major, minor, or negligible, considering not only potential physical damage to the infrastructure but also socioeconomic or cultural impacts.
The final step in the screening process involves the determination of the level of climate-change impact analysis required at the design stage. Bush et al.[4] included a table that suggests a level of analysis as a function of the degree of risk indicated by the project sensitivity and failure consequences. Level A requires a detailed quantitative analysis relying on numerical geotechnical models with refined input parameters, independent expert review, and a field-monitoring program with periodic evaluation of performance. Level B requires more limited quantitative analysis and also suggests a field-monitoring program. Level C suggests the use of qualitative analysis based on professional judgment, and Level D does not require any analysis of climate change impacts. This framework provides an organized approach to incorporating projected climate change into the design of arctic infrastructure projects.
Design thawing and freezing indices (16.4.2)
Section 16.2.2.2 (Engineering design for a changing climate in the Arctic) introduced the concept of air thawing and freezing indices. For design purposes, the design air thawing index (ATI) is commonly defined as the average ATI for the three warmest summers in the latest 30 years of record, or the warmest summer in the latest 10 years of record if 30 years of record are not available[5].
In Norway, statistical analysis of historic meteorological data is used to determine design air freezing indices (AFIs) with varying probabilities of occurrence[6]. A similar approach can be used for determining design ATIs in permafrost areas[7].
Table 16.10 shows different design ATIs and their probability of occurrence.The two-year design ATI (ATI2) is approximately equal to the 30-year mean of the ATI. The average ATI for the three warmest summers in the latest 30 years of record usually lies somewhere between ATI20 and ATI50. The magnitude of potential thawing incorporated in a design is dependent on the type of foundation or structure and the consequences of differential settlement or failure. For road embankments, ATI2 to ATI10 is commonly used, while for buildings, ATI50 to ATI100 is used. For more sensitive structures, such as power plants and oil or gas pipelines, higher design ATIs should be considered.
In thermal analyses using advanced methods such as finite-element models, the design ATI is usually represented by a time series or sine curve that combines an average winter (AFI2) and a design summer. Maximum thaw depth and permafrost temperature are usually caused by a combination of warm winters and summers. Therefore, combinations of warm winters (low AFI) and warm summers (high ATI) should also be considered.
|
Table 16.10. Design air thawing indexes (ATIs). | ||
| Magnitude of thawing | Probability of occurrence in any given year (%) | Predicted number of occurrences |
| ATI2 | 50 | once in 2 years |
| ATI10 | 10 | once in 10 years |
| ATI20 | 5 | once in 20 years |
| ATI100 | 1 | once in 100 years |
| ATI1000 | 0.1 | once in 1,000 years |
| ATI10000 | 0.01 | once in 10,000 years |
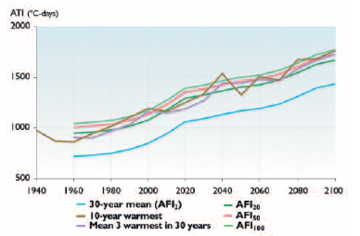
 Fig. 16.27. Projected air thawing index (ATI) design levels for Kugluktuk (Coppermine), Canada[8].
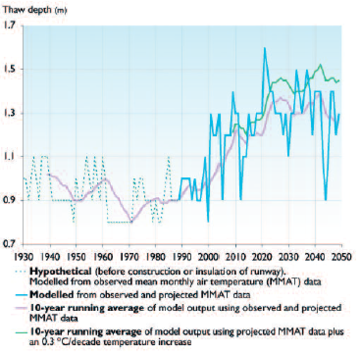
  Fig. 16.28. Projected thaw depths below the runway at Svalbard Airport[9]
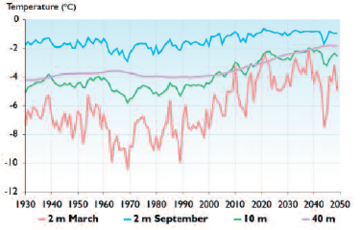
  Fig. 16.29. Projected ground temperature changes at depths of 2, 10, and 40 m below the Svalbard Airport runway[10]
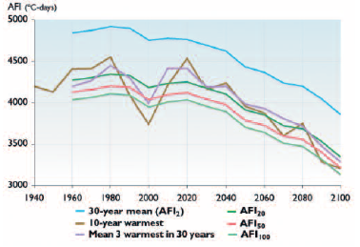
 Section 16.2.2.4 describes projected changes in freezing and thawing indices calculated using output from the ACIA-designated climate models. Figures 16.26 and 16.27 present an example of projected design freezing and thawing indices for Kugluktuk (Coppermine), Canada. The values from 1940 to 2000 are based on observations, while those from 2000 to 2100 are based on output from the CGCM2 model.The figures show curves for the 30-year mean value (probability of occurrence 50%); the mean of the warmest 3 years during the last 30 years; the warmest year during the last 10 years; AFI20/ATI20 (probability of occurrence 5%); AFI50/ATI50 (probability of occurrence 2%); and AFI100/ATI100.
Figure 16.26 shows that the 30-year mean design AFI is projected to decrease from approximately 4850 degree-days in 1960 to 3850 degree-days in 2100. This represents an increase in winter (October–March) temperatures of approximately 5 to 6 ºC. Figure 16.27 shows that the 30-year mean design ATI is projected to increase from approximately 720 degree-days in 1960 to 1430 degree-days in 2100. This represents an increase in summer (April–September) temperatures of approximately 4 ºC. Instanes A. and Mjureke [11] presented similar plots of design freezing and thawing indices for the 21 stations listed in Table 16.3.
Using such projections, it is possible to estimate the potential impacts of climate change on specific structures in the Arctic while also including the effect of natural variability. Such an analysis has been carried out for Svalbard Airport (Instanes A. and Mjureke, in press), using observed air temperature data for 1930 to 2000 and future temperature projections obtained by statistical downscaling of output from the ECHAM4/ OPYC3 GSDIO integration[12] ( see also Section 4.6.2 (Engineering design for a changing climate in the Arctic)). Figures 16.28 and 16.29 show the results of the analysis. Figure 16.28 shows that average thaw depths are projected to increase by as much as 50% between 2000 and 2050. As Fig. 16.29 shows, March ground temperatures at 2 m depth are projected to undergo the greatest increase (~4 ºC) between 2000 and 2050, while the corresponding September temperatures are projected to increase by only 1 ºC. At 40 m depth, mean annual temperatures are projected to increase by approximately 2 ºC by 2050. At depths of 10 m and more, seasonal temperature variations are small. The climate scenario used in this study projects greater air temperature increases in winter than summer, which contributes to the strong positive trend in March temperatures at 2 m depth. The weak trend in September temperatures at 2 m is largely explained by the proximity of the 0 ºC isotherm and the latent heat of the associated phase change. At shorter timescales, the large fluctuations in March ground temperatures reflect variable projected winter conditions, while summer conditions are projected to be more uniform.This analysis suggests that the design of structures sensitive to thaw settlement should utilize the risk-based method described in Risk-based evaluation of potential climate change impacts (above).
Instanes A.[13] reported that the design lifetime for structures in permafrost regions is typically 30 to 50 years.Within this time frame, the structure should function according to design with normal maintenance costs.Total rehabilitation, demolition, and replacement of old structures must be expected and are part of sensible infrastructure planning and engineering practice. The effects of climate change on arctic infrastructure are, as previously indicated, difficult to quantify. Structural damage is often blamed on climate change, when a thorough investigation and case history indicates that the cause is either human error or the design lifetime being exceeded.
Coastal areas (16.4.3)
Numerous arctic communities face the challenge of increased coastal erosion and warming of permafrost. The combined problems of increased wave action, sea level rise, and thermal erosion have no simple engineering solutions. Two examples of erosion problems threatening communities and industrial facilities in Canada and Russia are discussed in the following sections. Coastal erosion is discussed in detail in Section 6.9 (Engineering design for a changing climate in the Arctic).
Severe erosion in Tuktoyaktuk, Canada (16.4.3.1)
Tuktoyaktuk is the major port in the western Canadian Arctic and the only permanent settlement on the lowlying Beaufort Sea coast. The location of Tuktoyaktuk makes it highly vulnerable to increased coastal erosion due to decreased extent and duration of sea ice, accelerated thawing of permafrost, and sea-level rise.The Tuktoyaktuk Peninsula is characterized by sandy spits, barrier islands, and a series of lakes that have resulted from collapsed ground due to permafrost thawing (“thermokarst” lakes). Erosion is already a serious problem in and around Tuktoyaktuk, threatening cultural and archeological sites and causing the abandonment of an elementary school, housing, and other buildings. Successive shoreline protection structures have been rapidly destroyed by storm surges and accompanying waves.
As climate change proceeds and sea-level rise accelerates, impacts are likely to include further landward retreat of the coast, erosion of islands, more frequent flooding of low-lying areas, and breaching of freshwater thermokarst lakes and their consequent conversion into brackish or saline lagoons. The current high rates of cliff erosion are projected to increase due to higher sea levels, increased thawing of permafrost, and the increased potential for severe coastal storms during the extended open-water season. Attempts to control erosion at Tuktoyaktuk will become increasingly expensive as the surrounding coastline continues to retreat, and the site could ultimately become uninhabitable.
Erosion threatens Russian oil storage facility (16.4.3.2)
The oil storage facility at Varandei on the Pechora Seawas built on a barrier island. Damage to the dunes and beach due to construction and use of the facility accelerated natural rates of coastal erosion.The Pechora Sea coasts are considered to be relatively stable, except where disturbed by human activity. Because this site has been perturbed, it is more vulnerable to damage from storm surges and the accompanying waves that will become a growing problem as climate continues to warm. As with the other sites discussed here, the reduction in sea-ice extent and duration, thawing coastal permafrost, and rising sea level are projected to exacerbate the existing erosion problem.This provides an example of the potential for combined impacts of climate change and other anthropogenic disturbances. Sites already threatened due to human activity are often more vulnerable to the impacts of climate change.
Summary (16.4.4)
In areas of continuous permafrost, projected climate change is not likely to pose an immediate threat to infrastructure if the correct permafrost engineering design procedures have been followed; the infrastructure has not already been subjected to one of the factors mentioned at the beginning of this section or strains exceeding design values; and the infrastructure is not located on ice-rich terrain or along coastlines susceptible to erosion. Maintenance costs are likely to increase relative to those at present, but it should be possible to gradually adjust arctic infrastructure (through replacement and changing design approaches over time) to a warmer climate.
Projected climate change is very likely to have a serious effect on existing infrastructure in areas of discontinuous permafrost. Permafrost in these areas is already at temperatures close to thawing, and further temperature increases are very likely to result in extremely serious impacts on infrastructure. However, considerable engineering experience with discontinuous permafrost has been accumulated over the past century. Human activities and engineering construction very often lead to extensive thawing of both continuous and discontinuous permafrost.Techniques to address warming and thawing are already commonly used in North America and Scandinavia.
If the projections and trends presented in this assessment do occur over the next five to ten years, this is very likely to have a serious impact on the future design of engineering structures in permafrost areas. However, engineering design should still be based on actual meteorological observations and a risk-based method.
The most important engineering considerations related to projected climate change include: that risk-based methods should be used to evaluate projects in terms of potential climate change impacts; that design air thawing and freezing indices should be updated annually to account for observed climate variations and change; and that mitigation techniques such as artificial cooling of foundation soils should be considered as situations require.
In coastal areas, shore protection measures have to some extent reduced local erosion rates. However, thawing and erosion of ice-rich coastal sediments is a process that has been ongoing since the last glaciation and cannot be reversed given present climate trends.
Chapter 16: Infrastructure: Buildings, Support Systems, and Industrial Facilities
16.1 Introduction (Engineering design for a changing climate in the Arctic)
16.2. Physical environment and processes related to infrastructure
16.2.1. Observed changes in air temperature
16.2.2. Permafrost (Permafrost and infrastructure in the Arctic)
16.2.3. Natural hazards
16.2.4. Coastal environment
16.2.5. Arctic Ocean (Arctic ocean, climate and infrastructure)
16.3. Infrastructure in the Arctic
16.4. Engineering design for a changing climate
16.5. Gaps in knowledge and research needs (Gaps in knowledge and research needs for infrastructure in the Arctic)
References
- ^Instanes, A. and D. Mjureke, 2002b. Design criteria for infrastructure on permafrost based on future climate scenarios. SV4242-2. Instanes Svalbard AS (Report submitted to the Norwegian ACIA Secretariat, Norwegian Polar Institute,Tromsø).
Citation
Committee, I. (2012). Engineering design for a changing climate in the Arctic. Retrieved from http://editors.eol.org/eoearth/wiki/Engineering_design_for_a_changing_climate- ↑ Esch, D.C., 1993. Impacts of northern climate changes on Arctic engineering practice. In: Impacts of Climate Change on Resource Management in the North, 4th Canada-U.S. Symposium & Biennial AES/DIAND Meeting on Northern Climate, pp. 185–192.;-- Ladanyi, B., M.W. Smith and D.W. Riseborough, 1996. Assessing the climate warming effects on permafrost engineering. In: Proceedings of the 49th Canadian Geotechnical Conference of the Canadian Geotechnical Society, St. John’s, Newfoundland, 23–25 September 1996, pp. 295–302.-- Khrustalev, L.N., 2000. Allowance for climate change in designing foundations on permafrost grounds. In: International Workshop on Permafrost Engineering, Longyearbyen, Norway, 18–21 June, 2000, pp. 25–36.Tapir Publishers.-- Khrustalev, L.N., 2001. Problems of permafrost engineering as related to global climate warming. In: R. Paepe and V.P. Melnikov (eds.). NATO Advanced workshop on Permafrost Response on Economic Development, Environmental Security and Natural Resources, Novosibirsk, Russia, 12–16 November 1998, pp. 407–423. Kluwer Academic Publishers.
- ↑ Bush, E., D.A. Etkin, D. Hayley, E. Hivon, B. Ladanyi, B. Lavender, G. Paoli, D. Riseborough, J. Smith, and M. Smith, 1998. Climate Change Impacts on Permafrost Engineering Design. Environment Canada, Environmental Adaptation Research Group, Downsview, Ontario.
- ↑ Ibid.
- ↑ Ibid.
- ↑ Andersland, O.B. and D.M. Anderson, 1978. Geotechnical Engineering for Cold Regions. McGraw-Hill.;-- Andersland, O.B. and B. Ladanyi, 1994. An Introduction to Frozen Ground Engineering. Chapman & Hall, 352pp.
- ↑ Heiersted, R.S., 1976. Frost Action in Ground. Committee on Frost Action in Soils, Royal Norwegian Council for Scientific and Industrial Res., No. 17, Oslo. (In Norwegian)
- ↑ Instanes, A., 2003. Climate change and possible impact on Arctic infrastructure. In: M. Phillips, S.M. Springman and L.U. Arenson (eds.). Permafrost: Proceedings of the Eighth International Conference on Permafrost, pp. 461–466. A.A. Balkema.
- ↑ Ibid.
- ↑ Instanes. A. and D. Mjureke, in press. Svalbard Airport runway - performance during a climate warming scenario 2000–2050. In: Proceedings of the International Conference on Bearing Capacity of Roads and Airfields,Trondheim, Norway, 27–29 June 2005.
- ↑ Ibid.
- ↑ Instanes A. and Mjureke, 2002b, Op. cit.
- ↑ Hanssen-Bauer, I., O.E.Tveito and E.J. Førland, 2000.Temperature scenarios for Norway: Empirical downscaling from the ECHAM4/OPYC3 GSDIO integration. Norwegian Meteorological Institute, report no. 24/00 KLIMA.
- ↑ Instanes A., 2003. Op. cit.
