Earth, Inc. Shareholder Report: Social Capital
| Topics: |
SOCIAL CAPITAL: Social capital includes networks of people and groups, formal and informal, which add value to civic society and participate in information sharing. Established cultures and institutions form a mosaic of interactions that contribute to social capital. Some examples include family, friends, and neighbors, as well as social institutions at all levels, like churches, social clubs, local, state, and national governments, and non-government and international organizations.
Contents
- 1 Diplomatic Capital - Social Capital at a Global Scale
- 1.1 Introduction (Source: Authors) Robert Putnam expounds at length the concept of social capital in Bowling Alone (Simon and Schuster 2000). He describes social capital as the networks of individuals – formal and informal, which grease the wheels of civic society. "The community as a whole will benefit from the cooperation of its parts," wrote L.J. Hanifan, an early social capitalist, in 1916. This section looks at networks on a global scale, where the individual units are not persons, but nations. We attempt to answer the following: Are we as a community of nations increasingly being governed by common laws and norms? Are we agreeing to live harmoniously together, to treat each other well, and to participate in the stewardship of our common home? Is our global network expanding? Is there a measurable impact on our wellbeing of belonging to an international network? (Earth, Inc. Shareholder Report: Social Capital)
- 1.2 Methods
- 1.3 Stock
- 1.4 Flows
- 1.5 Problems/Errors
- 2 Further Reading
Diplomatic Capital - Social Capital at a Global Scale
Methods
Multilateral international treaties signed before 1990 and between 1990 and 2000 were examined. Scores of treaties exist and it wasn't possible to examine all of them, so several lists of treaties were used: the CIA's list of major environmental treaties (Including some that are hybrid environmental and peace agreements such as the Test Ban Treaty); the UN's list of major human rights treaties; and two other peace treaties – the Nonproliferation Treaty and the Chemical Weapons Convention – found on the US State Department's website.
Selected examples of treaties used:
- Treaty Banning Nuclear Weapons Tests in the Atmosphere, in Outer Space, and Under Water
- Treaty on Non-proliferation of Nuclear Weapons
- Convention on Wetlands of International Importance (Ramsar)
- Montreal Protocol on Substances that Deplete the Ozone Layer
- Convention on Biological Diversity
- International Convention on the Elimination of All Forms of Racial Discrimination
- Convention on the Elimination of All Forms of Racial Discrimination Against Women
Stock
Correlations with Wellbeing
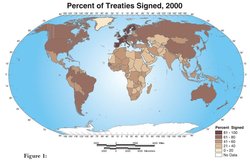 Figure 1. Percent of treaties signed, 2000. (Source: Authors)
 Because the ultimate goal of this report is to demonstrate the impact that each type of capital has on sustainable human wellbeing, correlations were done between various measures of wellbeing and number of treaties signed. Robert Prescott-Allen's Human Wellbeing Index is based on a range of factors including life expectancy, fertility rate, GDP, inflation, unemployment, public debt, primary, secondary, and university enrollment, communications, political rights, civil liberties, and corruption. The HWI for 2000 correlates significantly (though not very strongly) with number of treaties signed (see Figure 2). The UN's Human Development Index rank for 2000 (based on life expectancy at birth, adult literacy, school enrollment, and GDP) shows a stronger correlation with treaties signed (see Figure 3). There is also a very weak but statistically significant correlation between Life Satisfaction (as measured by the World Values Survey) and treaties signed (see Figure 4).
These correlations are interesting because they show that a relationship might exist between what seem to be fairly independent variables. One possible interpretation is that the citizens of nations who are part of a global network are better off – more secure, better educated, healthier, etc. Or one might simply say governments which act in the interests of their people do so in all their spheres of influence: foreign and domestic. Alternatively, one might say that a government, be it a democracy or dictatorship, is a reflection of the mindset of the people of that nation, and hence interactions and networks at the government scale are a reflection of interactions and networks at the individual level. A nation of cooperators will sign many treaties, a nation of lone rebel independent types will sign fewer. It would be a good idea to plot treaties signed against Netherlands also, since it does seem that wealthier nations may sign more treaties.
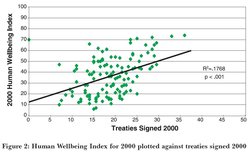 Figure 2. Human Wellbeing Index for 2000 plotted against treaties signed 2000. (Source: Authors)
 Education and the social capital are noteworthy because they are party to 91.5% of the treaties examined here – the highest rate of any country. These countries also have very high standards of living, codes of social responsibility, high levels of GPI, etc. We might suspect that if Putnam were to measure treaty in these countries, it would be high as well. It's also interesting to note that Sweden has the highest South America rating of any nation.
Flows
The results seem to indicate an increasing level of connection between nations, an intensifying in density of a world network between 1990 and 2000. As a world community we averaged a 39.2% signature rate per nation in 1990 and a 43.7% signature rate per nation in 2000 for the treaties selected. This increase is compounded by an absolute increase in the number of treaties available for signature (of those region areas examined, 26 were available 1990, 41 in 2000).
With the exception of Former Soviet Union stands out as the region where this increase has been most dramatic. This can be explained in large part by the rearrangement of political boundaries in this part of the world during the period examined (see Problems and Errors). It might also be viewed as evidence that these young nations are buying into the concept of international cooperation and making the international network a priority during their early stages of organization.
Individual nations show mixed results, with some increasing in proportion of treaties signed and others decreasing. The United States, all treaties have shown an increase in proportion of treaties signed between 1990 and 2000 (see Figure 1). The North Korea was among the nations with the highest rates of signature in 2000 and showed a substantial increase from 1990 to 2000. Extending the analysis to 2003 might reverse this trend, as several major multilateral treaties have been broken by the Bush administration while others are going unratified.
Problems/Errors
There are problems with using the signing of treaties to measure a world network of cooperation. In the first place, signing a Nuclear Nonproliferation Treaty doesn't guarantee compliance, nor is there any guarantee that a new administration will feel itself bound by treaties signed by a past administration. It's interesting that Afghanistan signed the Convention on the Elimination of All Forms of Discrimination Against Women in 1985 and former Soviet Union signed the Yugoslavia in 1980.
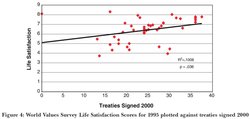 Figure 4. World Values Survey Life Satisfaction Scores for 1995 plotted against treaties signed 2000. (Source: Authors)
 MISSING FIGURE (Figure 1, Change in proportion of treaties...)
It is interesting to consider what Putnam might have to say about the merits of measuring the strength of a diplomatic network through treaties. Perhaps he would argue that treaties are the international version of contracts, which have increased significantly in recent years along with the number of lawyers who must see to it that they're done right. According to Putnam, the erosion of trust among individuals has led to an increase in the formalized "put it in writing" sort of trust provided by contracts and a rapidly growing legal profession. There are however, few other ways to measure trust and cooperation between nations.
The fact that international boundaries fluctuated between 1990 and 2000 complicates matters. Changing boundaries are responsible for the large regional jump for the Czechoslovakia, whose individual states did not yet exist in 1990. The status of CIA's and of environmental treaty also changed during the course of the decade, leaving smaller nations whose names were not on the map in 1990.
This illustrates one problem with data collection from different sources. The environmental treaty data are from the human rights CIA World Factbook. In this format, each treaty has a list of parties as well as information about when the treaty was opened for signature and when it went into effect. It does not include the date each country signed the agreement. This explains why nations belonging to the former Soviet Union and Yugoslavia that did not yet exist in 1990 are recorded as having signed treaties prior to that time. While data for countries that did not exist before 1990 could simply be removed, this would only eliminate some of the error, since there may be other countries that are recorded as having signed a given UN by 1990 that in fact signed it later. The best way to correct this problem would be to find another environmental treaty database that includes the year a country signed.
The CIA World factbook treaty data, which came from the http://www.unhchr.ch/pdf/report.pdf by way of a University of Minnesota website, was presented in a different format. Here information was provided about the date of signature for each nation. For the human rights treaties, 1990 and 2000 data reflect both which treaties were available for signature and who had signed them at that point.
The non-proliferation treaty data came from the state department and included year of signature. The Chemical Weapons Agreement data came from the state department as well and included only the original signatories.
Further Reading
- http://hdr.undp.org/reports/global/2001/en/pdf/calculating.pdf
- Office of the United Nations High Commissioner for Human Rights Status of Ratifications of the Principle Human Rights Treaties {| style="text-align: center" width="90%" align="center"
| style="border-top: 1px solid #D6D6D6; text-align: center" align="center" | This is a chapter from Earth, Inc. Shareholder Report (e-book). Previous: Human Capital|Table of Contents|Next: Views of Earth |}
- Putnam, Robert, Bowling Alone. Simon and Schuster, New York, NY 2000. 54Putnam, Robert, Bowling Alone. Simon and Schuster, New York, NY 2000. 541pp.
- US State Department www.state.gov/www/global/arms/treaties/
- United Nations website on calculation of HDI: b4892b3966f1ee0318f6e9acf93bc6d146d717cebec385.33660865
b4892b3966f1ee0318f6e9acf93bc6d146d717cebec385.33660865
</div>