Global Environment Outlook (GEO-4): Chapter 9
opportunities in the future. Of particular
significance are the risks of crossing
thresholds, the potential of reaching turning
points in the relationship between people
and the environment, and the need to
account for interlinkages in pursuing a
more sustainable path.
Contents
- 1 Chapter 9: The Future Today - Towards 2015 and Beyond (Global Environment Outlook (GEO-4): Chapter 9)
- 2 Main messages
- 3 Introduction What lies ahead? Which of the current environmental, social and economic trends will continue, and which will see dramatic shifts? What will this mean for the environment and human well-being, particularly the most vulnerable ecosystems (Global Environment Outlook (GEO-4): Chapter 9) and groups in society? What will this mean for individual sub-regions and regions, and, collectively, at the global level? Finally, what role can society play today in shaping and sustaining our common future?
- 4 Fundamental Assumption behind the Scenarios
- 5 Snapshots of Four Futures
- 6 Implications of the Scenarios
- 7 Key Messages from the Regions
- 8 Risks and Opportunities of the Future
- 9 Conclusions This chapter has presented four scenarios of plausible futures to the year 2050 – Markets First, Policy First, Security First and Sustainability First – each exploring how current social, economic and environmental trends may unfold, and what this means for the environment, development and human well-being. The scenarios are fundamentally defined by different policy approaches and societal choices, with their nature and names characterized by the theme that dominates the particular future envisioned, such as what comes first. In reality the future, as is the case for the present, will contain elements of each of these scenarios, as well as many others. Still, the scenarios clearly illustrate that the future that will unfold in the long-term will be very dependent on the decisions individuals and society make today. As such, these visions of the future should influence our decisions of today. By providing insights into the challenges and opportunities society will face in the coming half-century, the exploration of these plausible futures can contribute to the discourse about these choices. The scenarios have been presented at both the global and regional levels, because an understanding of global environmental change and its impacts requires an understanding of what is happening in different regions of the world. What happens in each region is very much influenced by what occurs in other regions and the world as a whole. Still, while there is only one global environment, each region and each person experiences it in their own way. As such, the challenges and opportunities, and even the perspectives on the future differ widely across regions and individuals. None of the scenarios describes a utopia. Even though some improvements are seen and there is an indication of a slowing of the rate of change in some aspects of global environmental change, some problems remain persistent in all of the scenarios. In particular, climate change (Global Environment Outlook (GEO-4): Chapter 9) and the loss of biodiversity will continue to present significant challenges, and may eventually pose the danger of crossing critical thresholds in the Earth system. Similarly, with respect to human well-being, significant advances are achievable, particularly in Sustainability First, but even these will take time, and significant inequities will remain by the end of the scenario horizon.
- 9.1 Technical Annex
- 9.1.1 Contributors Hundreds of people and organizations were involved in preparing this chapter, building upon the four scenarios first introduced in GEO-3. The following paragraphs highlight the stakeholders and process of developing the GEO-4 scenarios. The structure of collaboration followed in the process of developing the chapter provided for an organized means of contribution from a large group of participants and for wider ownership among as many people as possible of the process and its outcomes. The three coordinating lead authors (CLAs) and chapter coordinators oversaw the development of the chapter. Regional team leaders, quantitative modellers, and an expert on facilitating participatory processes comprised the chapter expert group (CEG) and are listed as lead authors (LAs). In addition, primarily for the purpose of providing the regional contributions, a group of about 10 experts per region was chosen by the regional team leaders, in consultation with the regional coordinators of the UNEP Division of Early Warning and Assessment and others. Recognizing the impossibility of the above groups to be truly representative or fully versed in all areas required for the development of the chapter, other regional and modelling experts were also invited to provide a broader range of perspectives and specific expertise. Throughout the process, the team was assisted by Bee Successful[14], a management consultancy with expertise in scenario thinking and participatory methods. (Global Environment Outlook (GEO-4): Chapter 9)
- 9.1.2 Process
- 9.1.3 The Models
- 9.1 Technical Annex
- 10 ContributorsCoordinating lead authors: Dale S. Rothman, John Agard, and Joseph AlcamoLead authors: Jacqueline Alder, Waleed K. Al-Zubari, Tim aus der Beek, Munyaradzi Chenje, Bas Eickhout, Martina Flörke, Miriam Galt, Nilanjan Ghosh, Alan Hemmings, Gladys Hernandez-Pedresa, Yasuaki Hijioka, Barry Hughes, Carol Hunsberger, Mikiko Kainuma, Sivan Kartha, Lera Miles, Siwa Msangi, Washington Odongo Ochola, Ramón Pichs Madruga, Anita Pirc-Velkarvh, Teresa Ribeiro, Claudia Ringler, Michelle Rogan-Finnemore, Alioune Sall, Rüdiger Schaldach, David Stanners, Marc Sydnor, Bas van Ruijven, Detlef van Vuuren, Peter Verburg, Kerstin Verzano, and Christoph ZöcklerChapter review editor: Christopher MagadzaChapter coordinators: Munyaradzi Chenje and Marion Cheatle (Global Environment Outlook (GEO-4): Chapter 9)
- 11 Notes This is a chapter from Global Environment Outlook (GEO-4): Environment for Development (e-book). Previous: Chapter 8 (Global Environment Outlook (GEO-4): Chapter 9) (Global Environment Outlook (GEO-4): Chapter 9) |Table of Contents (Global Environment Outlook (GEO-4): Chapter 9)|Next: Chapter 10 (Global Environment Outlook (GEO-4): Chapter 9)
Chapter 9: The Future Today - Towards 2015 and Beyond (Global Environment Outlook (GEO-4): Chapter 9)
Main messages
This chapter builds on previous chapters by exploring how current social, economic and environmental trends may unfold along divergent development paths in the future, and what this might mean for the environment, development and human well-being. It presents four scenarios to the year 2050, using narrative storylines and quantitative data to explore different policy approaches and societal choices at both global and regional levels. The main messages of the scenarios – Markets First, Policy First, Security First and Sustainability First – are:
There is a need to address interlinkages among numerous environmental issues, such as air (Air pollution) and water pollution, land degradation, climate change, and biodiversity loss. There is also a need to link environment with development issues, such as extreme poverty and hunger, implementation of the MDGs, and addressing human vulnerability and well- being. This addresses one of the statements in Our Common Future, which says “the ability to choose policy paths that are sustainable requires that the ecological dimensions of policy be considered at the same time as the economic, trade, energy, agricultural, industrial and other dimensions – on the same agendas and in the same national and international institutions.”
For a range of indicators, the rate of global environmental change slows or even reverses towards the middle of the century. In all scenarios, the rates of cropland expansion and forest loss steadily decline over the scenario period. The rate of water withdrawals eventually decreases in all scenarios, except Security First. Some scenarios also show a slackening in the tempo of species loss, greenhouse gas build- up, and temperature increase. The slowing down of these global indicators is due to the expected completion of the demographic transition, the saturation of material consumption (Consumer society), and technological advances. This slowing down is important because it gives us hope that the society and nature can more successfully catch up to the pace of change and adjust to it before experiencing many negative consequences.
Despite a possible slowing down of global environmental change, the peak rate and end point of change differs strongly among scenarios. The higher the rate of change, the greater the risk that thresholds in the Earth system will be exceeded in the coming decades, resulting in sudden, abrupt or accelerating changes, which could be irreversible. Differing rates of change lead to very different end points for the scenarios. Under Markets First, 13 per cent of all original species are lost between 2000 and 2050 as compared to 8 per cent under Sustainability First. The range in 2050 for atmospheric CO2 concentration is over 560 ppm in Markets First as compared to about 475 ppm under Sustainability First. It is expected that the risk of exceeding thresholds increases with a higher level of change, and that this change could be sudden rather than gradual. For example, the GEO-4 scenarios showing the fastest rate of increase in fish catches are also accompanied by a significant decline in marine biodiversity, leading to a higher risk of fisheries collapse by mid-century.
Investing in environmental and social sustainability does not impair economic development. Scenarios, including increased investment in health, education, and environmentally benign technologies result in equally large and more equitably distributed economic growth on a per capita basis in most regions as those that do not. The levels of GDP per capita are particularly higher in Sustainability First and Policy First than Markets First and Security First in nearly all of the currently less developed regions.
Relying on the market alone is unlikely to achieve key environmental and human well-being goals. The extreme emphasis on markets in Markets First results in significant increases in environmental pressures and only slow down advances in achieving social targets. Alternatively, the increased levels of investments in health, education and the environment, along with increased development assistance and new approaches to lending in Policy First and Sustainability First make for significantly faster progress, without sacrificing economic development in most regions.
Greater integration of policies across levels, sectors and time, strengthening local rights, and building capacity help achieve most environmental and human well-being goals. Additional action under Sustainability First – integrating governance across levels, sectors and time, strengthening local rights, and building capacity – lead to greater improvements and slower degradation than in Policy First. Much of this is related to the increased ownership of the issues by the broader public, and the greater legitimacy of policies. Interaction between global and regional processes suggests that concentrating environmental governance at one scale is unlikely to result in appropriate responses to environmental problems with their feedbacks.
Both trade-offs and synergies exist in the efforts to achieve key environmental and human well-being goals. Competition for land is likely as a result of competing goals: the production of biofuels to achieve climate goals, the production of food to achieve food security, and designation of areas for biodiversity. Competition can be expected for water use between the provision of adequate supplies for human activities and the maintenance of adequate in-stream flows for the integrity of aquatic ecosystems. Furthermore, achieving these goals may require the acceptance of rates of economic growth, as presently measured, in the currently highly-developed countries that, while still significant, are lower than would be the case otherwise. Key synergies result from policies that address the drivers of many of the problems. These include investments in health and education, particularly of females, which directly achieve key human well-being goals, and help to address current and future environmental goals by improving environmental management and reducing population (Population growth rate) growth.
The diversity and multiplicity of trade-offs and opportunities for synergy increases complexity for decision-makers, requiring new and adaptive approaches. This complexity should not be ignored. It, however, points to the need for innovative approaches for exploring the options for action to address the intertwined environmental and developmental challenges the world faces.
Introduction What lies ahead? Which of the current environmental, social and economic trends will continue, and which will see dramatic shifts? What will this mean for the environment and human well-being, particularly the most vulnerable ecosystems (Global Environment Outlook (GEO-4): Chapter 9) and groups in society? What will this mean for individual sub-regions and regions, and, collectively, at the global level? Finally, what role can society play today in shaping and sustaining our common future?
 It is unlikely that most trends would continue unabated for decades without changing course. (Credit: Munyaradzi Chenje)
 To imagine what might happen over the next half- year, much less the next half-century is daunting. To imagine the future across national, sub-regional, regional and global levels is even more complex. Given that many processes are already in motion as a result of past decisions, it may be relatively easy to visualize certain trends continuing in the short-term. Still, history shows that much can change, expectedly or unexpectedly, over short periods, and it is unlikely that most trends would continue unabated for decades without changing course. History also shows that some policy decisions take many decades to unfold, for example, sustainable development and mainstreaming the environment. Both have been on the international and national agenda for the 20 years since the report of the World Commission on Environment and Development, Our Common Future, was published, but increasing their uptake remains as urgent today as it did then.
Choices made today on issues of environment for development may only begin to reveal their effects after decades. A major challenge is, therefore, to present stories that make sense in both the short- and long-term. This includes keeping one eye on the status of upcoming milestones. For example, the 2010 Convention on Biological Diversity target to significantly reduce the current rate of biodiversity loss at the global, regional and national levels, and the 2015 internationally agreed targets of the Millennium Declaration, such as those on water and sanitation. At the same time, it is necessary to look further ahead in time to more distant goals, such as stabilizing the levels of greenhouse gas concentrations in the atmosphere.
Based on both regional and global consultations and processes involving many stakeholders, including governments and other organizations, this chapter explores these and other issues by considering the future through the lens of environment for development. The four scenarios consider the priority and cross-cutting issues discussed in the preceding chapters.
They focus on the implications of various actions, approaches and societal choices at regional and global levels for the future of the environment and human well-being. Each scenario outlines a pathway into the future up to the year 2050, shaped by divergent assumptions about these actions, approaches, and choices. Each looks at who is making the key decisions (the dominant actors), how these decisions are made (the dominant approaches to governance) and why these decisions are made (the dominant priorities). The nature and the names of the scenarios are characterized by the theme that dominates the particular future envisioned, that is what comes first. Briefly, the scenarios assume the following:
- Markets First: the private sector, with active government support, pursues maximum economic growth as the best path to improve the environment and human well-being. Lip service is paid to the ideals of the Brundtland Commission, Agenda 21 and other major policy decisions on sustainable development. There is a narrow focus on the sustainability of [[market]s] rather than on the broader human-environment system. Technological fixes to environmental challenges are emphasized at the expense of other policy interventions and some tried-and-tested solutions.
- Policy First: government, with active private and civil sector support, initiates and implements strong policies to improve the environment and human well-being, while still emphasizing economic development. Policy First introduces some measures aimed at promoting sustainable development, but the tensions between environment and economic policies are biased towards social and economic considerations. Still, it brings the idealism of the Brundtland Commission to overhauling the environmental policy process at different levels, including efforts to implement the recommendations and agreements of the Rio Earth Summit, the World Summit on Sustainable Development (WSSD), and the Millennium Summit. The emphasis is on more top-down approaches, due in part to desires to make rapid progress on key targets.
- Security First: government and private sector compete for control in efforts to improve, or at least maintain, human well-being for mainly the rich and powerful in society. Security First, which could also be described as Me First, has as its focus a minority: rich, national and regional. It emphasizes sustainable development only in the context of maximizing access to and use of the environment by the powerful. Contrary to the Brundtland doctrine of interconnected crises, responses under Security First reinforce the silos of management, and the UN role is viewed with suspicion, particularly by some rich and powerful segments of society.
- Sustainability First: government, civil society and the private sector work collaboratively to improve the environment and human well-being, with a strong emphasis on equity. Equal weight is given to environmental and socio-economic policies, and accountability, transparency and legitimacy are stressed across all actors. As in Policy First, it brings the idealism of the Brundtland Commission to overhauling the environmental policy process at different levels, including strong efforts to implement the recommendations and agreements of the Rio Earth Summit, WSSD, and the Millennium Summit. Emphasis is placed on developing effective public-private sector partnerships not only in the context of projects but also that of governance, ensuring that stakeholders across the spectrum of the environment-development discourse provide strategic input to policy making and implementation. There is an acknowledgement that these processes take time, and that their impacts are likely to be more long- term than short-term.
 Each scenario outlines a pathway into the future up to the year 2050, shaped by divergent assumptions about actions, approaches, and choices. (Credit: Munyaradzi Chenje)
 As is the case for most scenarios, these four are caricatures in that the real future will include elements of all four and many others. Furthermore, scenarios are not predictions, nor should they be taken as the most likely of the myriad of possible futures. At most, they paint pictures of a limited number of plausible futures, based upon a coherent and internally consistent set of assumptions about choices by key actors, the progression of other social processes, and underlying system relationships [2]. Finally, in any scenario exercise, there are inherent uncertainties related to both the current state and the behaviour of human and ecological systems. Thus, individual scenarios represent conditional projections based upon assumptions about the underlying human and ecological systems, as well as the actions, approaches, and choices noted above [3].
Despite these challenges, the scenarios presented here provide valuable insights for decision making today. The narratives and numerical elements complement each other, reflecting the approach of most recent scenario exercises [4]. The Technical Annex at the end of this chapter briefly reviews how the scenarios were developed.
Fundamental Assumption behind the Scenarios
Scenario development is traditionally characterized by identifying key drivers and critical uncertainties surrounding their future evolution, making assumptions about how these critical uncertainties will evolve, and exploring the broader implications of these developments. In the GEO-4 conceptual framework, the key drivers of environmental change include: institutional and socio-political frameworks, demographics, economic demand, [[market]s] and trade, scientific and technological innovation, and value systems. This list is much the same as used in GEO-3, as well as in the Millennium Ecosystem Assessment [5] and other recent scenario activities.
Behind these different drivers are the decisions by key actors, such as whether to act reactively or proactively with respect to environmental change. In addition, assumptions are made about key system relationships, such as the precise sensitivity of the climate system to increased concentrations of [[greenhouse gas]es] (GHGs), or the exact effect of a reduction of crop yields on the health of some groups. From this perspective, the evolution of many of the drivers, as well as the pressures, state and impacts, are themselves part of the unfolding of the scenarios and not a priori assumptions. As such, this presentation of the assumptions underpinning the GEO-4 scenarios differs somewhat from similar exercises.
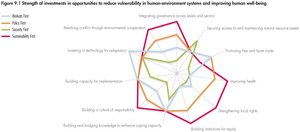 Fig 9.1 Strength of investments in opportunities to reduce vulnerability in human-environment systems and improving human well being.
 Figure 9.1 and Table 9.1 summarize the assumptions underpinning and distinguishing the four scenarios. Table 9.1 considers a series of questions grouped by the key drivers in the GEO-4 conceptual framework. Using the set of opportunities for reducing vulnerability in human-environment systems and improving human well-being presented in Chapter 7 (Global Environment Outlook (GEO-4): Chapter 9), Figure 9.1 illustrates the strength of the investments targeted to these opportunities. Together, these provide more specific information, building on the assumptions provided in the Introduction. They highlight the general character of the scenarios; differences will certainly exist across regions and over time in any given future, just as they do today.
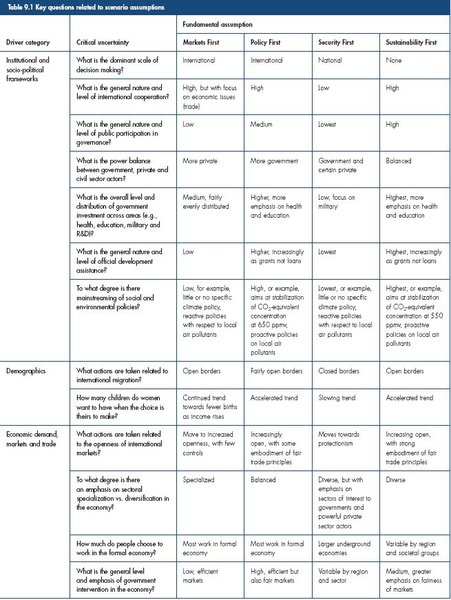 Table 9.1 Key questions related to scenario assumptions.
 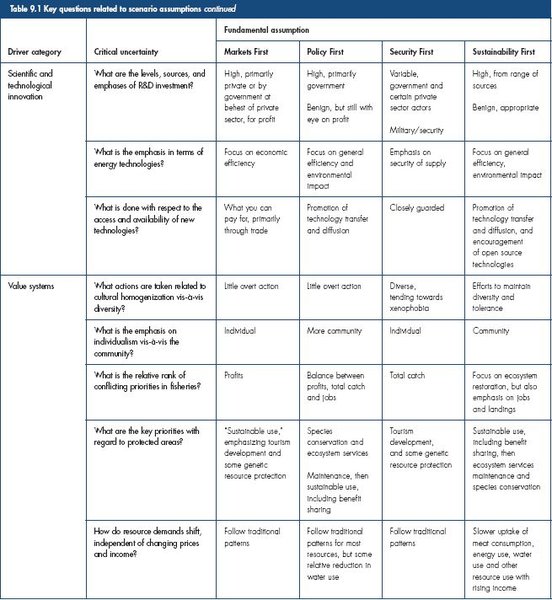 Table 9.1 Key questions related to scenario assumptions, continued.
 Other than for trade, technology and resource access, investments are assumed to be lower in Markets First than in either Policy First or Sustainability First. Sustainability First is distinguished from Policy First by the added emphasis placed on equity and shared governance, particularly at the local level. Not surprisingly, the overall level of investments in these opportunities is assumed to be the lowest in Security First, although this does not rule out significant efforts by particular groups. Each scenario provides challenges and opportunities in the way society addresses environmental issues.
With respect to assumptions about other aspects of the current state and the behaviour of human and ecological systems, key system relationships, such as the levels of environmental robustness and the physical availability of natural resources, are held constant across the scenarios. While it is clear that there is significant uncertainty about many of these factors, varying them across the scenarios would complicate efforts to understand the impacts of the different assumptions about individual and societal choices, which is the primary focus of this exercise.
Snapshots of Four Futures
Looking back to 1987, it is clear that many dramatic changes have occurred in the world. Not surprisingly, it is possible to see developments and trends during this period that support each of the four pathways to the future, as well as other possible futures.
To some, increased international cooperation on climate change issues is an example of the benefits that high-level policy actions can offer for environmental protection. The entry into force of the Kyoto Protocol, the development of global regulations enabling carbon capture technologies and emissions trading, the implementation of national strategies to reduce GHG emissions, and the adoption of various multilateral environmental agreements to address a diversity of challenges, all point to the success of negotiated agreements. The establishment of biodiversity targets for 2010 under the Convention on Biological Diversity provides another example of international agreement on common goals. Recent policy reforms at the regional level have also seen greater integration of policies, sectors and standards across groups of countries, for example, with respect to water management and agricultural practices in the enlarged European Union.
Others are encouraged by what they see as a continued shift in favour of a stronger social and environmental agenda among both governments and citizens. Concerted efforts to promote universal primary and secondary education, and mainstreaming of environmental and social adjustments to GDP figures represent two movements in this direction. The adoption of internationally agreed targets of the Millennium Declaration reflects commitment across the world to address sustainable development challenges. At the local level, a growing level of grassroots and civil society engagement directs energy and attention towards livelihood issues with both local and global relevance, including fair trade.
Less encouragingly, some see an unsettling pattern of conflict and entrenched interests playing out both in and between nations in today’s world, characterized by increasing inequality and social isolation. Heightened security measures that restrict human movement and increase military expenditure lend weight to this view of the world. Instability and conflict have a critical effect on quality of life for millions. Certain international trade policies protect the existing balance of power through increased tariffs and protectionism, while local enclaves can be seen in the form of highly-secure housing developments in cities.
The market economy is seen as the dominant paradigm for fostering growth and human well-being, with diverging opinions about its success. Proponents see the continued rise in oil consumption and prices as fuel for considerable growth, while skeptics focus on its negative social and environmental consequences. Some argue that the role of governments is tilted in favour of economic objectives, even while it may be shrinking overall in the face of increasing corporate influence in policy decisions and trade agreements.
These varied aspects of the recent and today’s world exert very different pressures on human decisions and actions, with implications for the environment and human well-being. A continuation or change in any of these patterns could have a pivotal influence on major issues at local, regional and global levels. Government leadership, market incentives, protectionist motives or unconventional approaches could mean the difference between marked improvement and steady decline on such prevailing environmental concerns as freshwater (Freshwater biomes) quality and availability, land degradation, biodiversity conservation, and energy use with its associated GHG emissions and climate change effects. Socially, these different approaches could translate into radically different situations regarding equity and distribution of wealth, peace and conflict, access to resources and health services, and opportunities for political and economic engagement.
Which of these trends will be the most dominant over the next decades? This is open to debate. In the end, the answer will likely differ across regions and over time. This section presents snapshots of the four futures considered in this chapter.
Markets First
The dominant characteristic of this scenario is the tremendous faith placed in the market to deliver not only economic advances, but also social and environmental improvements. This takes several forms: an increased role of the private sector in areas that were previously dominated by governments, a continued movement towards freer trade, and the commoditization of nature. A key question it poses is: how risky is it to put the [[market]s] first?
Most regions see a significant increase in the privatization of education, health and other social services, extending even to the military, as governments seek to achieve economic efficiency and reduce their financial burden. Research and development becomes increasingly dominated by private organizations. Assistance to developing countries moves even further in the direction of direct investment and private donations, with little change in official development assistance.
International trade accelerates as the World Trade Organization grows. Although no global free trade zone is achieved, pre-existing regional free trade agreements are strengthened and new ones emerge, for example, in South Asia (SAFTA). In addition international economic cooperation grows, both within and among regions. Growing South-South cooperation, such as between Asia and the Pacific, Africa, and Latin America and the Caribbean, stands out in this regard.
Efforts to increase privatization and trade are accompanied by an increase in measures to put prices on ecosystem services and turn them into commodities. Although this forces people to better recognize the value of these services, it is not the primary intent of these efforts, which are driven more by ideological aims. The commoditization and economic exchange of goods such as water, genetic material, and traditional knowledge and culture, dramatically increases. With these changes, the size of the “commons,” both globally and locally, shrinks significantly.
Formal environmental protection progresses slowly, as it competes against efforts to increase economic investment and expand trade. The Kyoto Protocol is only ineffectively enforced and there is no significant international follow-up after its expiry in 2012. Multilateral environmental agreements generally defer to trade and other economic agreements when they come into conflict.
The effects of these choices are seen in many aspects of society and the environment. The growing economy, with its seemingly insatiable demand for energy, the continued dominance of fossil fuels, and the limited efforts to reduce emissions result in continued rapid growth in equivalent CO2 emissions for the world as a whole.
In terms of regional air (Air pollution emissions) pollutants, the pattern varies by region as increasing incomes bring calls for greater controls. In regions such as North America and Western Europe, reductions continue, although these slow somewhat over time. Regions where economic growth reaches sufficient levels see increases followed by declines, particularly for those pollutants most detrimental to human health, such as particulates and SO2. Other regions, such as parts of Latin America and the Caribbean, Africa and Central Asia continue to see rises in pollutant levels.
A number of forces, most notably the increased demand for food, freer trade, the phasing out of agricultural subsidies, technological advances, the growth of cities, and increased demand for biofuels affect land use (Land-use and land-cover change) in quite different ways across the world. Globally, there is actually a slight decline in land devoted to food crops, but a rise in grazing land. The total forest area declines, but starts to recover later in the period, albeit with a continued slight decline in mature [[forest]s]. All regions see an intensification of agriculture, bringing increased worries about soil degradation. In Latin America and the Caribbean, and Africa, where the intensification is not accompanied by a net reduction in cropland, these concerns are severe.
The privatization of water and improvements in technology lead to increases in water use efficiency in most regions, but the emphasis is primarily on the augmentation of supply. At the same time, the decline in subsidies in most regions affects those less able to pay, be they agricultural, industrial or domestic users. Still, with growing populations, particularly in regions where demand reaches a point of saturation or where climate change results in reduced precipitation, the number of people living in river basins with severe water stress grows significantly. Even though the percentage of wastewater treated grows, the total volume of untreated wastewater continues to increase rapidly.
Terrestrial and marine biodiversity pay a high price. There is a continued decrease in mean species abundance globally, with the largest losses in sub-Saharan Africa, parts of South America, and some areas in Asia and the Pacific. The poor quality of the management of some protected areas, the opening up of others, and the introduction of alien invasives and genetically modified species all contribute to this decline. Although agriculture, through its effect on land use, historically played the dominant role in the reductions in terrestrial biodiversity, its share of changes is eclipsed by climate change and the growth of infrastructure. In fact, except for Africa, and Latin America and the Caribbean, shifts in land-use (Land-use and land-cover change) patterns reduce the pressure that agriculture puts on terrestrial biodiversity. The continued growth in landings from marine fisheries in many regions belies the increasing loss of marine biodiversity.
Policy First
The dominant characteristic of this scenario is the highly centralized approach to balancing strong economic growth with a lessening of the potential environmental and social impacts. A key question is whether the slow and incremental nature of this approach will be adequate.
The first decades of the 21st century see concerted efforts by governments to solve the pressing problems facing the world as it entered the new millennium. Many of these, for example the HIV/AIDS crisis and the lack of access to safe water in many parts of the world, were already evident. Others, such as climate change, make their presence felt, portending much more serious consequences in the future if action is not taken. The pattern of responses to the environmental challenges is characterized by a move towards a more “holistic” approach to governance, particularly in the management of the economy. Economic growth, while seen to be necessary, is no longer pursued without significant consideration of its social and environmental impacts. More specifically, uncontrolled [[market]s] are recognized as being limited in their ability to provide many of the public goods-and-services societies hold dear, including the maintenance of key ecosystem services and the stewardship of non-renewable resources. New theories point to the importance of these goods-and-services to longer-term economic sustainability, nationally and internationally. These help to lend support to the increased public investments in, among others, health, education (particularly of women), R&D and environmental protection, even when this requires increased government expenditures. It is also reflected in the richer nations ultimately meeting targets for foreign aid to poorer countries set in the previous century.
National governments and international institutions, including the United Nations and regional organizations, lead in these efforts. In fact, the increasing economic and political integration in the regions is one of the hallmarks of the changes. Previously existing institutions, such as the European Union, expand, while new ones such the Asia Pacific Community for Environment and Development, are formed. For the most part, the private and civil sectors follow and support the efforts of governments.
Although specific actions taken related to environmental governance vary across and within regions, there are common elements, due in large part to the increased coupling of national institutional arrangements to international agreements. “Perverse” subsidies, which encourage the overexploitation of resources, ranging from fossil fuels to water to agricultural land to marine fisheries, are gradually reduced, if not eliminated. Public investments in science and technology grow, and increasingly emphasize environmental concerns, particularly those of the most vulnerable groups. The designation of both terrestrial and marine protected areas increases, and efforts are broadly, albeit not uniformly, effective in terms of preventing [[land-use (Land-use and land-cover change)] change] in these areas.
The effects of these choices are seen in many aspects of society and the environment. Climate change and its associated impacts remain a primary concern. A series of international agreements, the removal of subsidies and investments in R&D motivate concerted efforts to increase energy efficiency and move to more low-carbon and renewable sources, including biofuels. Still, total energy consumption continues to increase. Furthermore, in spite of significant growth in renewable sources of energy, oil and gas continue to dominate fuel supplies.
The increased demand for biofuels and food, even in the presence of technological advances and the phasing out of most agricultural subsidies, results in a significant increase in land devoted to pasture, even as land for crops falls slightly after reaching a peak. Much of this increase comes at the expense of forest land.
Strong investments to increase supply and reduce demand, particularly through efficiency improvements, help to alleviate concerns over freshwater (Freshwater biomes) availability in much of the world. Still, growing populations and economic activity continue to strain resources, particularly in the developing regions. Globally, the population living under severe water stress continues to rise, with almost all of this increase occurring in those regions exhibiting continued population (Population growth rate) growth. Social and political institutions, with efforts to better manage shared resources, help to limit the impacts of this stress in most regions.
The increased demand also places a strain on the quality of water resources. While treatment of wastewater expands in all regions, it trails the requirements. The total global volume of untreated wastewater continues to grow, even as the percentage treated increases.
Climate change has a dramatic effect on terrestrial biodiversity. Agriculture is the other significant contributor to these losses. The most severely affected areas are in Central Africa, parts of Latin America and the Caribbean, and parts of Central Asia, because these regions see the greatest changes in land use as biodiversity protection has to compete with food production and the harvesting of biofuels.
The demand for food extends to the world’s oceans, with most parts experiencing an increase in landings. However, in most cases this also involves fishing further down the food chain. The two areas experiencing the most improvement in diversity of the catch – the northwest Atlantic and the south Pacific around Antarctica – do so in part by reducing their landings.
Security First
The dominant characteristic of this scenario is the emphasis on security, which consistently overshadows other values. It is a fairly narrow notion of security, implying increased limits on how people live, both physically and psychologically. Whether people reside behind actual walls or outside, their movements are not nearly as free as might have been imagined looking from the start of the century. Where increased restrictions on migration have reduced the movement of people, the continuation and extension of trade barriers limit the movement of goods across borders. Much of this is driven by continued conflict in many parts of the world, government mandate and lack of resources for many individuals. Thus, at the same time that the world becomes more crowded as population (Population growth rate) grows, it feels even smaller by many of the choices made by society. A key question is: what might be the broader implications of security first?
Expenditures on security, both public and private, grow at the expense of investments on other priorities, including in R&D in science and technology. Many governments hand over the provision of public services to private interests to improve efficiency and save costs. Both official development assistance (ODA) and foreign direct investment (FDI) contract overall, or become more focused and subject to greater conditionality. International trade follows similar patterns. Internationally, the more unsavoury aspects of the ideas championed by many anti-globalization campaigners in the past prevail. Domestically, broad-based social safety nets either do not develop or deteriorate.
Governments, particularly those that retain strong control at the national level, continue to play a strong role in decision making, but they are increasingly influenced by multinational corporations and other private interests. Very little progress is achieved in reducing corruption in official circles. International institutions, both at the regional and global levels, see their authority decline. Public participation and the role of the civil sector, both domestically and internationally, are increasingly marginalized.
Not surprisingly, environmental governance suffers as a result of these wider changes; where it is “successful,” this is usually to the benefit of particular sectors of society. Most new technologies pay little regard to environmental impacts, and there is a degree of regression in practices, such as the use of inorganic fertilizers. There are various patterns in terms of formal incentives and disincentives related to resource use, but the logic behind these is rarely from an environmental perspective. Globally, there is no expansion of the terrestrial or marine protected area network, and an overall decrease is seen in the level of protection from exploitation of existing protected areas. Also, key environmental services are increasingly the focus of competition and conflict.
The effects of these choices are seen in many aspects of society and the environment. Total energy use increases significantly, reflecting a very slow rate of improvements in energy efficiency. Furthermore, after slow growth in the early decades of the century, there is a dramatic resurgence in the use of coal to the point where it is rapidly approaching the levels of use of natural gas and oil. The net result of these and other forces is a strong rise in the level of atmospheric CO2, with no sign of a slowing of the rate of increase. The planet continues to warm, with little hint of a slowing down of the rate of increase.
Total SOx emissions change little. Reductions in Europe, North America and West Asia have been balanced by increases elsewhere. NOx emissions climb in every region. The health effects of these emissions, particularly in the increasingly crowded urban areas, are felt across the globe.
With the changing climate, the extent of forest in the Arctic increases as species spread north. Europe also sees some increase in its forest area, as does North America, although much of the increase in the latter is not considered mature forest. These patterns are the exception though, as most regions and the world as a whole witness loss of forests, which are converted to food crops and especially to grazing land. Africa, and Latin America and the Caribbean stand out in this regard. The slow growth in income and continued concentration of land ownership in these regions, to a certain extent, slow these trends. The downside to this is seen in the accompanying slow growth in food availability, which is also reflected in continuing high levels of childhood malnutrition in these regions.
The changing climate also combines with growing populations and greater economic activity to further strain [[freshwater (Freshwater biomes)] resources] around the globe. The slow advances in water use efficiency are not able to prevent dramatic increases in water stress. Globally, there is a dramatic rise in the number of people living in river basins facing severe water stress. The number in Africa alone is nearly as many people as lived in the entire region at the start of the century. Conflicts are witnessed over shared resources, both within and between countries.
Equally concerning is the quality of water. The volume of wastewater produced vastly exceeds the increases in treatment capacity; the net result is a dramatic rise in the amount of untreated wastewater. Again, the poorer regions of the world face the greatest impact, with the increases being significantly higher in places such as West Asia and Africa. The resulting effects in the form of water-borne diseases are significant.
In the absence of concerted efforts, climate change, general population growth, urbanization, and the growth in demand for food and traditional biofuels have significant impacts on terrestrial biodiversity. The expansion of agriculture is eclipsed by increased infrastructure and the changing climate as the primary drivers of biodiversity loss. The loss of species abundance is widespread but certain areas, for example sub-Saharan Africa, parts of Latin America and the Caribbean, and parts of Asia and the Pacific, see greater losses. In addition to these broad patterns of change, some localized areas experience staggering losses as a result of armed conflict.
The pressure on the world’s oceans increases dramatically, particularly in the first few decades of the century. Fish catches increase in most areas, but with a decline in the quality of the catch in most cases. There is some decline in the catch in the later years with the changes in quality varying by area. At the same time, efforts to expand aquaculture and mariculture in many regions increase at the expense of critical ecosystems, including mangrove forests and coral reefs.
Sustainability First
The dominant characteristic of this scenario is the assumption that actors at all levels – local, national, regional and international, and from all sectors, including government, private and civil – actually follow through on the pledges made to date to address environmental and social concerns. This implies behaviour that honours not only the letter, but also the spirit of these promises.
The start of the 21st century sees strong calls on governments at all levels to address the myriad of problems facing the world, reflected by national and international responses such as the Millennium Declaration. At the same time, groups from the private and civil sectors under such rubrics as corporate social responsibility, Environmental Justice, fair trade, socially responsible investment, and organic and slow food, as well as key individuals with significant personal resources, do not wait for governments to act. They gain momentum and increase influence as their numbers of adherents pass key thresholds.
Reforms take place in both national and international institutions, opening these up to more balanced participation. The rules governing international trade are gradually reformed over time to address broader issues than just economic efficiency. The nature and amount of ODA and FDI evolve to make these more beneficial to all parties. The world witnesses a significant increase in the allocation of public resources to social and environmental concerns, and less towards the military. Underpinning much of this is an underlying but not always explicit compact between the richer and the poorer nations to more seriously address the needs of the latter.
Governments play an important role through actions taken to address social and environmental concerns, particularly in integrating these into all aspects of decision making. The biggest impacts, however, result from their willingness to create the space for, and learn from, actions in the private and civil sectors. The more open and partnership-based approaches result in higher levels of cooperation and compliance, stemming from the increased relevance and legitimacy of government actions. The stage is set for different actors to more easily play their appropriate roles in addressing issues of common concern, drawing on the strengths and minimizing the weaknesses of each.
The evolution of environmental governance reflects both the complementarities and competition between social and environmental goals. In areas such as energy and water provision, efforts are made to balance the desire to reduce overall resource use with the need to address issues such as fuel, poverty and water stress. Increased public and private investments in water infrastructure and energy resources and technologies emphasize meeting these and other challenges in more environmentally friendly ways. Choices have to be made with respect to land use in balancing biodiversity protection and food security, not to mention the increased demand for biofuels. There is an increase in the number of terrestrial and marine areas designated for protection; however, the designations emphasize sustainable use and ecosystem services maintenance, rather than simply species conservation.
The effects of these choices are seen in many aspects of society and the environment. Climate change continues to remain a persistent problem. Through significant efforts, the growth in the level of atmospheric CO2 is limited, but it will still be a few decades before stabilization is reached. After rising, the rate of change in global temperature falls and continues to decline. Still, it is not possible to avoid potentially significant warming and sea-level rise. At the same time, hope is seen in the transformations in the energy sector. Total energy use increases, but the mix of fuels changes significantly. Oil use peaks, and the use of coal declines to the point that more energy is produced by solar and wind. Both modern biofuels and the latter make up a significant fraction of total energy supply, with natural gas as the overall dominant source of energy.
With respect to more local air pollutants, marked declines are seen in NOx and SOx emissions. North America and Europe were already seeing reductions at the start of the century, but all regions follow their lead and at a rapid rate.
With climate change, the extent of forest in the Arctic increases as species spread north. Efforts to address climate change also have an effect on land use (Land-use and land-cover change), with significant amounts of land devoted to the growth of biofuels. Increased area devoted to food crops in Africa, and Latin America and the Caribbean, even in the light of improved yields, is offset by land taken out of production elsewhere. The expansion of grazing land primarily comes at the expense of forests. The increase in food availability is fundamental in reducing hunger, however. Furthermore, the loss of forest land slows significantly over time.
The widespread adoption of integrated water management strategies with a strong emphasis on demand management and conservation helps to reduce the growth in water stress. Still, in part due to the varying patterns of population (Population growth rate) growth and shifting patterns of precipitation as part of the changing climate, increases are seen in water stress in some regions, notably Africa, Asia and the Pacific, and West Asia. In almost all regions, though, programmes have been put in place to help people deal with this concern.
The efforts to reduce the growth in water demand also play a role in maintaining and improving water quality around the world. Treatment capacity keeps pace with the increasing amounts of wastewater, such that the total volume of untreated wastewater changes very little. However, the story differs among regions. Some, such as North America almost completely eliminate untreated wastewater while others, such as Latin America and the Caribbean, see small increases in volume even as the percentage treated rises.
Efforts to turn the tide on biodiversity loss are significant, but these face strong challenges due to competing demands for food and fuel, and, most importantly, climate change. The latter becomes, by far, the most important driver of species loss. Parts of Africa, Asia and the Pacific, and Latin America and the Caribbean, also face increased stress due to agricultural expansion, resulting in more significant losses in these areas.
Driven by increased food demand, many parts of the oceans experience increased pressure from fishing, but some experience decreased pressure. Significantly, the mean trophic level of the fish caught stays the same or increases in many parts of the ocean. Designated marine sanctuaries play a key role in these cases. In addition, efforts are made to reduce the potential impacts of aquaculture and mariculture on vulnerable coastal ecosystems.
Implications of the Scenarios
The previous section has provided glimpses of how the future might play out under the assumptions of each of the four scenarios. What are the implications in each case for the environment and human well-being? Following the structure of this report, this section will look in turn at the atmosphere, land, water and biodiversity, and then human well-being and vulnerability. Since they drive many of the results, it begins with a brief look at some overall demographic and economic developments in the different scenarios.
Demographic and economic change
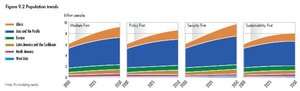 Fig 9.2 Population trends. (Note: IFs modeling results.)
 Global population continues to grow in each of the scenarios (see Figure 9.2). It reaches its highest level, around 9.7 billion, by 2050 in Security First. In Sustainability First, there are just under 8 billion people at this time, and very little further growth is expected. Policy First and Markets First see global population reach about 8.6 and 9.2 billion people, respectively. In comparison, the latest UN projections [6] are 7.79, 9.19, and 10.76 billion people by 2050 for the low, medium and high variants, respectively. These differences reflect a number of factors, including differences in female education, population policies and income growth in the different scenarios. The largest absolute growth occurs in Asia and the Pacific, but in terms of percentage growth, it is much larger in Africa and West Asia. Europe is the only region that experiences absolute declines during this period, although these are quite small, particularly in Sustainability First.
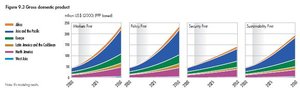 Fig 9.3 Gross domestic products. (Note: IFs modeling results.)
 Global economic activity grows significantly over the scenario period, particularly in Markets First and Policy First, both of which see an approximate fivefold increase in global GDP (see Figure 9.3). Even in Security First, there is nearly a tripling of economic activity. For a comparison, the latest Global Economic Prospects [7] describes three scenarios with average annual growth ranging from 2.8–3.7 per cent between 2005 and 2030 (using market exchange rates); the scenarios presented here have growth rates ranging from 2.6–3.9 per cent over the same period (also using market exchange rates). As shown in Figure 9.4, this growth is accompanied by significant increases in global trade, most notably in Markets First. Due in part to their more rapid population (Population growth rate) growth, the absolute size of the economies in Africa and West Asia grow at about the same rate as the Asia and the Pacific economy in Markets First, Policy First and Sustainability First and somewhat faster in Security First.
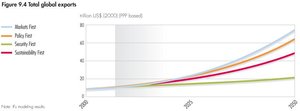 Fig 9.4 Total global exports. (Note: IFs modeling results.)
 Given its somewhat lower population growth and similar economic growth, Policy First sees faster growth than Markets First in global average GDP per capita, with an increase of nearly 3.5 times over the period of the scenarios (see Figure 9.5). Slightly slower growth occurs in Sustainability First, but global average GDP per capita still more than triples; Security First sees less than a doubling. The most rapid growth occurs in Asia and the Pacific in all scenarios. As with the other currently less well-off regions, somewhat greater growth is seen in Policy First and Sustainability First than Markets First, with Security First having the lowest growth in all regions and the least convergence across regions.
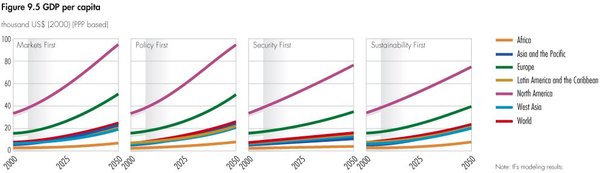 Fig 9.5 GDP per capita. (Note: IFs modeling results.)
 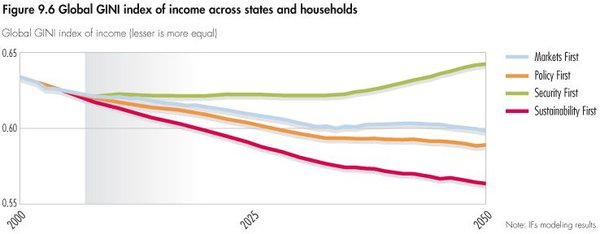 Fig 9.6 Global GINI index of income across states and households. (Note: IFs modeling results.)
 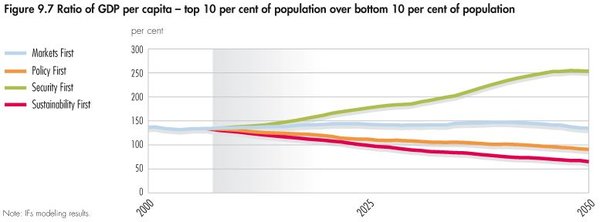 Fig 9.7 Ratio of GDP per capita – top 10 per cent of population over bottom 10 percent of population. (Note: IFs modeling results.)
 Atmosphere
Chapter 2 (Global Environment Outlook (GEO-4): Chapter 9) highlighted the key issues related to the atmosphere. Beginning with energy use, a key pressure, the scenarios illustrate dramatically different possible futures for the atmosphere.
Energy Use
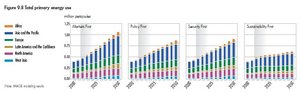 Fig 9.8 Total primary energy use. (Note: IMAGE modeling results.)
 Globally, world energy use is expected to increase in all scenarios, driven mostly by increasing energy use in low-income countries (see Figure 9.8). However, per capita energy use in high-income countries remains at a much higher level than in low-income countries (see Figure 9.9). Primary energy use in Policy First and Security First increases from about 400 EJ in 2000 to 600–700 EJ in 2030 and around 800–900 EJ in 2050. This trajectory is consistent with mid-range scenarios in literature[8]. In relative terms, population (Population growth rate) growth is a more important factor in growth in Security First, while income growth plays a more important role in Policy First. The trajectory in Markets First lies substantially above the other two scenarios, driven by rapid income growth and more material-intensive lifestyles. In contrast, Sustainability First follows a lower trajectory. Here, a less material-intensive orientation and considerably higher efficiency – partly induced by global climate policy – contributes to the lower energy use.
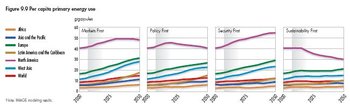 Fig 9.9 Per capita primary energy use. (Note: IMAGE modeling results.)
 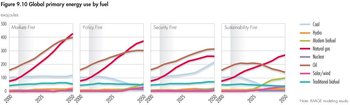 Fig 9.10 Global primary energy use by fuel. (Note: IMAGE modeling results.)
 In terms of the energy mix, fossil fuels continue to dominate energy supply in all four scenarios (see Figure 9.10). Nevertheless, important differences exist across the scenarios. In Markets First, relaxation of current tensions in international energy [[market]s] allow for rapid growth of oil and natural gas use worldwide. In Policy First, moderate climate policies reduce growth of oil demand, bring down coal use, and stimulate the use of bioenergy and zero-carbon options, such as wind, solar and nuclear power (Nuclear power reactor). Some of the remaining fossil fuel use in the power sector is combined with [[carbon capture] and storage]. In Security First, a totally different picture emerges. Here, growth of oil and natural gas is reduced due to remaining tensions in international energy markets. This is replaced by an increase in coal use. Finally, in Sustainability First a similar picture emerges as in Policy First, but trends are much stronger. Here, as a result of stringent climate policy not only is coal use reduced, but so is oil use. Oil is partly replaced by a strong increase in bioenergy use. While natural gas use increases, its consumption in the power sector is, after 2020, mostly combined with carbon capture and storage.
Emissions of regional air pollutants and greenhouse gases
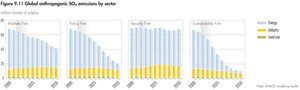 Fig 9.11 Global anthropogenic SOx by sector. (Note: IMAGE modeling results.)
 At the global level, energy use dominates the anthropogenic emissions of both regional air pollutants, using SOx emissions as a general indicator, (see Figure 9.11) and [[GHG]s] (see Figure 9.12). The relationship between total energy use and emissions is strongly influenced by a variety of other factors, particularly government policies directed at emission controls.
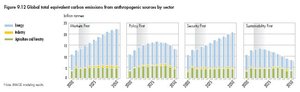 Fig 9.12 Global total equivalent carbon emissions from anthropogenic sources by sector. (Note: IMAGE modeling results.)
 The total emissions of regional air pollutants decline in all scenarios other than Security First. This is a clear consequence of the lack of emissions controls in that scenario. The dramatic declines in Policy First and Sustainability First reflect a combination of strong policy efforts to reduce emissions per unit energy use as well as relatively slower overall growth in energy use and moves towards cleaner fuels. Markets First exhibits an overall decline, but the overall increase in economic activity keeps it from matching the reductions in Policy First and Sustainability First.
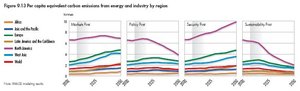 Fig 9.13 Per capita equivalent carbon emissions from energy and industry by region. (Note: IMAGE modeling results.)
 The largest increase in GHG emissions over the scenario horizon, more than a doubling, occurs under Markets First, reflecting its increase in energy use and the lack of effective mitigation policies, highlighted by a lack of progress in reducing per capita emissions (see Figure 9.13). For similar reasons, Security First also shows a large increase, although this is somewhat smaller, because of more moderate economic growth. In comparison, emissions under Policy First and Sustainability First peak and subsequently decline during the scenario period. This is mainly driven by the implementation of policies to reduce GHG emissions. In the early years, however, Policy First actually has the highest emission of all scenarios due to higher levels of emissions from [[land-use (Land-use and land-cover change)] changes]. These emission levels are all within the range of projections considered in the latest IPCC reports [9]. (For further detail on comparing the climate related projections in the scenarios with those presented in the IPCC, see Box 9.1)
|
Box 9.1 Comparing these climate projections with the Fourth IPCC assessment[10] |
|
The models being used in this scenario exercise are also being used by the Intergovernmental Panel on Climate Change (IPCC), ensuring consistency between the projections in this report and in the latest IPCC reports, published in 2007 as its Fourth Assessment Report (see [[Chapter 2 (Global Environment Outlook (GEO-4): Chapter 9)]2]). Due to timing issues, not all model parameters have been updated to the latest IPCC findings. The consequences for the conclusions are marginal, as described here:
|
Atmospheric CO2 concentration and global mean surface temperature
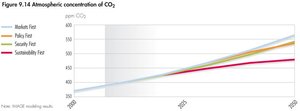 Fig 9.14 Atmospheric concentration of CO2. (Note: IMAGE modeling results.)
 The trend in global CO2 concentration reflects the trends in emissions and the uptake of atmospheric CO2 by the ocean and biosphere. The highest CO2 concentration is reached in Markets First, exceeding 550 ppm in 2050 (see Figure 9.14). Policy First and Security First result in about the same concentration, around 540 ppm in 2050, despite having distinctly different pathways over the period. In case of Security First, the increases in CO2 Policy First actually has the highest increases in CO2 concentration at the start of the scenario period, but the rate of increase slows significantly by the end of the period. Sustainability First results in the lowest concentration by a significant margin, about 475ppm in 2050, and is also the only scenario where the concentration has approached stabilization. concentration are lower in the beginning of the scenario period because of the lower emissions, but they continue to increase at an accelerating rate.
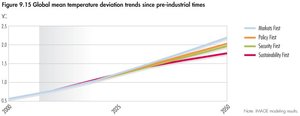 Fig 9.15 Global mean temperature deviation trends since industrial times. (Note: IMAGE modeling results.)
 All scenarios show a distinct increase of the global mean temperature, ranging from about 1.7°C above pre-industrial levels in 2050 in Sustainability First to about 2.2°C in Markets First, with Policy First and Security First reaching about 2.0°C (see Figure 9.15). These represent the actual changes in temperature in 2050; due to inertia in the climate system, additional warming would be expected in all of the scenarios irrespective of emissions that might occur after 2050.
Sea-level rise
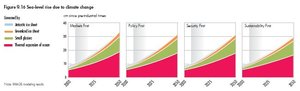 Fig 9.16 Sea-level rise due to climate change. (Note: IMAGE modeling results.)
 The processes governing sea-level rise as a result of climate change, for example thermal expansion of oceans and melting of ice, have long response times. Hence, sea-level responds slowly to the changes in temperature. The computed sea-level rise in all of the scenarios is about 30 centimetres in 2050 relative to the pre-industrial era, with only the smallest of differences between them (see Figure 9.16). This magnitude of sea-level rise implies increasing risk of coastal flooding during storm surge events, accelerating beach erosion, another changes to the world’s [[coastal] zones]. As with the global mean surface temperatures, the sea level continues to rise far beyond the time horizon of these scenarios, which is indicated by the steady rate of increase observed at the end of the scenario period.
Land
One of the major environmental challenges is the conservation of land to maintain its ability to supply ecosystem goods-and-services (see Chapter 3 (Global Environment Outlook (GEO-4): Chapter 9)). The growth of population, economic wealth and consumption (Consumer society) leads to an increase in the overall pressure on land use in each scenario, as well as increased competition between different uses.
Land for agriculture, biofuels and forests
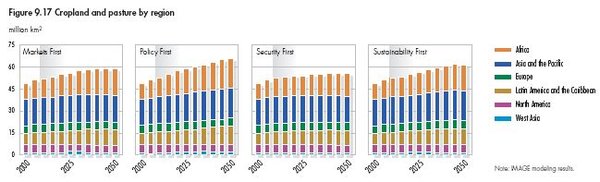 Fig 9.17 Cropland and pasture by region. (Note: IMAGE modeling results.)
 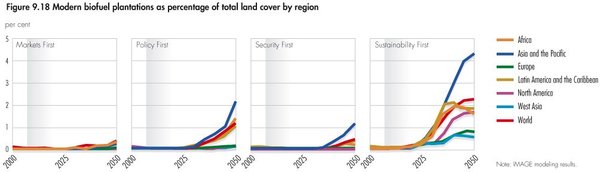 Fig 9.18 Modern biofuel plantations as percentage of total land cover by region. (Note: IMAGE modeling results.)
 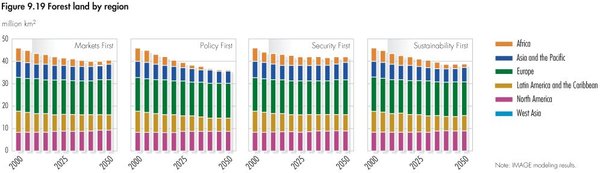 Fig 9.19 Forest land by region. (Note: IMAGE modeling results.)
 In all scenarios, the use of land for traditional agricultural purposes – food crops and pasture and fodder – increases the most in regions where arable land is still available, notably Africa, and Latin America and the Caribbean (see Figure 9.17). These shifts also imply differences among regions in terms of the reliance on land expansion versus aggressive improvements in yields for agricultural growth. In Security First, agricultural land expansion is the smallest, since low economic growth keeps the increase of human demands for land within limits. Markets First and Sustainability First show comparable results but for different reasons. In Markets First, the growth in demand for land is partially compensated by technological developments, whereas in Sustainability First, such improvements are counterbalanced by greater concern for food availability. In Policy First, the total area is highest, due to the similar concerns and higher population levels than in Sustainability First. In Policy First and Sustainability First, which include strong targets for the mitigation of [[GHG]s], there is an added demand on land for the production of biofuel crops (see Figure 9.18). The effect of these demands for agriculture and biofuels is reflected in the changes in forest land (see Figure 9.19). Latin America and the Caribbean, and Africa see significant declines in forest land in all scenarios, most notably in Policy First, where nearly all of Africa’s forests are lost. Meanwhile, Europe and North America see small increases, particularly in Markets First.
Land degradation
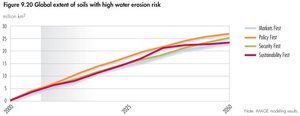 Fig 9.20 Global extent of soils with high water erosion risk. (Note: IMAGE modeling results.)
 The continuation of food production from agricultural land is threatened in different ways. First, rainfall erosion increases, due to increases in precipitation because of climate change. Precipitation increase is strongest under Markets First, although the differences among scenarios are still small in 2050, because of the inertia in the climate system. Water erosion is greatest in agricultural areas, independent of the soil and climatic conditions.
Combining trends in climate and [[land-use (Land-use and land-cover change)] change] and the erodibility index allows a calculation of the water erosion risk index. Compared with the present situation, the area with a high water erosion risk increases by almost 50 per cent in all scenarios (see Figure 9.20). Differences among the scenarios up to 2050 are relatively small. The risks under Sustainability First and Markets First are somewhat less than under the other scenarios, although there is a period during which they rise in the former as more biofuel crops are introduced. The increases are largest under Policy First, mainly due to larger food demand, combined with an increased demand for biofuel crops.
Desertification
Another threat to crop production is desertification. It has been identified as a major social, economic and environmental problem for many countries around the world. Just like land degradation, desertification results from natural factors (such as change in precipitation) and human causes (such as land clearance and excessive land use) or a combination of both.
Changes in arid areas (as a result of climate change) are relatively small. This follows from the fact that climate change results in increasing precipitation, but also increasing evaporation (as a result of temperature increase). For desertification, however, the increase in arid areas is less important than the pressure on these areas. Therefore, the combination of agricultural land expansion in arid areas leads to an increased vulnerability to climatic shocks.
Yields and food availability
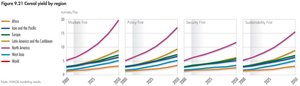 Fig 9.21 Cereal yield by region. (Note: IMAGE modeling results.)
 The changes in land use and quality, as well as advances in technology and general economic developments, such as trade, are reflected in the changes in agricultural yields and food availability. All regions experience increasing cereal yields per unit area in all scenarios, but these are significantly lower in Security First, reflecting slower developments in technology and poorer land management practices (see Figure 9.21). The increasing demands for food, along with greater investments in technology, result in the largest increases in Markets First and Policy First, with some differences among regions. Sustainability First shows slightly lower growth, but this is counterbalanced by a lower overall population.
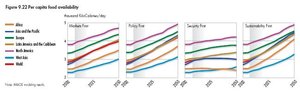 Fig 9.22 Per capita food availability. (Note: IMAGE modeling results.)
 Figure 9.22 highlights the projected changes in per capita food availability. Overall food production increases in all four scenarios, but per capita food availability is also influenced by the different rates in the growth of the population. Significant increases are seen in Markets First, Policy First and Sustainability First, with the latter achieving global levels 10 per cent and 5 per cent higher than the first two, respectively. In Security First, food production barely keeps up with population (Population growth rate) growth after 2020, and the beginnings of a decline are seen around 2040, with that in Africa happening much sooner. By 2050, there is more than a 30 per cent difference in per capita food availability between Security First and Sustainability First globally, and a 70 per cent difference in Africa.
Water
As discussed in Chapter 4 (Global Environment Outlook (GEO-4): Chapter 9), water – both its quantity and quality – is fundamental to the environment and human well-being. The scenarios show that very different futures for water are plausible depending on our choices in the near future.
Water use
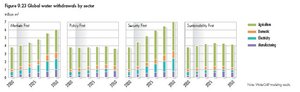 Fig 9.23 Global water withdraws by sector. (Note: WaterGAP modeling results.)
 One of the consequences of the rapid push for better material standard of living in Markets First is a rapid growth in water use in all socio-economic sectors, resulting in a large increase in withdrawals from surface and groundwaters (see Figure 9.23). Trends differ greatly from country to country; in many industrialized countries water use reaches a saturation point during the scenario period, whereas the growing incomes in developing countries lead to an increasing demand for modern water services. In Markets First, the privatization of water services and improvements in technology lead to a moderate but steady increase in the efficiency of water use in most regions. Nevertheless, the water sector emphasizes the expansion of water supply rather than water conservation. Under Policy First, a change in water-use behaviour in households and industries, together with rapid improvements in the efficiency of water use in all sectors, leads to a decrease in water withdrawals in many industrialized countries, and a slower growth elsewhere. Under Security First, a growing population and neglect of water conservation tends to push water withdrawals upwards. Yet, slower economic growth tends to slow the increase. Sustainability First assumes widespread adoption of integrated water management strategies, with strong emphasis on demand management and conservation. These developments, together with slower [[population (Population growth rate) growth] rates], lead to slower increases in overall water use.
Persons living in areas with severe water stress
The extent of severe water stress will be complicated by the effect of climate change on the future water supply in all scenarios. Increasing precipitation will increase the annual availability of water in most river basins, but warmer [[temperature]s] and decreasing precipitation will decrease annual water availability in some arid regions, such as West Asia, southern parts of Europe, and northeastern parts of Latin America and the Caribbean. Changes in climate could also lead to more frequent periods of high and low run-off (not shown). By 2050, the occurrence of droughts could become more common in already arid areas, such as Australia, southern India and Southern Africa. Meanwhile, increasing precipitation could cause more frequent high run-off events in parts of Asia and the Pacific, Latin America and the Caribbean, and North America.
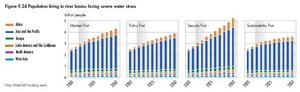 Fig 9.24 Populations living in river basins facing severe water stress. (Note: WaterGAP modeling results.)
 These factors combine with the increases in demand and population growth to determine the number of people living in river basins with severe water stress (see Box 9.2 and Figure 9.24). In Markets First, the affected population grows from around 2.5 billion people in 2000 to nearly 4.3 billion people in 2050. In Policy First, actions to slow the growth in water use help alleviate concerns about freshwater (Freshwater biomes) availability in much of the world. Nevertheless, growing populations and economic activity continue to put a strain on resources in some places, particularly in the developing regions. The global population living under severe water stress rises by 40 per cent to nearly 3.9 billion people. The net effect of high population and increased demand in Security First is that the population living in river basins under severe water stress in 2050 exceeds 5.1 billion people. The number living with water scarce conditions in Africa approaches 800 million, nearly as many people as lived in that region at the start of the century. The developments under Sustainability First with respect to water use, together with slower [[population (Population growth rate) growth] rates], lead to significant reductions in water stress in many river basins. Still, in part due to the varying patterns of population growth and shifting patterns of precipitation as part of the changing climate, there are increases in some regions, notably Africa, Asia and the Pacific, and West Asia. The number of people living in river basins with severe water stress increases by more than 1.1 billion globally. In both Sustainability First and Policy First, it is expected that many actions will be taken to help people in river basins facing stress to better cope with water scarcity. These include programmes to reduce water wastage in the distribution of water and highly efficient programmes to manage surface- and groundwater.
|
Box 9.2 Water stress |
|
The concept of “water stress” is used in many water assessments to obtain a first estimate of the extent of society’s pressure on water resources. Severe water stress is defined as a situation where withdrawals exceed 40 per cent of renewable resources. It is assumed here that the higher the levels of water stress the more likely that chronic or acute water shortages will occur. |
Wastewater treatment
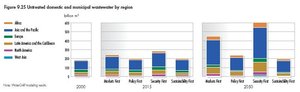 Fig 9.25 Untreated domestic and municipal wastewater by region. (Note: WaterGAP modeling results.)
 A consequence of the rapid increase in water withdrawals in Markets First is a similarly rapid growth in the production of wastewater. Although treatment plant capacity expands, it cannot keep up with the increase in volume of wastewater. Hence, the total worldwide volume of untreated wastewater from the domestic and manufacturing sectors doubles between 2000 and 2050 (see Figure 9.25). Since most of this wastewater is discharged into inland surface waters, the world experiences a serious spread of water pollution problems and health risks. In Policy First, the level of wastewater treatment increases from around 50 to about 80 per cent between 2000 and 2050, but because of growing population, the total volume of untreated wastewater still increases by about 25 per cent during this time (see Figure 9.25). Yet, the global average hides significant disparities among regions. While the total volume of untreated wastewater shrinks by more than half in Europe, it nearly doubles in LAC. Since the coverage of communities with wastewater treatment plants is also relatively low under Security First, the volume of untreated wastewater increases by more than a factor of three between 2000 and 2050. The discharge of these large volumes of untreated wastewater to surface waters causes widespread water contamination, worsening health risks and degrading aquatic ecosystems. Under Sustainability First, efforts to reduce the growth in water demand also contribute to maintaining and improving water quality around the world. Treatment capacity manages to keep pace with the increasing amounts of wastewater, such that the total volume of untreated wastewater has changed very little since the turn of the century (see Figure 9.25). This, however, masks large differences among regions. In North America, the volume of wastewater is drastically reduced, while in Latin America and the Caribbean the volume increases by a small amount.
Biodiversity
Across the scenarios and regions, global biodiversity continues to be threatened, with strong implications for ecosystem services and human well-being as described in Chapter 5 (Global Environment Outlook (GEO-4): Chapter 9). This is the case for both terrestrial and marine biodiversity. However, there are clear differences among the scenarios in the magnitude and location of change.
Terrestrial biodiversity
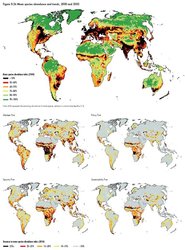 Fig 9.26 Mean species abundance and trends, 2000 and 2050.
 All regions continue to experience declines in terrestrial biodiversity in each of the scenarios. Figure 9.26 shows the levels of Mean Species Abundance as of 2000 and the changes in each of the scenarios from 2000 to 2050; Figures 9.27–9.28 summarize these changes by region and contribution. The greatest losses are seen in Markets First, followed by Security First, Policy First and Sustainability First for most regions. Africa, and Latin America and the Caribbean experience the greatest losses of terrestrial biodiversity by 2050 in all four scenarios, followed by Asia and the Pacific. The differences among the regions are largely a result of the broad-scale [[land-use (Land-use and land-cover change)] changes] already described, especially increases in pastureland and areas dedicated to biofuel production. The overall changes in terrestrial biodiversity though, are influenced by a number of other factors, including infrastructure development, pollution and climate change, as well as public policy and conflict.
Agriculture, including crop and livestock production, has greater overall biodiversity impacts in Policy First and Sustainability First than in the other scenarios, both because food security is highly valued in these worlds, and because there is a greater uptake of biofuels based on agricultural products. Tropical [[forest]s] continue to be particularly vulnerable to conversion.
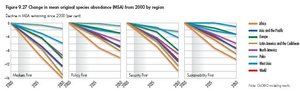 Fig 9.27 Change in mean original species abundance (MSA) from 2000 by region. (Note: GLOBIO modeling results.)
 On a global scale, much more biodiversity loss is seen in Markets First than in any other scenario, with infrastructure development playing a major role. In Markets First, global population (Population growth rate) growth is more limited, and road construction and urban development are more regulated than in Security First. However, the drivers of development are stronger in Markets First: international [[market]s] for goods are strengthened, infrastructure is developed to promote access to natural resources, and wealth creation is valued more highly than conservation. In Markets First and Security First, the biodiversity loss continues to accelerate as the scenario progresses, but within Policy First and Sustainability First, the global rate of loss stabilizes by 2050.
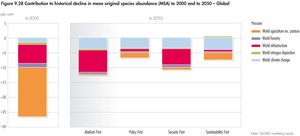 Fig 9.28 Contribution to historical decline in mean original species abundance (MSA) to 2000 and to 2050-Global. (Note: GLOBIO modeling results.)
 The impacts of climate change are modelled as being similar in each scenario, but in reality, these will be moderated by the ability of species and ecosystems to adapt and migrate. Resilient, well-connected ecosystems suffer fewer ill effects from climate change than fragmented, overexploited ecosystems, such as those seen in Security First and Markets First. The rate at which the global temperature continues to rise has a profound influence on the survival chances of many of the worlds’ species until 2050 and beyond.
Under Policy First and Sustainability First, the protected area network is expanded to create ecologically representative national and regional systems of protected areas. A minor expansion is seen in Markets First, and virtually none in Security First; the investment dedicated to and effectiveness of protected area management within the different scenarios follows the same pattern. While the new protected areas do not limit the overall amount of wildland converted to agricultural use, they protect some of the most critical remaining habitat, including that inhabited by endangered species with restricted ranges. This effect is not seen in the MSA (mean original species abundance) indicator, as it is insensitive to these specific, rare and unique species and ecosystems. Some agricultural use is possible in some protected areas, but there is a high potential for land-use conflicts by 2050. This is most visible within Policy First. In sub-regions such as Meso-America and Southern Africa, there is so much demand for agricultural farmland that wilderness outside protected areas is crowded out, and the areas themselves are isolated in an agricultural matrix. Sustainable agriculture, with farm design paying explicit attention to biodiversity conservation, is especially important under these circumstances.
Finally, the increased frequency of armed conflict in Security First creates unpredictable risks for biodiversity, as well as for people. International funds for conservation action are often frozen as the situation deteriorates. As well as increasing the availability of guns, conflict reduces agricultural production, making illegal and unsustainable hunting more attractive. As rural people struggle to survive, militias seek resources to fund their wars, and unscrupulous companies take advantage of the chaos. Protected areas in the conflict zones are looted for meat, minerals and timber [11].
|
Box 9.3 Defining and measuring biodiversity |
|
Biodiversity as defined by the Convention on Biological Diversity encompasses the diversity of genes, species and ecosystems. One terrestrial measure of species-level diversity is the average remaining abundance of each individual species belonging to an ecosystem, or “mean original species abundance” (MSA). MSA represents the remaining abundance of native species, relative to a natural state. For example, if a forest is cleared, then the MSA is based on the surviving forest species. MSA is modelled on a relative scale from 0 per cent (ecosystem destroyed) to 100 per cent (ecosystem intact). The GLOBIO model used to project changes in MSA in the GEO scenarios is described in the Annex. |
Marine biodiversity
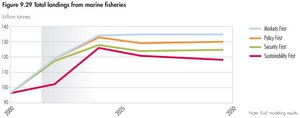 Fig 9.29 Total landings from marine fisheries. (Note: EwE modeling results.)
 Marine biodiversity continues to decline in all scenarios, due to increased pressure on marine fisheries to meet food demand (see Figure 9.29). The declines are smallest in Sustainability First, due to the smaller increases in population and shifting diets. Even with its greater population, Security First does not see as large an increase as Markets First or Policy First, due to lower average incomes as well as slower advances in technology that would allow for greater catches.
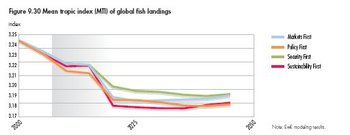 Fig 9.30 Mean tropic index (MTI) of global fish landings. (Note: EwE modeling results.)
 The scenarios also differ with respect to the types of fish caught. Figure 9.30 shows that in Sustainability First there is an attempt to fish lower on the food chain, reflecting the goal of maintaining marine ecosystems. While these differences may seem marginal, in combination with the lower overall catch level, the effect can be important as is shown in Figure 9.31. The total biomass of large demersal fish is seen to grow significantly in Sustainability First, and slightly in Policy First and Security First by 2050, while it decreases in Markets First. With respect to large and small pelagic fish, the effect is seen in slower declines and small increases in biomass, respectively.
Human well-being and vulnerability
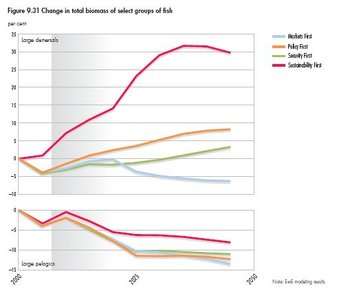 Fig 9.31 Change in total biomass of select groups of fish. (Note: EwE modeling results.)
 What do the scenarios indicate with respect to human well-being – the extent to which individuals have the ability and opportunity to achieve their aspirations? How do they compare in terms of personal and environmental security, access to materials for a good life, good health and good social relations, all of which are linked to the freedom to make choices and take action?
To a certain degree, the scenarios exhibit greater or lesser levels of certain aspects of human well-being by design. Markets First and Sustainability First assume a greater emphasis on individuals’ freedom to make choices and take action than do either Policy First or Security First. More prominence is given to improving health, strengthening local rights and building capacity in Policy First and Sustainability First than in either Markets First or Security First.
|
Box 9.4 Capturing the impact of environmental change on human well-being |
|
As described in the GEO-4 conceptual framework, the impacts of environmental change on human well-being are strongly mediated by social and institutional factors. Furthermore, the explicit links between environmental change and certain aspects of human well-being, such as food availability and water stress, are better understood than, say, those related to education, personal security, good social relations and overall access to materials for a good life. The scenarios presented here, specifically their quantitative elements, do not fully capture the impacts of environmental change on well-being, particularly for these latter categories. Assuming that these are enhanced by positive environmental change, it is likely that the results presented here underestimate the differences in well-being across the scenarios. |
Using the Millennium Development Goals as a guide, Table 9.2 (and associated figures) summarizes how the scenarios fare with respect to improvements in human well-being. Here also, some of the results should be seen as assumptions rather than outcomes. In particular, the development of a global partnership for development (MDG 8) and the integration of the principles into country policies and programmes (a key aspect of MDG 7) are fundamental assumptions of Sustainability First. These are also assumed, but to a lesser degree, in Policy First. Markets First, to the extent that these developments arise, it is assumed this happens only where they fit with the broader goal of increased economic growth. Little or no progress in these areas is assumed in Security First (see Box 9.4).
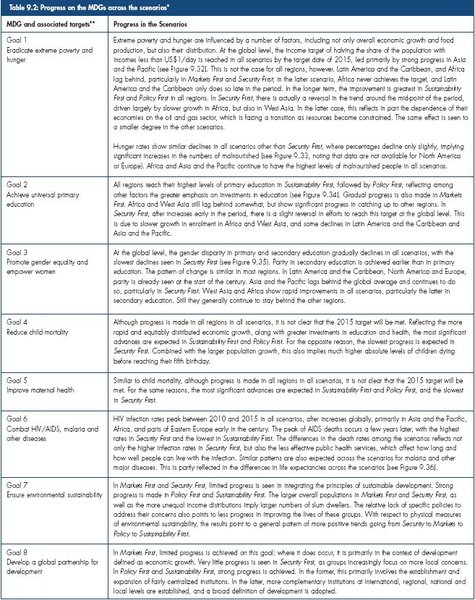 Table 9.2: Progress on the MDGs across the scenarios*. (*The results presented in this table reflect a combination of the narrative and quantitative elements of the scenarios. Certain results, in particular for Goal 8, represent assumptions rather than outcomes of the scenarios. **UN (2003)[1] describes the specific targets and indicators that are being used to monitor progress towards the achievement of these goals.)
 The full picture of human well-being can only be seen by considering the detailed developments within the scenarios. For most regions and sub-regions, there is a fairly consistent pattern of improvements moving from Security to Markets to Policy to Sustainability First. The currently wealthier regions and sub-regions experience slower growth in per capita income in Sustainability First, but this must be weighed against improvements in other indicators. Even in Sustainability First, achieving the MDG targets for example, reducing the percentage of population whose income is less than US$1/day to half their 1990 levels by 2015, is not achieved in all regions.
Looking beyond the MDGs, personal security for most people is significantly lower in Security First, but there are also strong tensions and potential conflicts in Markets First. Combined with the increasing pressures on the environment in all scenarios, these will significantly affect environmental security, with Markets First placing the greatest stress on the global environment and Security First on local environments. These changes will be reflected in the vulnerability of people and the environment. This is borne out by considering how the scenarios differ with respect to a few of the archetypes discussed in [[Chapter 7 (Global Environment Outlook (GEO-4): Chapter 9)]2], specifically those focusing on the commons, Small Island Developing States (SIDS) and water stress.
All of the scenarios present challenges to the global commons, but in different ways and to different degrees. A scenario such as Markets First presents significant challenges; in addition to the growth of population (Population growth rate) and economic activity (Economic growth), there is relatively less attention paid to social and environmental issues. More fundamentally, the drive towards increased privatization implies that what is now treated as common property will increasingly fall under private control. Although this can have positive or negative implications in terms of environmental protection, it will almost certainly lead to more limited access. In Security First, the global commons may actually benefit from several factors: lower levels of economic activity, reduced trade and stricter control in particular areas. Where the commons are accessible, however, it is likely that they will be severely affected. More attention is paid to preserving and sharing the benefits of the global commons in Policy First and Sustainability First. Still, the relatively more rapid increases in incomes in the poorer regions in these scenarios, and the desire to meet both environmental and human well-being goals may lead to conflicts, putting increased pressure on the global commons. In particular, the need to meet increased demands for food and biofuels results in increased pressure on [[forest]s] and protected areas. This is most likely in Policy First, with its larger population.
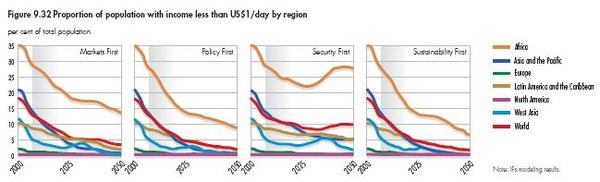 Fig 9.32 Proportion of population with income less than USFig 9.32 Proportion of population with income less than US$1/day by region. (Note: IFs modeling results.)/day by region. (Note: IFs modeling results.)
 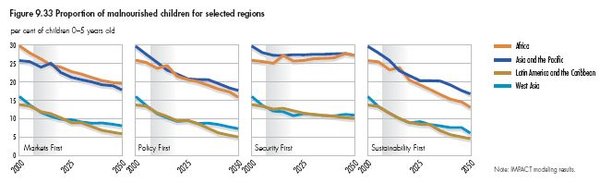 Fig 9.33 Proportion of malnourished children for selected regions. (Note: IMPACT modeling results.)
 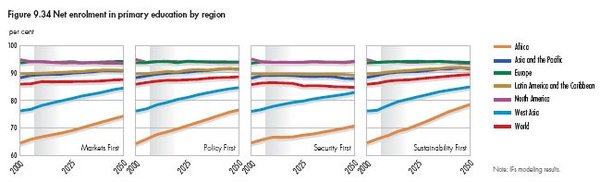 Fig 9.34 Net enrolment in primary education by region. (Note: IFs modeling results.)
 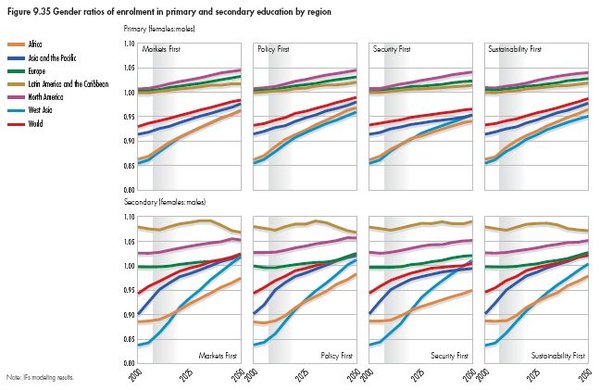 Fig 9.35 Gender ratios of enrolment in primary and secondary education by region. (Note: IFs modeling results.)
 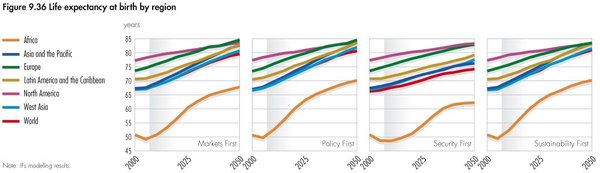 Fig 9.36 Life expectancy at birth by region. (Note: IFs modeling results.)
 The fate of many SIDS is closely linked to the impacts of climate change, in particular sea-level rise. Their outlook is not bright in any of the scenarios (see Figure 9.16), with all indicating a further 20-cm increase by mid-century, which will result in more impacts from tropical storms and storm surges. The scenarios differ, however, in other factors related to the vulnerability of SIDS. Security First brings larger populations, relatively lower levels of international trade, lower incomes and increased limits on international migration. Together, these factors imply severe vulnerability for SIDS. Technological developments in Markets First, along with increased trade and mobility, may help to temper the vulnerabilities. The lower levels of population growth and relatively larger increases in incomes in the poorer SIDS in Policy First and Sustainability First will increase the adaptive capacity of populations in these locations.
Water stress is an issue that is also present in all of the scenarios. As populations grow, so do their demands for services as the scenarios with greater population (Population growth rate) growth naturally imply greater demands. This is tempered by the lower economic growth in Security First in all regions, and lower growth in the currently wealthy regions in Sustainability First. Equally important are the ways the scenarios differ in how these demands are satisfied, including both augmenting supply and improving the efficiency by which services are delivered. In Markets First, privatization, the reduction of subsidies and water pricing all work to reduce the effective demand for water. There is still a strong emphasis on supply augmentation, using technology-centred approaches, such as dam building, deeper drilling for groundwater and large desalination plants. Similar approaches to meeting supply are taken in Security First, although with less efficient implementation. Furthermore, less attention is paid to the environmental implications of these activities, and vulnerable groups are less equipped to cope with the impacts. Policy First and Sustainability First see larger efforts to reduce overall demand, although more subsidies remain in place and greater efforts are taken to improve access, particularly for the poor. The net trade-off is a slightly higher exposure to water problems than would otherwise be the case, but a greater capacity to cope with these problems.
Key Messages from the Regions
The regions of the world will not necessarily confront a single future. As discussed elsewhere in this report, particularly in Chapter 6 (Global Environment Outlook (GEO-4): Chapter 9), the challenges faced differ markedly across regions. As such, the key issues of concern and the precise nature of the developments over the scenario period also differ across the regions. This section summarizes the key regional messages coming out of the scenarios.
Africa
Population increases remain an overriding driver in all scenarios. Population distribution, migration, urbanization, age structure, growth and composition are affected by economic and migration policies in Africa and the other regions. Another common factor is that the achievement of the energy goals set by the New Partnership for Africa’s Development (NEPAD) must not ignore environmental considerations. These include developing more clean energy sources, improving access to reliable and affordable commercial energy supply, improving the reliability as well as lowering the cost of energy supply to productive activities, and reversing environmental degradation associated with the use of traditional fuels in rural areas. This will involve integrating the energy economies of the member states of the African Union to ensure the success of NEPAD, particularly by ensuring that poverty reduction strategies incorporate consideration of sustainable energy supplies.
Severe land degradation in Markets First and Security First results from, respectively, intensified profit-driven agricultural practices and unsustainable practices. This leads to attendant environmental and human well-being impacts. The privatization and amalgamation of sectors in Markets First leads to some improvements in human development, but limited environmental stewardship and globalization trade-offs in Markets First show significant negative consequences by 2050. In Security First, poor economic policies lead to the overexploitation of water, land and mineral resources. In Policy First, environmental and social policies assist the attainment of environmental stewardship and social equity. In Sustainability First, positive changes in value systems, environmental consciousness and favourable demographic, economic and technological trends lead to environmental conservation, with a marked decline in land degradation. In both Policy First and Sustainability First, favourable economic policies, regional integration and economic and environmental stewardship guided by the regulatory frameworks of NEPAD and the African Ministerial Conference on the Environment, create an environment conducive to the attainment of environmental and human development goals.
The scenarios indicate that policies affecting the environment require time, and governments should avoid policy reversals through efforts to build institutional capacity for the development, implementation and monitoring of policy. Policy formulation should not be a technocratic exercise, but a process of dialogue and engagement with the citizenry, scientists and implementers. The outcome of the policies formulated will also depend on the nature of value systems inculcated. Moving environment from its current peripheral situation in the region to the core of development is pivotal to sustainable development. The figures under 9.37 highlight the possible futures of the region.
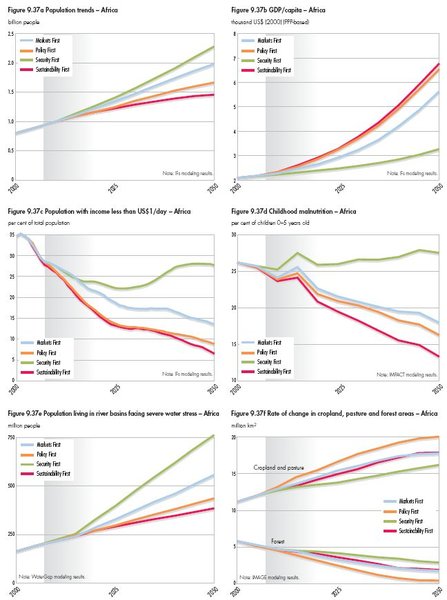 Fig 9.37. (Note: WaterGap modeling results.)
 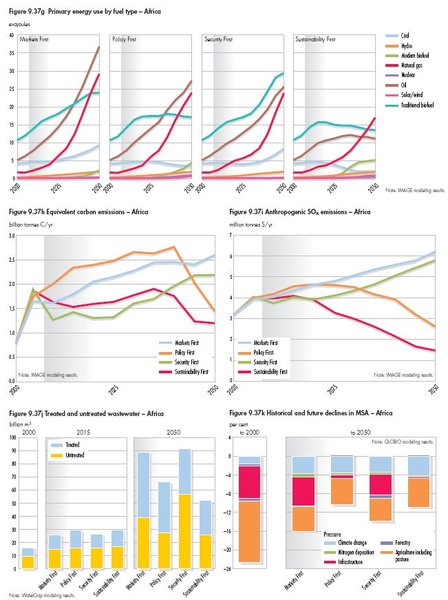 Fig 9.37. (Note: WaterGap modeling results.)
 Asia and the Pacific
There is a danger that increasing the wealth and material well-being of the region’s citizens may come at the cost of environmental deterioration and resource depletion, unless countermeasures are also taken. In Markets First, the average standard of living improves in the region, but the diversity and stability of marine fisheries are threatened, water scarcity intensifies and pollution control efforts cannot keep up with the increasing pressures. Material well-being also increases under Policy First, but in this case, the negative side effects are mitigated by enlightened centralized governmental policies that emphasize conservation and environmental protection. The standard of living also increases for the region’s citizens under Sustainability First, but here population stabilizes and individuals do not consume as much as in Markets First and Policy First. As a result, the pressure on the natural environment under Sustainability First is less than in the other two scenarios.
Governance will play a key role both in achieving prosperity, and in restoring and maintaining environmental quality. The breakdown of governance in Security First contributes to the decline of nearly all indicators of economic well-being, as well as to the degradation of the state of the environment. Conflicts over water scarcity widen, marine fisheries decline, and air and water quality deteriorates. By comparison, new governance structures put into the place under the other scenarios (such as the Asia Pacific Community for Environment and Development) provide a political means for achieving environmental goals. Sustainability First suggests that these governance structures are more effective if they are built up from the communities rather than imposed by central governments.
The scenarios also make it clear that investments in technology and research are key for sustainable development in the region. They can lead to improvements in energy efficiency, water use and the consumption (Consumption and well-being) of resources, lightening the load on the natural environment. The figures under 9.38 highlight the possible futures of the region.
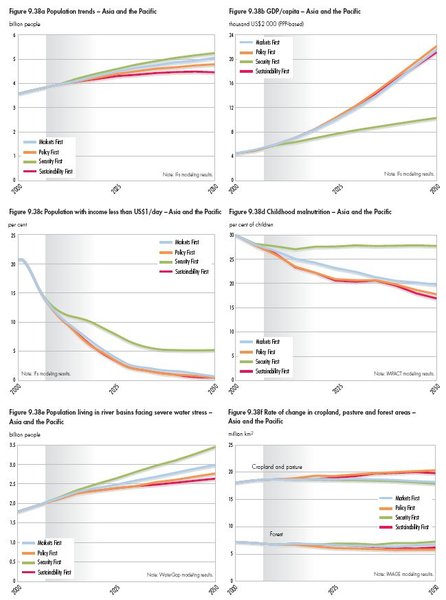 Fig 9.38. (Note: WaterGap modeling results.)
 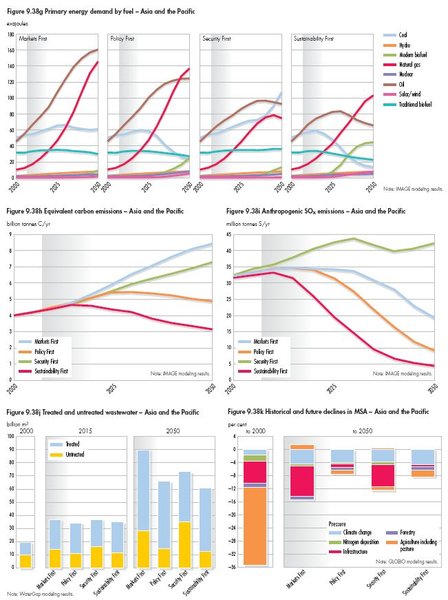 Fig 9.38. (Note: WaterGap modeling results.)
 Europe
All four scenarios illustrate the vulnerability of Europe to environmental change in different ways. Europe is not a leading economic power in any of the scenarios, but it is in position to influence other global regions through its support of environmental and sustainable development technologies, and experience in governance and crisis management in the field of environment. Under unfavourable conditions, however, Europe might be dependent on policy alliances and natural resources from other regions.
A particular uncertainty uncovered by the scenarios is future migration and how this will affect the growth of the European population, especially in interactions with other regions. While ageing of the population is an important issue, equally important are the scale of future programmes in education and research that will reduce possible brain drain from Europe, and will enhance environmentally-related innovation and technological development. The scenarios show that such developments have significant scope to help temper and overcome many socio-economic or environmental crises in the wider region. However, the level of investments in R&D and education programmes required to bring this about can be rather high.
Under two of the four scenarios, environmental changes affecting Europe result in negative effects to both society and nature. In Markets First, striving for a higher standard of living in a globalized economy leads to higher production efficiencies in the western part of Europe, but also to higher consumption levels across the region. GHG emissions sharply increase, biodiversity declines, and pressures on water resources increase. Many indicators of the state and trends of the environment also become less favourable in Security First, but for different reasons. Europe, in this scenario, experiences a general weakening of its institutions and their control on environmental pollution. High increases in GHG emissions result from the low efficiency of energy use, and from high levels of diffuse emissions from land-based sources. Wastewater discharges and destruction of habitats put increased pressure on aquatic ecosystems in both scenarios.
Policy First and Sustainability First scenarios illustrate different pathways that Europe can follow to a more sustainable future. One is to become skilled in managing climate change and other crises, and another is to further strengthen EU policy practices, and spread these further to the eastern part of Europe. Robust strategies include the exchange of technologies, integrated management and stakeholder participation in the decision making processes. The figures under 9.39 highlight the possible futures of the region.
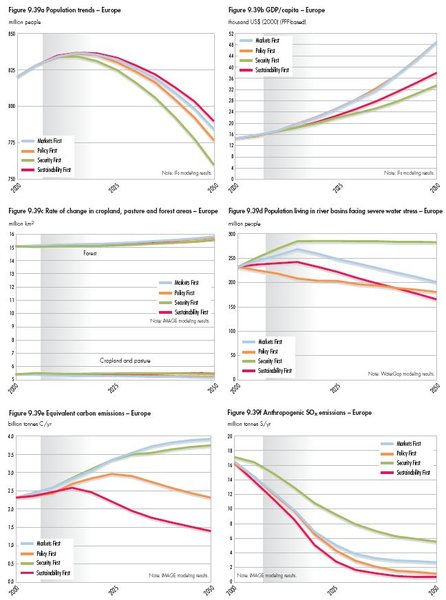 Fig 9.39. (Note: WaterGap modeling results.)
 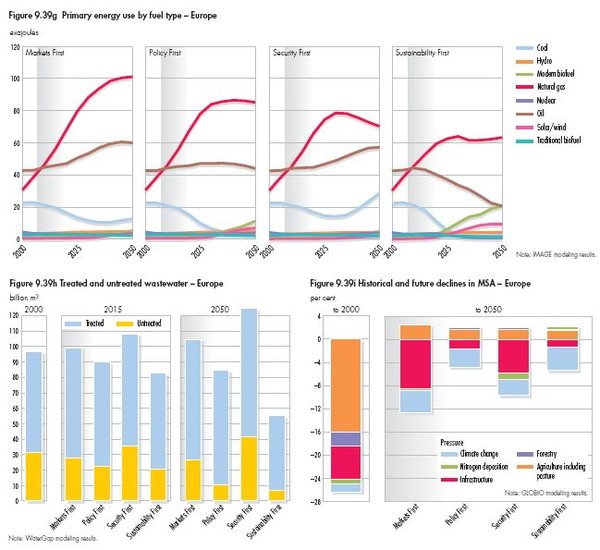 Fig 9.39. (Note: WaterGap modeling results.)
 Latin America and the Caribbean
Historically, the implementation of economic policies and programmes in Latin America and the Caribbean has often imposed additional pressures on social conditions as well as on environmental and natural resources. Inequity and poverty increase markedly under Markets First and Security First, although this is not necessarily captured in measures such as persons living on less than US$1 per day. Modest alleviation is seen in Policy First, and there is a notable contraction under Sustainability First. Foreign debt remains as an obstacle for sustainable development under Markets First and Policy First, with a marked increase under Security First and a reduction to manageable levels under Sustainability First.
Forests and biodiversity represent crucial components of the region’s natural resources, with implications not only for the region but also for the world. Deforestation increases and forest cover falls markedly under Markets First, leading to further habitat loss and fragmentation. Key forest areas of interest to the “elites” are preserved under Security First, but outside of protected areas deforestation rapidly increases. Policy First shows a moderate reduction in deforestation and habitat fragmentation, due to improved regulations and enforcement mechanisms, while mechanisms to rehabilitate affected forest ecosystems are implemented in Sustainability First, stopping the loss and fragmentation of these key habitats.
Increasing pressures on regional water resources persist under the four scenarios by 2050, but qualitative differences can be identified. In Markets First and Security First, quality and quantity of surface- and groundwater diminish, while in Policy First, increase in water withdrawals are tempered by investments in new water saving technologies, which lead to a strong improvement in water use in economic sectors. In Sustainability First, special efforts are introduced to manage conflicts in this area, improve efficiency in water use and change the water use behaviour of the population.
Access to and control of energy resources remain a key source of conflict in Markets First and, to a greater extent, in Security First, with very limited improvement in energy diversification out of fossil fuels and energy efficiency under these two scenarios. In contrast, energy diversification, with greater use of renewable sources, energy efficiency and regional energy cooperation, are promoted in Policy First and strongly reinforced in Sustainability First.
Urbanization is also a key driver, with Latin America and the Caribbean being the most urbanized region in the developing world. The urbanization process proceeds in all scenarios, but with significant differences. Uncontrollable expansion of urbanization occurs under Markets First and Security First, and less chaotic urbanization is seen in Policy First. In Sustainability First, urbanization continues mainly in medium and small cities in a context based on long- term planning for cities development.
A continuous increase in migratory pressures, within the region and to North America, occurs in Markets First, due to the deterioration in social conditions for many groups. Under Security First, migratory pressures considerably increased in the border areas, but migratory legislation becomes more restrictive. Emigration pressures are reduced in Policy First and Sustainability First. In the latter, emigration tends to be a matter of choice rather than of necessity. The figures under 9.40 highlight the possible futures of the region.
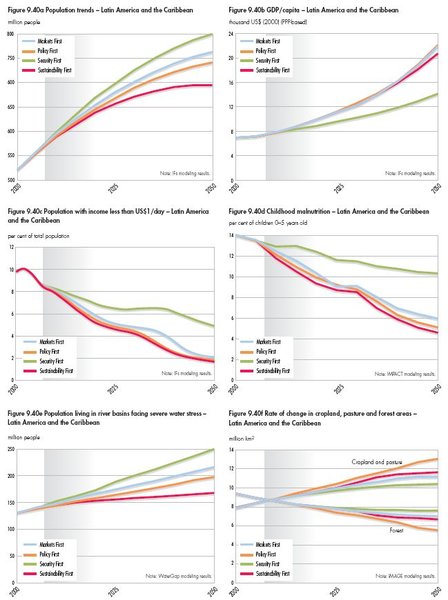 Fig 9.40. (Note: WaterGap modeling result)
 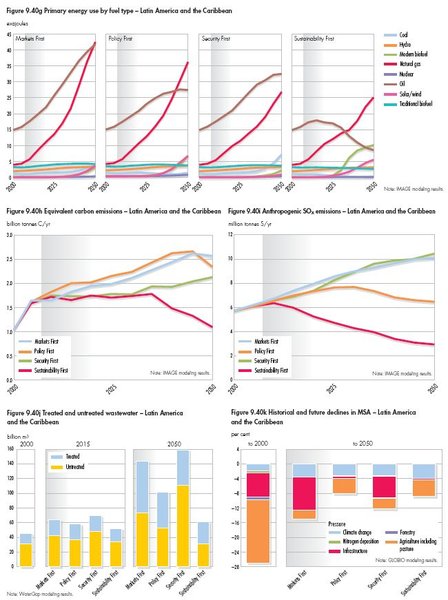 Fig 9.40. (Note: WaterGap modeling result)
 North America
A key distinguishing feature among the scenarios is the degree to which this region responds proactively and in a coordinated fashion to environmental problems. As Markets First illustrates, [[market]s] are phenomenally successful at innovating new products and responding to consumer demand. However, they are not terribly effective in providing solutions to environmental problems if there is no policy guidance, as illustrated by Policy First. If, in addition to the market dynamism of Markets First and the policy guidance of Policy First, there is a further element of cultural awareness and social engagement, as in Sustainability First, then civil society can motivate the private sector and policy-makers towards even greater achievements on the environmental front.
A clear distinction is seen in GHG emissions, which in Policy First are nearly halved compared to Markets First, while in Sustainability First, they fall even further. With regard to water resources, Sustainability First and Policy First also show a much more proactive approach than Security First and Markets First. In the latter two, the degradation of major aquifers and surface water resources takes its toll, especially within the agricultural sector and in the domestic domain, with the fraction of the population living in water stressed basins rising steadily.
The problems of sprawl, climate and water resources tax the region’s policy making capacity. They are diffuse and unfocused problems that worsen slowly but inexorably. They demand action from many different, uncoordinated actors, and require a rethinking of notions of progress and well-being.
Thus, without a more determined and conscious effort, North America could fail to put in place measures that are needed to protect and preserve [[freshwater (Freshwater biomes)] resources], to shift to a dramatically lower-carbon economy, and to break the trend towards ever more land-intensive development. The solutions to these problems will ultimately require ambitious policies, such as market-based mechanisms to value natural resources, such as watersheds, support for technological innovation, and forward-thinking “smart growth” strategies. Moreover, the rise in cultural and individual awareness of these problems and sensitivity to their solutions, as illustrated in Sustainability First, might be a necessary ingredient to catalyse the needed response in the policy and market realms. Worst case, but not implausible, scenario could see deterioration in environmental and socio-economic conditions to a point that seems to defy repair.
Finally, although income levels are similar in Sustainability First and Security First, the quality of life is qualitatively better in Sustainability First, and arguably better than in Markets First and Policy First despite their higher income. Markets First is highly successful at providing products to consumers; Policy First helps ensure that the environmental impacts are mitigated; Sustainability First, however, invests also in the non-material aspects of well-being, such as a healthy environment and a strengthened sense of community, reflecting a reinforced social compact that provides more equitable access to critical resources, such as health care, education and political processes. The figures under 9.41 highlight the possible futures of the region.
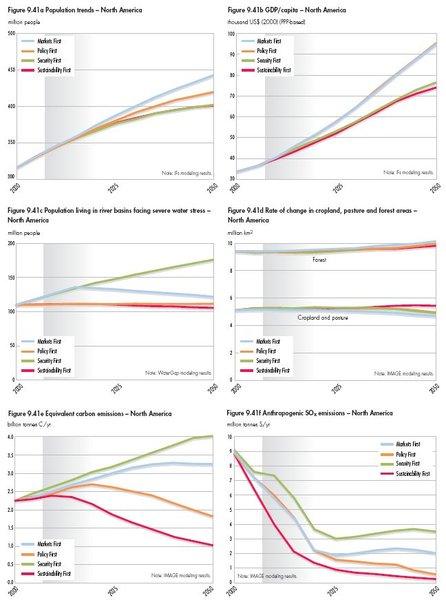 Fig 9.41. (Note: WaterGap modeling results.)
 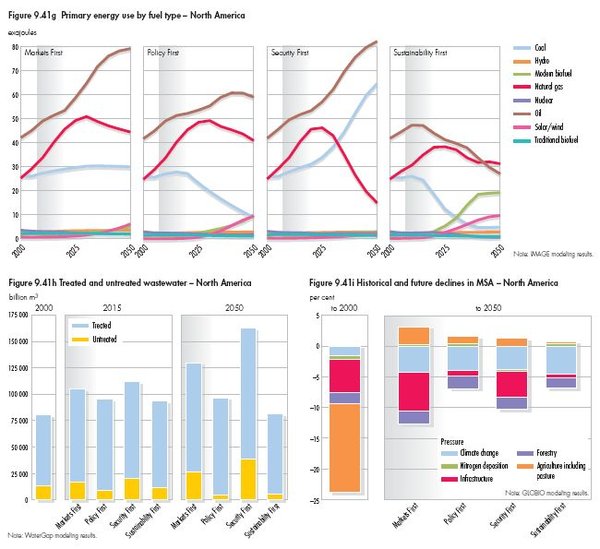 Fig 9.41. (Note: WaterGap modeling results.)
 West Asia
The scenarios illustrate the different pathways and futures that might be taken by the region’s societies, and the relative and complex impacts of the various drivers in shaping its future in terms of human well-being and environmental change. Markets First is a depressing scenario for West Asia; although the market stimulates needed improvements in resource efficiency and socio-economic indicators, the region faces considerable environmental, health and social problems, which in the long-term will undermine economic development.
In Policy First, strong policy constraints are placed by governments on market forces to minimize their undesirable effects on the environment and human well-being. Environmental and social costs are factored into policy measures, regulatory framework and planning processes to achieve greater social equity and environmental protection, which leads to a decrease in environmental degradation, and an improvement in human well-being. However, pressures from investment policies continue to be high.
In Security First, an extreme case of Markets First from the perspective of the region, national and regional political tensions and conflicts remain unresolved for a long time. They continue to be major drivers, negatively influencing the region’s overall development, and leading eventually to the disintegration of the social and economic fabric of the region. Human well-being, the environment and natural resources are victimized to meet security demands.
In Sustainability First, the improvement of governance and a sustained link among social, economic and environmental policies provides a solution to the sustainability challenge in the region. Integration, cooperation, and dialogue at the national, regional and inter-regional levels replace tensions and armed conflicts. Human well-being and the environment are central to planning, and governments adopt long-term integrated strategic planning, with the objective of achieving a superior quality of life and a healthy environment. There is heavy investment in human resources development, aimed at establishing a knowledge-based society. Major funds are allocated to research and development in science and technology to solve the community’s social, economic and environmental problems.
A common denominator for the scenarios is that water stress, land degradation, food insecurity and biodiversity loss continue, though occurring at different rates, due to the prevailing natural aridity in the region and its fragile ecosystem, and the pressures exerted by population size and growth rates. Active, adaptive management, with continuous monitoring and evaluation and capacity building, will be required to cope and adapt to future stresses on people and environment.
Perhaps the most important policy lesson that these scenarios offer to the countries of the region is that investment in human resources development and R&D, governance improvement, and regional cooperation and integration are key issues in the long and intricate path to sustainability for the region. The figures under 9.42 highlight the possible futures of the region.
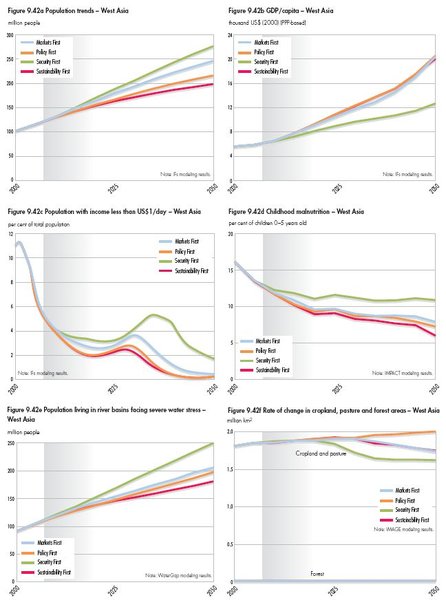 Fig 9.42. (Note: WaterGap modeling results.)
 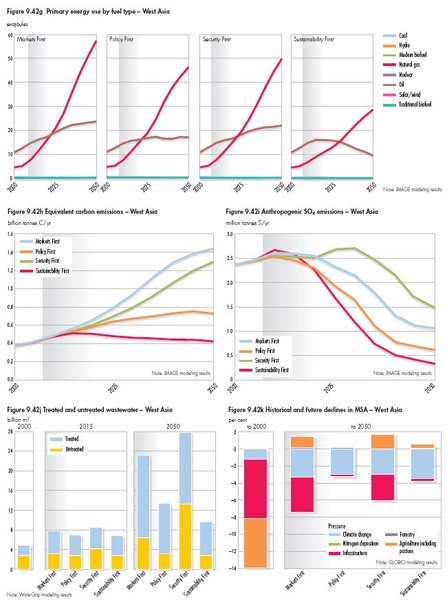 Fig 9.42. (Note: WaterGap modeling results.)
 Polar Regions
Climate change is the predominant and overarching issue across both sub-regions and across all scenarios, with long-term and accelerating effects throughout the time period and well beyond 2050. The impact of climate change on the Polar Regions reaches far beyond the immediate sub-regions, and has major global implications during the scenario period and beyond, such as severe interruptions in the marine ecosystems and sea-level rise, jeopardizing the sustainability of millions in coastal communities globally. The profile and consequences of global climate change are essentially the same across all four scenarios for the period up to 2050. This is a consequence of the enormous inertia in the polar and global marine systems, with reaction time lags of several decades. Differences among the scenarios only become evident (and then only marginally) after 2050, because of new targets aiming to significantly cut carbon emissions under Policy First and Sustainability First.
The Polar Regions store about 70 per cent of the world’s freshwater in the form of ice. As a consequence of climate change, the average annual freshwater run-off into the Arctic and North Atlantic Oceans increases, with pronounced differences among the scenarios, ranging from 4,600 km2/year at present to almost 6,000 km2/year by 2050 in the Markets First scenario.
The Polar Regions are a global storehouse, with huge potential for exploitation. There are distinct differences between the sub-regions, but also across the scenarios, ranging from extensive and devastating in Markets First, to local but intensive in Security First, and more controlled and resourceful in Policy First. With increasing accessibility of polar ecosystems the last top global pristine wilderness areas and their unique biodiversity are put at risk by an ever-increasing global demand on polar resources in Markets First and Security First, with distinct areas for conservation preserved in Policy First, and a slow recovery in Sustainability First (Figure 9.43). The consideration of anything polar as a global resource or commodity increasingly includes the Antarctic region in Markets First. It also establishes pathways from any other global region to the poles, whether it is hazardous waste or tourists, with profound differences in the scenarios.
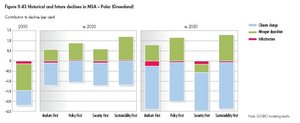 Fig 9.43 Historical and future declines in MSA - polar (Greenland). (Note: GLOBIO modeling results.)
 Indigenous peoples in the Arctic increasingly face pressures from global climate change and the exploitation of the natural resources, with declining political influence in Security First, strong empowerment in Sustainability First and surprisingly strong co-management arrangements in Markets First. Geopolitical interests increasingly dominate over local and indigenous sovereignty very strongly in Security First, but also in Markets First. Sustainability First promotes decentralized governance systems, and a shift in power towards local communities and indigenous peoples, enabling them to practice adaptive management to sustain their livelihoods as well as human well-being.
The long-term availability of polar resources and ecosystem stability very much depends on the implementation ofsustainability principles. The scenarios illustrate how all human activities in the Polar Regions and globally are intertwined, and how only concerted global action can make a difference to the future of the Polar Regions.
Risks and Opportunities of the Future
The GEO-4 scenarios point to both risks and opportunities in the future. Of particular significance are the risks of crossing thresholds, the potential of reaching turning points in the relationship between people and the environment, and the need to account for interlinkages in pursuing a more sustainable path.
Global change – turning points and thresholds
The hallmarks of global change are discernible in life – the sprawl of cities over the countryside, the manifestation of climate change in warmer winters and increased flood events, and more severe heat waves, and the presence of human-made pollutants in remote regions of the world. While results in this chapter indicate that change will continue, they also show that the rate of change for many key indicators may slow down towards the middle of the century. Changes go on, but the rate of change declines, indicating a potential turning point in human-environment relations. At the same time, the actual level of the changes seen in the scenarios may push us past thresholds in the Earth system, resulting in sudden, abrupt or accelerating changes, which could be potentially irreversible. Examples cited in earlier chapters include the collapse of fisheries (Fisheries and aquaculture), eutrophication and deprivation of oxygen (hypoxia) in aquatic systems, emergence of diseases and pests, introduction and loss of species, large-scale crop failures and climatic changes.
Why do the GEO-4 scenarios show a slowing down of change, and why do these differ among the scenarios? The answer lies in the trends of the drivers of the scenarios, such as the stabilization of population in Sustainability First and the slower growth in total economic activity in Security First and Sustainability First. Improvements in technology will raise the efficiency of electricity generation, reduce losses in water distribution systems and boost crop yields, albeit at different rates across regions and the scenarios. These and other developments all contribute to slowing the pace of some aspects of global environmental change.
The rate of increase of water withdrawals slows down by the end of the scenario period in all scenarios except Security First (see Figure 9.44). Rates of cropland expansion and forest loss steadily decline over the scenario period (see Figures 9.45 and 9.46). Some scenarios also show a slackening in the tempo of species loss, greenhouse gas build-up, and temperature increase (see Figures 9.47–9.49).
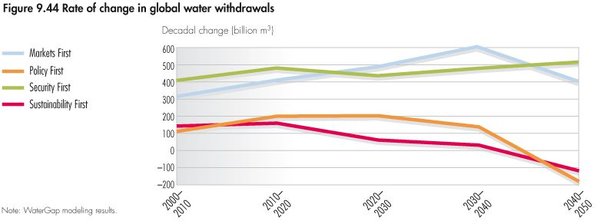 Fig 9.44 Rate of change in global water withdrawals. (Note: WaterGap modeling results.)
 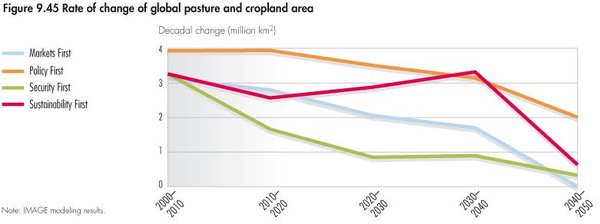 Fig 9.45 Rate of change of global pasture and cropland area. (Note: IMAGE modeling results.)
 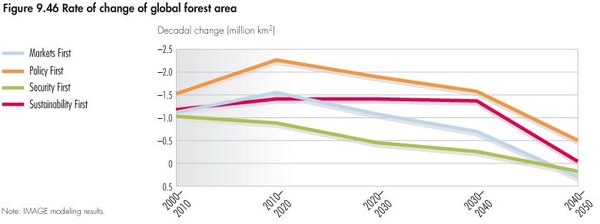 Fig 9.46 Rate of change of global forest area. (Note: IMAGE modeling results.)
 Although the tempo of change slows in some cases, the end point of change will not be the same for all scenarios. For example, water withdrawals reach over 6,000 km2 per year under Market First but less than 4,000 km2 per year under Policy First (see Figure 9.44). Also illustrative are the trends of atmospheric CO2 concentrations and global mean surface temperature. The range in 2050 for CO2 is from around 475 ppm in Sustainability First to over 560ppm in Markets First (see Figure 9.14). For temperature increase, the range is from about 1.7°C above pre-industrial levels in 2050 in Sustainability First to about 2.2°C in Markets First (see Figure 9.15). The higher figure exceeds the threshold of 2°C (see [[Chapter 2 (Global Environment Outlook (GEO-4): Chapter 9)]3]), beyond which climate change impacts become significantly more severe, and the threat of major irreversible damages becomes more plausible.
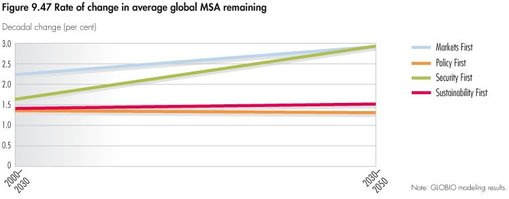 Fig 9.47 Rate of change in average global MSA remaining. (Note: GLOBIO modeling results.)
 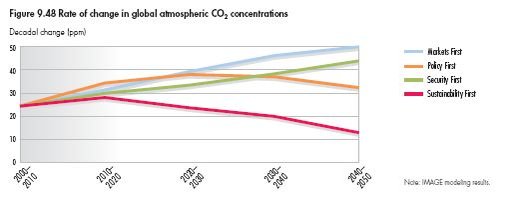 Fig 9.48 Rate of change in global atmospheric CO2 concentration. (Note: IMAGE modeling results.)
 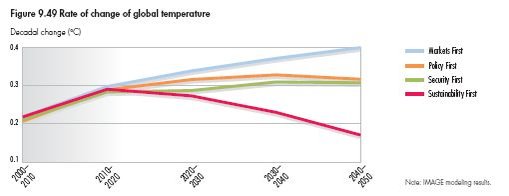 Figure 9.49 Rate of change of global temperature. (Note: IMAGE modeling results.)
 Why is this important? A slower rate of change gives hope that the society and nature can more successfully catch up to the pace of change and adjust to it before experiencing many negative consequences. Society has better chance to keep pace with the change by building new infrastructure, natural ecosystems have more time to migrate, conservation policies have a better chance to catch up to the rate of loss of species and society has more time to learn how to adapt. Conversely, scenarios with a faster pace of change are more likely to come closer to tipping points in the Earth system. What will society reach first: a tempo of change slow enough to adapt to, or levels of change that exceed key thresholds of the Earth system?
Interlinkages
Our Common Future emphasized that “the ability to choose policy paths that are sustainable requires that the ecological dimensions of policy be considered at the same time as the economic, trade, energy, agricultural, industrial and other dimensions – on the same agendas and in the same national and international institutions.” A recent review suggests that 20 years on, “Our societies and their approaches to challenges remain highly compartmentalized” [12]. Looking forward, the acknowledgement and practice in terms of interlinkages varies significantly across the scenarios. There is a need to address interlinkages among numerous environmental issues, such as air (Air pollution emissions) and water pollution, land degradation, climate change, biodiversity loss, and valuing ecosystems goods-and-services. And, there is a need to link environment with development issues, such as extreme poverty and hunger, implementation of the MDGs, and addressing human vulnerability and well-being.
 The scenarios point to both risks and opportunities in the future. There is a need to account for interlinkages in pursuing a more sustainable path. (Credit: Munyaradzi Chenje)
 Under Markets First, interlinkages are factored in the context of the unfettered functioning of [[market]s]. Greater emphasis is placed on economic sectors, with ecosystems goods-and-services considered as primarily production inputs. The implementation of the MEAs largely follows the silos of jurisdictional and administrative boundaries. The economy grows and even more wealth is generated, but human development remains a challenge, as do many environmental issues.
Under Policy First, greater effort is made by government to address the complexities of interlinkages, both in the environment on its own as well as in the context of the governance regimes. Climate change is seen as the dominant entry point to address mitigation and adaptation challenges in different areas and over time, rather than symptomatic of the environment-development nexus. While policy-makers give prominence to measures that consider interlinkages, the legal and institutional framework is not adequately reformed to function across national, administrative and special interest boundaries. Competition among regions, countries and institutions still manifests itself, particularly if there are perceived negative socio-economic impacts at national level.
Security First brings new meaning to the Rio Declaration Principle 7 phrase – common but differentiated responsibilities – promoting selective attention to issues, and limiting responsibilities to areas of special interest. For example, where the development of bio-energy accelerates to meet the energy addiction of a few, it does so without considering issues such as agriculture for food security, increased water demand, [[land-use (Land-use and land-cover change)] change] and increased use of chemicals. Human and financial resources, as well as governance regimes, are deployed to address the challenges on a selective basis and for the benefit of a few. Some environmental issues are effectively addressed, but do not add up to much when considered in relation to overall environmental degradation. Ultimately, the whole society is put at risk, with greater potential impacts on more vulnerable regions and societies. Development is limited to the minority but only for a limited period as unrest threatens their safe havens.
Under Sustainability First, government, civil society, business and industry, the scientific community and other stakeholders work together to address disparate environment and development challenges. The legal and institutional framework is reformed at different levels, bringing coherence across MEAs at the international level and sectoral laws at other levels. MEAs, such as the CBD, CMS, CITES, and Ramsar, achieve greater coherence to ensure not only biodiversity conservation but alleviate the growth of the illegal trade in wildlife and their products. The Basel Convention, and the conventions on prior informed consent on hazardous chemicals (Rotterdam Convention) and on persistent organic pollutants (Stockholm Convention), undertake similar initiatives, and also work closely with the World Trade Organization to address chemicals and waste-related issues. While progress is made in using interlinkages to address the challenges, extensive consultation and drawn-out decision making limit effectiveness in the short-term. The challenge is to maximize the strengths of interlinked approaches and minimize their drawbacks.
Conclusions This chapter has presented four scenarios of plausible futures to the year 2050 – Markets First, Policy First, Security First and Sustainability First – each exploring how current social, economic and environmental trends may unfold, and what this means for the environment, development and human well-being. The scenarios are fundamentally defined by different policy approaches and societal choices, with their nature and names characterized by the theme that dominates the particular future envisioned, such as what comes first. In reality the future, as is the case for the present, will contain elements of each of these scenarios, as well as many others. Still, the scenarios clearly illustrate that the future that will unfold in the long-term will be very dependent on the decisions individuals and society make today. As such, these visions of the future should influence our decisions of today. By providing insights into the challenges and opportunities society will face in the coming half-century, the exploration of these plausible futures can contribute to the discourse about these choices. The scenarios have been presented at both the global and regional levels, because an understanding of global environmental change and its impacts requires an understanding of what is happening in different regions of the world. What happens in each region is very much influenced by what occurs in other regions and the world as a whole. Still, while there is only one global environment, each region and each person experiences it in their own way. As such, the challenges and opportunities, and even the perspectives on the future differ widely across regions and individuals. None of the scenarios describes a utopia. Even though some improvements are seen and there is an indication of a slowing of the rate of change in some aspects of global environmental change, some problems remain persistent in all of the scenarios. In particular, climate change (Global Environment Outlook (GEO-4): Chapter 9) and the loss of biodiversity will continue to present significant challenges, and may eventually pose the danger of crossing critical thresholds in the Earth system. Similarly, with respect to human well-being, significant advances are achievable, particularly in Sustainability First, but even these will take time, and significant inequities will remain by the end of the scenario horizon.
Furthermore, there are costs and risks in each scenario. These are perhaps most evident in Security First, where a narrow definition of security for some is likely to result in increasing vulnerabilities for all. In Markets First, both the environment and society move the fastest towards if not beyond tipping points, where sudden, abrupt, accelerating and irreversible changes may occur. This is of particular concern given the uncertainties in the resilience of environmental and social systems. Under Policy First and Sustainability First, society will achieve a higher material standard of living and greater protection of the environment, but at a significant cost. Indeed, there are particular costs and risks in terms of the actions and approaches taken to address the issues of environment and human well-being. The social and economic costs of these actions may significantly exceed what has been previously assumed, and the lower economic growth seen in the currently well-off regions in Sustainability First may not prove to be acceptable. The time required to implement the actions might increase, due to the greater level of bureaucracy foreseen in Policy First and the increased level of coordination in Sustainability First. Finally, trade-offs may imply that the pursuit of a balanced approach in Sustainability First could work against greater progress on any specific target.
Still, to the extent that the scenarios reflect our understanding of the Earth system and environmental governance, they indicate that some approaches are more likely to be effective than others. Specifically, it is important to recognize the trade-offs, synergies and opportunities that exist in addressing the challenges of achieving environmental, development and human well-being goals. This calls for increasing the integration of policies across levels, sectors, and time, strengthening local rights, building capacity among a wide range of groups in society, and improving scientific understanding. The diversity and multiplicity of these trade-offs and opportunities for synergy clearly increase complexity for decision-makers. This is not to imply that this complexity is to be ignored; that would be a misreading of the scenarios as well as the message of Our Common Future and the subsequent 20 years. It does, however, point to the need for innovative approaches for exploring the options for action to address the intertwined environmental and developmental challenges the world continues to face. Furthermore, the scenarios point to the need to act quickly. Our common future depends on our actions today, not tomorrow or some time in the future.
Technical Annex
As recognized in the third Global Environment Outlook (GEO-3) report and other recent scenario exercises[13], narratives and modelling complement each other in enriching the overall futures analysis. This annex provides some details about the development of the narratives and the modelling results. However, it is important to note that what is presented here does not fully reflect the effort involved in producing the chapter, and the chapter itself includes only a small portion of the material that has been developed.
Contributors Hundreds of people and organizations were involved in preparing this chapter, building upon the four scenarios first introduced in GEO-3. The following paragraphs highlight the stakeholders and process of developing the GEO-4 scenarios. The structure of collaboration followed in the process of developing the chapter provided for an organized means of contribution from a large group of participants and for wider ownership among as many people as possible of the process and its outcomes. The three coordinating lead authors (CLAs) and chapter coordinators oversaw the development of the chapter. Regional team leaders, quantitative modellers, and an expert on facilitating participatory processes comprised the chapter expert group (CEG) and are listed as lead authors (LAs). In addition, primarily for the purpose of providing the regional contributions, a group of about 10 experts per region was chosen by the regional team leaders, in consultation with the regional coordinators of the UNEP Division of Early Warning and Assessment and others. Recognizing the impossibility of the above groups to be truly representative or fully versed in all areas required for the development of the chapter, other regional and modelling experts were also invited to provide a broader range of perspectives and specific expertise. Throughout the process, the team was assisted by Bee Successful[14], a management consultancy with expertise in scenario thinking and participatory methods. (Global Environment Outlook (GEO-4): Chapter 9)
Process
The CLAs and LAs met several times in 2004 and early 2005 to plan the development of the chapter. During the GEO-4 regional consultations, a strong preference was expressed by participants to retain the basic characteristics of the scenarios, rather than to restart the process. Therefore, the scenarios presented here should be seen as revised and updated versions of those from GEO-3, both in terms of the narratives and the quantification[15]. Still, they have been influenced by more recent scenario exercises, both those that drew directly from GEO-3, e.g. regional studies in Africa[16], and Latin America[17], and those that only marginally considered the scenarios presented in GEO-3, most notably the global and sub-global scenarios developed as part of the Millennium Ecosystem Assessment [18].
The chapter expert group, along with the seven teams of regional representatives met in Bangkok in September 2005. This was followed by meetings in each of the regions other than North America, in 2006. Further smaller meetings of CEG members were held over the next 18 months to further clarify issues and work out potential inconsistencies between the regional narratives and between the narratives and the quantitative results.
The seven regional teams developed narrative descriptions of each of the four scenarios from the perspective of each region. Taking the drivers and assumptions of the GEO-3 global scenarios as a starting point, the regional groups worked in parallel to develop rich descriptions of the ‘journey’ and ‘end state’ of the four scenarios from a regional perspective. At the same time, each group carefully considered how events or trends in their region might influence, or be influenced by developments in other regions and at the global level. Through a series of iterations, storylines were drafted at both the regional and global levels. In parallel, a suite of advanced state-of-the-art models, described below, was used to develop the quantitative estimates of future environmental change and impacts on human well- being. In order to check the validity and consistency of the scenarios, the narrative teams interacted closely with the global and regional modellers to ensure that the quantitative and qualitative components of the scenarios complemented and reinforced each other. Furthermore, the scenarios were critically reviewed by experts in particular areas, such as energy, many of whom were contributors to other chapters of this report.
A concerted effort was made throughout this process to build regional capacity with respect to scenario development, as well as to make the resulting regional material a central part of the global storylines. In particular, special attention was given to the regional priority issues identified early in the GEO-4 process and discussed throughout the preceding chapters. These have been tracked through the scenarios presented here.
The Models
Since no single overriding “super model” was available for computing future environmental change and the impacts on human well-being, a suite of advanced global and regional models was assembled for the task. These models have been published in the peer-reviewed scientific literature and have been shown to be useful for linking changes in society with changes in the natural environment. The models were soft-linked with output files from one model being used as inputs to other models. Following standard practice, all of the models are calibrated to historical data up to a common base year, in this case 2000 for most data. Thus, the results presented may show slight deviations across scenarios, as well as from more recent historical data, for the period 2000 to the date of publication of this report, some of which may have been presented in other chapters.
Briefly, the models are as follows:
International Futures (IFs) is a large-scale integrated global modelling system [19]. IFs serves as a thinking tool for the analysis of long-term country-specific, regional, and global futures across multiple and interacting issue areas. The system draws upon standard approaches to modelling specific issue areas whenever possible, extending those as necessary and integrating them across issue areas. For GEO-4, IFs provided population trends and the development in GDP and GDP per capita as well as additional information on value added, household consumption, health and education.
IMAGE (Integrated Model to Assess the Global Environment) is a dynamic integrated assessment model for global change developed by the National Institute for Public Health and the Environment (RIVM), The Netherlands [20]. IMAGE is used to study a whole range of environmental and global change problems, particularly in the realm of land use change, atmospheric pollution, and climate change. The main objectives of IMAGE are to contribute to scientific understanding and support decision-making by quantifying the relative importance of major processes and interactions in the society-biosphere-climate system. For GEO-4, IMAGE provided estimates of energy use, land use, greenhouse gas emissions, and changes in temperature and precipitation.
IMPACT (International Model for Policy Analysis of Agricultural Commodities and Trade) is a representation of a competitive world agricultural market for 32 crop and livestock commodities, including all cereals, soybeans, roots and tubers, meats, milk, eggs, oils, oilcakes and meals, sugar and sweeteners, fruits and vegetables, and fish. It was developed in the early 1990s as a response to concerns about a lack of vision and consensus regarding the actions required to feed the world in the future, reduce poverty, and protect the natural resource base. For GEO-4, IMPACT generated projections for crop area, livestock numbers, yield, production, demand for food, feed and other uses, prices, trade and childhood malnutrition.
WaterGAP (Water – Global Assessment and Prognosis) is a global model developed at the Center for Environmental Systems Research of the University of Kassel that computes both water availability and water use on a 0.5° global grid [21]. The model aims to provide a basis for an assessment of current water resources and water uses, and for an integrated perspective on the impacts of climate change and socio-economic drivers on the future water sector. For GEO-4, WaterGAP provided estimates of water use (for irrigation and in the domestic, manufacturing, and electricity production sectors), water availability, and water stress.
EwE (Ecopath with Ecosim) is an ecological modelling software suite for personal computers of which some components have been under development for nearly two decades. The development is centred at the University of British Columbia’s Fishery Centre. The approach is thoroughly documented in the scientific literature, with over 100 ecosystems models developed to date[22]. EwE uses two main components: Ecopath – a static, mass-balanced snapshot of marine ecosystems, and Ecosim – a time dynamic simulation module for policy exploration that is based on an Ecopath model. For GEO-4, EwE provided estimates of catch, profits, and quality of marine fisheries.
The GLOBIO model simulates the impact of multiple pressures on biodiversity [23]. The model relies on a database of field studies relating magnitude of pressure to magnitude of biodiversity impact. This database includes separate measures of mean species abundance (MSA) and of species richness (MSR) of original species of ecosystems, each in relation to different degrees of pressure. The entries in the database are all derived from peer-reviewed studies, either of change through time in a single plot, or of response in parallel plots undergoing different pressures. An individual study may have reported species richness, mean species abundance, or both. Rows are classified by pressure type, taxon under study, biome and region. For GEO-4, GLOBIO provided estimates of changes in mean species abundance for terrestrial ecosystems.
LandSHIFT is an integrated model system that aims at simulating and analysing spatially explicit land use (Land-use and land-cover change) dynamics and their impacts on the environment at global and continental level. The model design is characterized by a highly modular structure that allows the integration of various functional model components. For GEO-4, LandSHIFT provided detailed estimates of land use change for Africa.
The CLUE-S (Conversion of Land Use and its Effects) modeling framework, is a tool to downscale projected national land use changes [24]. The framework combines different mechanisms that are important to the land use system in a spatially explicit manner. The model dynamically simulates competition and interactions between land use types and is, therefore, path dependent, resulting in non-linear behaviour that is characteristic for land use systems. For GEO-4, CLUE-S provided detailed estimates of land use change for Western and Central Europe.
AIM (the Asia Pacific Integrated Model) is a set of large-scale computer simulation models developed by the National Institute for Environmental Studies in collaboration with Kyoto University and several research institutes in Asia and the Pacific. It assesses policy options for stabilizing global climate and a range of other environmental problems. For GEO-4, AIM provided additional estimates of environmental change used in the development of the narratives for Asia and the Pacific.