Ecosystems and Human Well-being Synthesis: Appendix A. Ecosystem Service Reports

This is part of the Millenium Ecosystem Assessment report Ecosystems and Human Well-Being Synthesis
This Appendix presents some of the main findings from the Condition and Trends Working Group and the Scenarios Working Group for a selected set of ecosystem services addressed in the Millennium Ecosystem Assessment.
Contents
- 1 Food: Provisioning Service
- 2 Water: Provisioning and Supporting Services
- 3 Timber, Fiber, Fuel: Provisioning Services
- 4 Biochemicals and Genetic Resources: Provisioning Services
- 5 Climate Regulation: Regulating Services
- 6 Disease Regulation: Regulating Services
- 7 Waste Treatment: Regulating Services
- 8 Natural Hazard Regulation: Regulating Services
- 9 Cultural Services
- 10 Nutrient Cycling: Supporting Services
Food: Provisioning Service
People obtain food from highly managed systems such as crops, livestock, and aquaculture and also from wild sources, including freshwater and marine capture fisheries and the harvesting of wild plants and animals (bushmeat, for example).
Condition and Trends
- Food production more than doubled (an increase of over 160%) from 1961 to 2003 (C8.1). (See Appendix Figure A.1.) Over this period, production of cereals—the major energy component of human diets—has increased almost two and a half times, beef and sheep production increased by 40%, pork production by nearly 60%, and poultry production doubled (C8.ES).
- Over the past 40 years, globally, intensification of cultivated systems has been the primary source (almost 80%) of increased output. But some countries, predominantly found in sub- Saharan Africa, have had persistently low levels of productivity, and continue to rely on expansion of cultivated area. For all developing countries over the period 1961–99, expansion of harvested land contributed only 29% to growth in crop production versus the contribution of increases in yields, which amounted to 71%; in sub-Saharan Africa, however, yield increases accounted for only 34% of growth in production (C26.ES, C26.1.1).
- Both total and per capita fish consumption have grown over the past four decades. Total fish consumption has declined somewhat in industrial countries, while it has nearly doubled in the developing world since 1973 (C8.ES).
- Demand for fish has risen more rapidly than production, leading to increases in the real prices of most fresh and frozen fish products (C8.ES).

- Freshwater aquaculture is the fastest-growing food production sector. Worldwide, it has increased at an average compounded rate of 9.2% per year since 1970, compared with only 1.4% for capture fisheries and 2.8% for terrestrial farmed meat production systems (C26.3.1). Aquaculture systems now account for roughly 27% of total fish production (C8 Table 8.4).
- The level of global output of cereals has stagnated since 1996, so grain stocks have been in decline. Although there is concern about these trends, they may reflect only a normal cycle of market adjustment (C8.2.2).
- Although there has been some cereal price increase since 2001, prices are still some 30–40% lower than their peak in the mid-1990s (C8.2.2).
- Current patterns of use of capture fisheries are unsustainable. Humans increased the capture of marine fish up until the 1980s by harvesting an ever-growing fraction of the available resource. Marine fish landings are now declining as a result of the overexploitation of this resource (C18.ES). Inland water fisheries, which are particularly important in providing high-quality diets for poor people, have also declined due to habitat modification, overfishing, and water withdrawals (C8.ES).
- While traditional aquaculture is generally sustainable, an increasing share of aquaculture uses carnivorous species, and this puts increased pressure on other fisheries to provide fishmeal as feed and also exacerbates waste problems. Shrimp farming often results in severe damage to mangrove ecosystems (Mangrove ), although some countries have taken steps to reduce these harmful impacts.
Scenarios
- All four MA scenarios project increased total and per capita global food production by 2050 (S9). On a per capita basis, however, basic staple production stagnates or declines in the Middle East and North Africa and increases very little in sub-Saharan Africa for all four scenarios. Production shortfalls are expected to be covered through increased food imports in these regions. Agricultural land area continues to increase in developing countries under the MA scenarios, but declines in industrial countries. (See Appendix Figure A.2.)
- Global demand for food crops (measured in tons) is projected to grow by 70–85% between 2000 and 2050 (S9.4.1).
- Demand for both freshwater and marine fish will expand because of increasing human population (Population growth rate) and changing food preferences, and the result will be an increasing risk of a major and long-lasting decline of regional marine fisheries (medium to high certainty) (S9.ES).
Water: Provisioning and Supporting Services


Condition and Trends
- Recent changes to ecosystems have not significantly reduced the net amount of renewable freshwater runoff on Earth, but the fraction of that runoff used by humans has grown dramatically. Global freshwater use expanded at a mean rate of 20% per decade between 1960 and 2000, doubling over this time period (C7.ES).
- Contemporary water withdrawal is approximately 10% of global continental runoff, although this amounts to between 40% and 50% of the continental runoff to which the majority of the global population has access during the year (C7.ES, C7.2.3).
- Inorganic nitrogen pollution of inland waterways has increased more than twofold globally since 1960 and more than tenfold for many industrialized parts of the world (C7.ES).
- Current patterns of human use of water are unsustainable. From 5% to possibly 25% of global freshwater use exceeds longterm accessible supplies and is met through engineered water transfers or the overdraft of groundwater supplies (low to medium certainty). More than 1 billion people live in areas without appreciable supplies of renewable fresh water and meet their water needs in this way (C7.ES). In North Africa and the Middle East, unsustainable use represents about a third of all water use (low certainty) (C7.ES).
- Globally, 15–35% of irrigation withdrawals are estimated to be unsustainable (low to medium certainty) (C7.2.2). (See Appendix Figure A.3.)
Scenarios
- Use of water is expected to grow by approximately 10% between 2000 and 2010, compared with rates of 20% per decade over the past 40 years (C7.ES).
- Water withdrawals began to decline in many parts of the OECD at the end of the twentieth century, and with medium certainty will continue to decline throughout the OECD during the twenty-first century because of saturation of per capita demands, efficiency improvements, and stabilizing populations (S9.ES).
- Water withdrawals are expected to increase greatly outside the OECD as a result of economic development and [[population (Population growth rate)] growth]. The extent of these increases is very scenario-dependent. In sub-Saharan Africa, domestic water use greatly increases and this implies (low to medium certainty) an increased access to fresh water. However, the technical and economic feasibility of increasing domestic water withdrawals is very uncertain (S9.ES).
- Across all the MA scenarios, global water withdrawals increase between 20% and 85% between 2000 and 2050. (S9 Fig 9.35) (See Appendix Figure A.4.)
- Global water availability increases under all MA scenarios. By 2050, global water availability increases by 5–7% (depending on the scenario), with Latin America having the smallest increase (around 2%, depending on the scenario), and the Former Soviet Union the largest (16–22%) (S9.4.5). Increasing precipitation tends to increase runoff, while warmer temperatures intensify evaporation and transpiration, which tends to decrease runoff.
Timber, Fiber, Fuel: Provisioning Services

Timber is harvested from forests and plantations and used for a variety of building, manufacturing, fuel, and other needs. Forests (providing fuelwood and charcoal), agricultural crops, and manure all serve as sources of biomass energy. A wide variety of crops and livestock are used for fiber production. Cotton, flax, hemp, and jute are generally produced from agricultural systems, while sisal is produced from the leaves of Agave cactus. Silk is produced by silkworms fed the leaves of the mulberry tree, grown in an orchard-like culture, and wool is produced by sheep, goats, alpaca, and other animals.
Condition and Trends
- Global timber harvests increased by 60% since 1960, and wood pulp production increased slightly less than threefold over this same time (C9.ES, C9 Table 9.5). Rates of growth in harvests have slowed in recent years.
- Fuelwood is the primary source of energy for heating and cooking for some 2.6 billion people, and 55% of global wood consumption is for fuelwood (C9.ES). Although they account for less than 7% of world energy use, fuelwood and charcoal provide 40% of energy use in Africa and 10% in Latin America (C9.4).
- Global consumption of fuelwood appears to have peaked in the 1990s and is now believed to be slowly declining as a result of switching to alternate fuels and, to a lesser degree, more-efficient biomass energy technologies. In contrast, global consumption of charcoal appears to have doubled between 1975 and 2000, largely as a result of continuing population shifts toward urban areas (C9.4.1).
- Localized fuelwood shortages in Africa impose burdens on people who depend on fuelwood for home heating and cooking (SG3.4). The impact on people may be high prices in urban areas or lengthy and arduous travel to collect wood in rural areas.
- Among agricultural fibers, global cotton production has doubled and silk production has tripled since 1961 (C9.ES). Despite this doubling of production, the land area on which cotton is harvested has stayed virtually the same. Production of flax, wool, hemp, jute, and sisal has declined. For example, competition from synthetic fabrics has contributed to a reduction in the demand for wool in recent decades; wool production declined 16% between 1980 and 2000 (C9.5.3).
Scenarios
- Plantations are likely to provide an increasing proportion of timber products in the future (C9.ES). In 2000, plantations were 5% of the global forest cover, but they provided some 35% of harvested roundwood, an amount anticipated to increase to 44% by 2020. The most rapid expansion will occur in the midlatitudes, where yields are higher and production costs lower.
- Under the MA scenarios, forest area increases in industrial regions and decreases in developing ones between 1970 and 2050. In one scenario (Order from Strength), the rate of forest loss increases from the historic rate (of about 0.4% annually between 1970 and 1995) to 0.6%. In Global Orchestration and Adapting Mosaic, the rate of loss continues at the historic rate. Forest loss in TechnoGarden decreases in the first decades of the scenario period, but over the whole period is near the historic rate because the use of biofuels increases as part of climate change policies, leading to further pressure on forest area. (See Appendix Figure A.5.) (For particular ecosystems, such as tropical forests, deforestation rates might be higher than average.)
Biochemicals and Genetic Resources: Provisioning Services
A wide variety of species—microbial, plant, and animal— and their genes contribute to commercial products in such industries as pharmaceuticals, botanical medicines, crop protection, cosmetics, horticulture, agricultural seeds, environmental monitoring and a variety of manufacturing and construction sectors.
Condition and Trends
- Biodiversity is in increasing demand as a source of commercial material. An overview of the industries involved, trends in the use of biodiversity, and the types of social and commercial benefits is provided in Appendix Table A.1. Appendix Table A.2 is a partial list of compounds derived from natural sources approved for marketing within the pharmaceutical industry in the 1990s.

Scenarios
- Market trends vary widely according to the industry and country involved, but many bioprospecting activities and revenues are expected to increase over the next decades. Several major new industries, such as bioremediation and biomimetics, are well established and appear set to increase, while others have a less certain future. The current economic climate suggests that pharmaceutical bioprospecting will increase, especially as new methods that use evolutionary and ecological knowledge enhance productivity (C10.ES).

Climate Regulation: Regulating Services
Ecosystems, both natural and managed, exert a strong influence on climate and air quality as sources and sinks of pollutants, reactive gases, greenhouse gases, and aerosols and due to physical properties that affect heat fluxes and water fluxes (precipitation). Ecosystems can affect climate in the following ways: warming (as sources of greenhouse gases, for instance, or forests with lower albedo than bare snow); cooling (as sinks of greenhouse gas, sources of some aerosol that reflect solar radiation, and evapotranspiration, for example); and by altering water redistribution/recycling and regional rainfall patterns (through evapotranspiration, for instance, or cloud condensation nuclei).
Condition and Trends
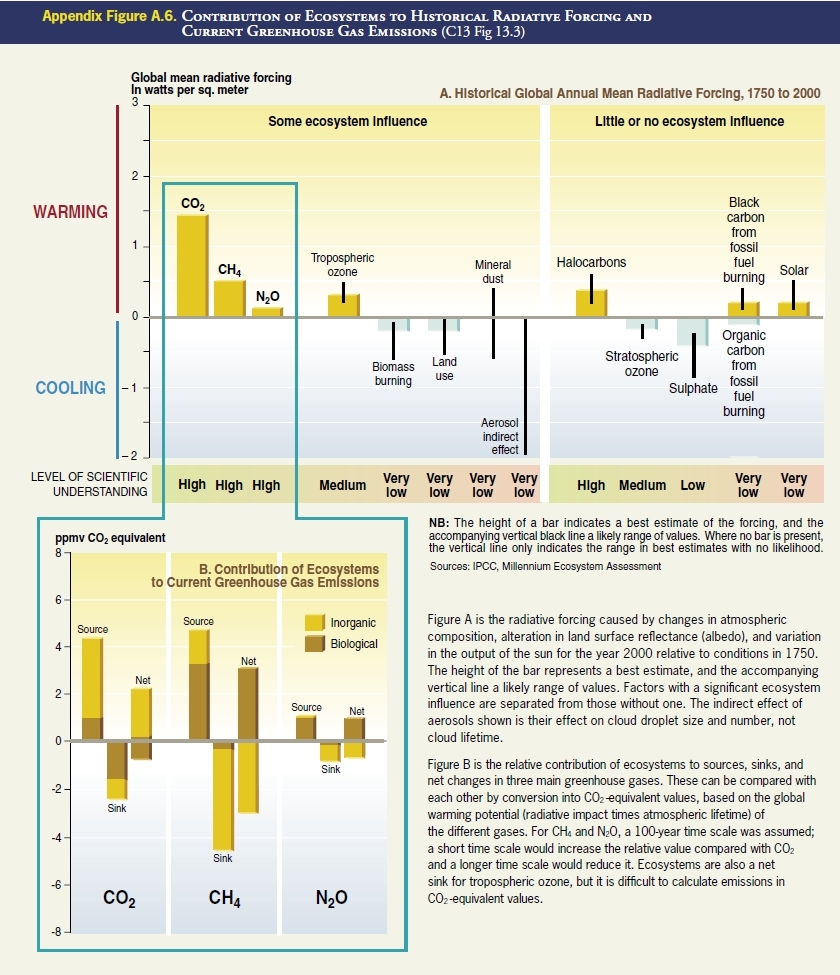
- Changes in ecosystems have made a large contribution to historical changes in Radiative forcing from 1750 to the present mainly due to deforestation, fertilizer use, and agricultural practices (C13.ES). (See Appendix Figure A.6.) Ecosystem changes account for about 10–30% of the radiative forcing of CO2 since 1750 and a large proportion of the radiative forcing due to CH4 and N2O. Ecosystems are currently a net sink for CO2 and tropospheric ozone, while they remain a net source of CH4 and N2O. Future management of ecosystems has the potential to modify concentrations of a number of greenhouse gases, although this potential is likely to be small in comparison to IPCC scenarios of fossil fuel emissions over the next century (high certainty). Ecosystems influence the main anthropogenic greenhouse gases as follows:
- Carbon dioxide: About 40% of the historical emissions (over the last two centuries), and about 20% of current CO2 emissions (in the 1990s), originated from changes in land use and land management, primarily deforestation. Terrestrial ecosystems were a sink for about a third of cumulative historical emissions and a third of total emissions in the 1990s (energy plus land use). The sink may be explained partially by afforestation, reforestation, and forest management in North America, Europe, China, and other regions and partially by the fertilizing effects of N deposition and increasing atmospheric CO2. Terrestrial ecosystems were on average a net source of CO2 during the nineteenth and early twentieth centuries and became a net sink sometime around the middle of the last century (high certainty). The net impact of ocean biology changes on global CO2 fluxes is unknown.
- Methane: Natural processes in wetland ecosystems account for about 25–30% of current methane emissions, and about 30% of emissions are due to agriculture (ruminant animals and rice paddies).
- Nitrous oxide: Ecosystem sources account for about 90% of current N2O emissions, with 35% of emissions from agricultural systems, primarily driven by fertilizer use.
- Tropospheric ozone: Dry deposition in ecosystems accounts for about half the tropospheric ozone sink. Several gases emitted by ecosystems, primarily due to biomass burning, act as precursors for tropospheric ozone formation (NOX, volatile organic compounds, CO, CH4). The net global effect of ecosystems is as a sink for tropospheric O3.
- During much of the past century, most cropping systems have undergone a steady net loss of soil organic matter. However, with the steady increase in crop yields, which increases crop biomass and the amount of residue returned to the soil, and with the adoption of conservation tillage and no-till cropping systems, net carbon sequestration is estimated to occur in the maize-soybean systems of North America and in some continuous irrigated lowland rice systems. Agriculture accounts for 44% of anthropogenic methane emissions and about 70% of anthropogenic nitrous oxide gases, mainly from the conversion of new land to agriculture and nitrogen fertilizer use (C26.2.6).
- Terrestrial and marine plants fix atmospheric CO2 and return it via respiration. In the ocean, some of the carbon sinks in the form of dead organisms, particles, and dissolved organic carbon, a small amount of which remains in sediments; the rest is respired at depth and eventually recirculated to the surface (the “biological pump”). The biological pump acts as a net sink for CO2 by increasing its concentration at depth, where it is isolated from the atmosphere for decades to centuries, causing the concentration of CO2 in the atmosphere to be about 200 parts per million lower than it would be in the absence of life (C13.2.1). On the land large amounts of carbon fixed by plants are stored in soil organic matter.
- Land cover changes since 1750 have increased the reflectivity to solar radiation (albedo) of the land surface (medium certainty), partially offsetting the warming effect of associated CO2 emissions (C13.ES). Deforestation and desertification in the tropics and sub-tropics leads to a reduction in regional rainfall (high certainty). Biophysical effects need to be accounted for in the assessment of options for climate change mitigation. For example, the warming effect of reforestation in seasonally snow-covered regions due to albedo decrease is likely to exceed the cooling effect of additional carbon storage in biomass. Biophysical effects of ecosystem changes on regional climate patterns depend on geographical location and season. With high certainty:
- Deforestation in seasonally snow-covered regions leads to regional cooling of the land surface during the snow season due to increase in surface albedo, and it leads to warming during the summer due to reduction in evapotranspiration.
- Large-scale tropical deforestation (hundreds of square kilometers) reduces regional rainfall, primarily due to decreased evapotranspiration.
- Desertification in the tropics and sub-tropics leads to decrease in regional precipitation due to reduced evapotranspiration and increased surface albedo.

Scenarios
- The future contribution of terrestrial ecosystems to the regulation of climate is uncertain. Currently, the biosphere is a net sink of carbon, absorbing about 1–2 gigatons of carbon per year, or approximately 20% of fossil fuel emissions. It is very likely that the future of this service will be greatly affected by expected land use change. In addition, a higher atmospheric CO2 concentration is expected to enhance net productivity, but this does not necessarily lead to an increase in the carbon sink. The limited understanding of soil respiration processes generates uncertainty about the future of the carbon sink. There is medium certainty that climate change will increase terrestrial fluxes of CO2 and CH4 in some regions (such as in Arctic tundras) (S9.ES).
Disease Regulation: Regulating Services
The availability of many ecosystem services, such as food, water, and fuel, can profoundly influence human health (R16). Here, we consider a much narrower service provided by ecosystems related to human health: the role of ecosystems in regulating infectious disease. Ecosystem changes have played an important role in the emergence or resurgence of infectious diseases. (See Appendix Table A.3.) Ecosystem modifications associated with developments such as dam building and the expansion of agricultural irrigation, for example, have sometimes increased the local incidence of infectious diseases such as malaria, schistosomiasis, and arbovirus infections, especially in the tropics. Other modifications to ecosystems have served to reduce the incidence of infectious disease.
Condition and Trends
- Infectious diseases still account for close to one quarter of the global burden of disease. Major tropical diseases, particularly malaria, meningitis, leishmaniasis, dengue, Japanese encephalitis, African trypanosomiasis, Chagas disease, schistosomiasis, filariasis, and diarrheal diseases still infect millions of people throughout the world (very certain) (C14.ES).
- The prevalence of the following infectious diseases is particularly strongly influenced by ecological change: malaria across most ecological systems; schistosomiasis, lymphatic filariasis, and Japanese encephalitis in cultivated and inland water systems in the tropics; dengue fever in tropical urban centers; leishmaniasis and Chagas disease in forest and dryland systems; meningitis in the Sahel; cholera in coastal, freshwater, and urban systems; and West Nile virus and Lyme disease in urban and suburban systems of Europe and North America (high certainty) (C14.ES).
- Various changes to ecosystems can affect disease incidence through a variety of mechanisms. Disease/ecosystem relationships that best exemplify these biological mechanisms include the following examples (C14.ES):
- Dams and irrigation canals provide ideal habitat for snails that serve as the intermediate reservoir host species for schistosomiasis; irrigated rice fields increase in the extent of mosquito-breeding surface, increasing the chance of transmission of mosquito-borne malaria, lymphatic filariasis, Japanese encephalitis, and Rift Valley fever.
- Deforestation has increased the risk of malaria in Africa and South America by increasing habitat suitable for malaria-transmitting mosquitoes.
- Natural systems with preserved structure and characteristics generally resist the introduction of invasive human and animal pathogens brought by human migration and settlement. This seems to be the case for cholera, kala-azar, and schistosomiasis, which did not become established in the Amazonian forest ecosystem (medium certainty).
- Uncontrolled urbanization in the forest ecosystem has been associated with mosquito-borne viruses (arboviruses) in the Amazon and with lymphatic filariasis in Africa. Tropical urban areas with poor water supply systems and lack of shelter promote transmission of dengue fever.
- There is evidence that habitat fragmentation, with subsequent biodiversity loss, increases the prevalence in ticks of the bacteria that causes Lyme disease in North America (medium certainty).
- Zoonotic pathogens (defined by their natural life cycle in animals) are a significant cause of both historical (such as HIV and tuberculosis) and newly emerging infectious diseases affecting humans (such as SARS, West Nile virus, and Hendra virus). In addition, zoonotic pathogens can cause high case-fatality rates and are difficult to vaccinate against, since the primary reservoir hosts are non-humans.
- Intensive livestock agriculture that uses subtherapeutic doses of antibiotics has led to the emergence of antibiotic- resistant strains of Salmonella, Campylobacter, and Escherichia coli bacteria. Overcrowded and mixed livestock practices, as well as the trade in bushmeat, can facilitate interspecies host transfer of disease agents, leading to dangerous novel pathogens such as SARS and new strains of influenza.


Scenarios
- Tropical developing countries are more likely to be affected in the future due to the greater exposure of people in these countries to vectors of infectious disease transmission. Such populations have a scarcity of resources to respond to disease and to plan environmental modifications associated with economic activities (high certainty). However, international trade and transport leave no country entirely unaffected (S11).
- The health consequences under the MA scenarios related to changes in the disease regulation service of ecosystems vary widely, with some scenarios showing improving conditions and others declining conditions (S11).
Waste Treatment: Regulating Services
Because the characteristics of both wastes and receiving ecosystems vary, environments vary in their ability to absorb wastes and to detoxify, process, and sequester them. Some contaminants (such as metals and salts) cannot be converted to harmless materials, but others (organic chemicals and pathogens, for example) can be degraded to harmless components. Nevertheless, these materials may be released to the environment fast enough to modify ecosystem functioning significantly. Some materials (such as nutrient fertilizers and organic matter) are normal components of organism metabolism and ecosystem processes. Nevertheless, loading rates of these materials may occur fast enough to modify and impair ecosystem function significantly.
Condition and Trends
- The problems associated with wastes and contaminants are in general growing. Some wastes—sewage, for instance—are produced in nearly direct proportion to population size. Other types of wastes and contaminants reflect the affluence of society. An affluent society uses and generates a larger volume of waste-producing materials such as domestic trash and home-use chemicals (C15.ES).
- Where there is significant economic development, loadings of certain wastes are expected to increase faster than [[population (Population growth rate)] growth]. The generation of some wastes (industrial waste, for example) does not necessarily increase with population or development state. These wastes may often be reduced through regulation aimed to encourage producers to clean discharges or to seek alternate manufacturing processes (C15.ES).
- In developing countries, 90–95% of all sewage and 70% of industrial wastes are dumped untreated into surface water (C7.4.5). Regional patterns of processing nitrogen loads in freshwater ecosystems provide a clear example of the overloading of the waste processing service of ecosystems.
- Aquatic ecosystems “cleanse” on average 80% of their global incident nitrogen loading but this intrinsic self-purification capacity of these ecosystems varies widely and is not unlimited (C7.2.5).
- Severe deterioration in the quality of fresh water is magnified in cultivated and urban systems (high use, high pollution sources) and in dryland systems (high demand for flow regulation, absence of dilution potential) (C7.ES).
Scenarios
- It is neither possible nor appropriate to attempt to state whether the intrinsic waste detoxification capabilities of the planet as a whole will increase or decrease with a changing environment. The detoxification capabilities of individual locations may change with changing conditions (such as changes in soil moisture levels). At high waste-loading rates, however, the intrinsic capability of environments is overwhelmed, such that wastes will build up in the environment to the detriment of human well-being and a loss of biodiversity (C15.ES).
- The service of water purification could be either enhanced or degraded in both developing and industrial countries under the MA Scenarios (S9.5.4). Within industrial countries, the dilution capacity of most rivers increases because higher precipitation leads to increases in runoff in most river basins. Wetland areas decrease because of the expansion of population (Population growth rate) and agricultural land. Wastewater flows increase, but in some scenarios the wealth of the North enables it to repair breakdowns in water purification as they occur. Within developing countries, the pace of ecosystem degradation, the overtaxing of ecosystems by high waste loads, and the decline of wetland area because of the expansion of population and [[agricultural] land] tend to drive a deterioration of water purification in two scenarios. The Adapting Mosaic scenario, however, could lead to some gains in water purification even in developing countries, and the TechnoGarden scenario would also result in gains.
Natural Hazard Regulation: Regulating Services
Ecosystems play important roles in modulating the effects of extreme events on human systems. Ecosystems affect both the probability and severity of events, and they modulate the effects of extreme events. Soils store large amounts of water, facilitate transfer of surface water to groundwater, and prevent or reduce flooding. Barrier beaches, wetlands, and lakes attenuate floods by absorbing runoff peaks and storm surges.
Condition and Trends
- Humans are increasingly occupying regions and localities that are exposed to extreme events, (such as on coasts and floodplains or close to fuelwood plantations). These actions are exacerbating human vulnerability to extreme events, such as the December 2004 tsunami in the Indian Ocean. Many measures of human vulnerability show a general increase due to growing poverty, mainly in developing countries (C16.ES).
- Roughly 17% of all the urban land in the United States is located in the 100-year flood zone. Likewise, in Japan about 50% of the population lives on floodplains, which cover only 10% of the land area. In Bangladesh, the percentage of floodprone areas is much higher and inundation of more than half of the country is not uncommon. For example, about two thirds of the country was inundated in the 1998 flood (C16.2.2).
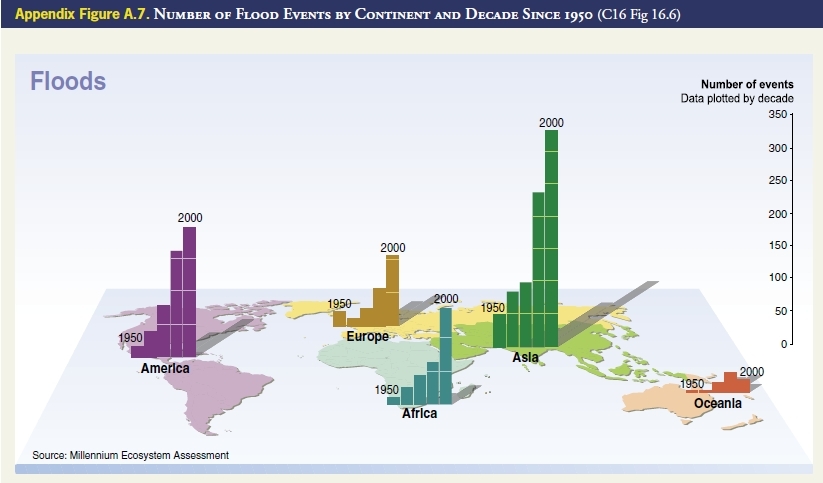
- Many of the available datasets on extreme events show that impacts are increasing in many regions around the world. From 1992 to 2001, floods were the most frequent natural disaster (43% of 2,257 disasters), and they killed 96,507 people and affected more than 1.2 billion people over the decade. Annual economic losses from extreme events increased tenfold from the 1950s to the 1990s (C16.ES).
- The loss of ecosystems such as wetlands and mangroves has significantly reduced natural mechanisms of protection from natural hazards. For example, forested riparian wetlands adjacent to the Mississippi River in the United States during pre-settlement times had the capacity to store about 60 days of river discharge. With the removal of wetlands through canalization, leveeing, and draining, the remaining wetlands have a storage capacity of less than 12 days discharge—an 80% reduction of flood storage capacity (C16.1.1).
- The number of floods and fires increased significantly on all continents over the past 60 years. (See Appendix Figures A.7 and A.8.)
- Within industrial countries, the area burned by fires is declining but the number of major fires is increasing. In the United States, for example, the area burned has declined by more than 90% since 1930, while in Sweden the area burned annually fell from about 12,000 hectares in 1876 to about 400 hectares in 1989. In North America, however, the number of fire “disasters”—10 or more people reportedly killed, 100 people reportedly affected, a declared state of emergency, and a call for international assistance—increased from about 10 in the 1980s to about 45 during the 1990s (C16.2.2).


Cultural Services
Human cultures, knowledge systems, religions, social interactions, and amenity services have been influenced and shaped by the nature of ecosystems. At the same time, humankind has influenced and shaped its environment to enhance the availability of certain valued services. Recognizing that it is not possible to fully separate the different spiritual, intellectual, and physical links between human cultures and ecosystems, the MA assessed six main types of cultural and amenity services provided by ecosystems: cultural diversity and identity; cultural landscapes and heritage values; spiritual services; inspiration (such as for arts and folklore); aesthetics; and recreation and tourism. Because global aggregated information on the condition of cultural services was limited (with the partial exception of recreational and tourism benefits), the section below draws significantly on information in the MA sub-global assessments.
Condition and Trends
- Transformation of once diverse ecosystems into relatively more similar cultivated landscapes, combined with social and economic changes including rapid urbanization, breakdown of extended families, loss of traditional institutions, easier and cheaper transportation, and growing economic and social “globalization,” has significantly weakened the linkages between ecosystems and cultural diversity and cultural identity (C17.2.1). Throughout human evolution, human societies have developed in close interaction with the natural environment, which has shaped their cultural identity, value systems, and language.
- The loss of particular ecosystem attributes (sacred species or sacred forests), combined with social and economic changes, can sometimes weaken the spiritual benefits people obtain from ecosystems in many parts of the world (C17.2.3). On the other hand, under some circumstances (such as where ecosystem attributes are causing significant threats to people) the loss of some attributes may enhance spiritual appreciation for what remains.
- People across cultures and regions express, in general, an aesthetic preference for natural environments over urban or built ones; the conversion and degradation of relatively natural environments has diminished these benefits. Ecosystems continue to inspire arts, songs, drama, dance, design, and fashion, although the stories told through such media are different from those told historically (C17.2.5).
- Recreation and tourism uses of ecosystems are growing, due to growing [[population (Population growth rate)]s (Population growth rate)], greater leisure time available among wealthy populations, and greater infrastructure development to support recreational activities and tourism. Nature travel increased at an estimated rate of 10–30% annually in the early 1990s, and in 1997 nature tourism accounted for approximately 20% of total international travel (C17.2.6). Tourism is now the primary economic development strategy for a number of developing countries.
- Tourism is an important component of the economies of many of the MA sub-global assessment study areas, and at all scales most assessment stakeholders requested its inclusion. In contrast, spiritual, religious, recreational, and educational services tended to be assessed only at a fine scale in small local studies, typically because the data required for these assessments are not available at a broad scale and because of the culture-specific, intangible, and sometimes sensitive nature of these services (SG8.3).
- Within the MA sub-global assessments, cultural services of tourism and recreation were generally in a good condition and growing, although some assessments expressed concerns about tourist activities potentially reducing the capacity of ecosystems to provide this cultural service (SG8.3).
- In contrast, within the MA sub-global assessments local-scale services of a spiritual nature are of a variable condition, typically either collapsing or being revived, depending on policies, interventions, and context-specific factors such as changes in leadership (SG8.3). Spiritual values were found to act as strong incentives for ecosystem conservation in sub-global assessments in Peru, Costa Rica, India, and some parts of Southern Africa. Educational services of ecosystems assessed in Sweden, São Paulo, and Portugal are all increasing due to growing levels of awareness of the value and benefits of, and thus the demand for, environmental education.
- While provisioning services such as water, medicinal plants, fuelwood, and food are very important, spiritual and sacred elements in the local landscape also have a very specific and important value to local people across all the assessments. In several cases, spiritual values coincided with other values, such as biodiversity, water supply, biomedicines, and fuel (SG11.3).
Scenarios
- The MA Scenarios project changes in cultural services based only on a qualitative analyses due to the absence of suitable quantitative models. Cultural services increase in some scenarios and decline in others. Generally, cultural services decline moderately in Global Orchestration and strongly in Order from Strength, driven in both cases by lack of personal experience with nature and lower cultural diversity. Lower cultural diversity also drives a decline in cultural services in the TechnoGarden scenario. On the other hand, cultural services increase in Adapting Mosaic, due in part to the increase in knowledge systems and cultural diversity (S9.7).
Nutrient Cycling: Supporting Services

Condition and Trends
- The capacity of terrestrial ecosystems to absorb and retain the nutrients supplied to them either as [[fertilizer]s] or from the deposition of airborne nitrogen and sulfur has been undermined by the radical simplification of ecosystems into large-scale, low-diversity agricultural landscapes. Excess nutrients leak into the groundwater, rivers, and lakes and are transported to the coast. Treated and untreated sewage released from urban areas adds to the load (C.SDM).
- In preindustrial times, the annual flux of nitrogen from the atmosphere to the land and aquatic ecosystems was roughly 110– 210 teragrams of nitrogen a year. Human activity contributes an additional 165 teragams or so of nitrogen per year, roughly doubling the rate of creation of reactive N on the land surfaces of Earth (R9.2). (See Appendix Figure A.9.)
- The N accumulation on land and in waters has permitted a large increase in food production in some countries, but at the cost of increased emissions of greenhouse gases and frequent deterioration in freshwater and coastal ecosystem services, such as water quality, fisheries (Fisheries and aquaculture), and amenity values (C12.ES).
- Phosphorus is also accumulating in ecosystems at a rate of 10.5–15.5 teragrams per year, compared with a preindustrial rate of 1–6 teragrams per year, mainly as a result of the use of phosphorus (obtained through mining) in agriculture. Most of this accumulation is in soils. If these [[soil]s] erode into freshwater systems, deterioration of ecosystem services can result. This tendency is likely to spread and worsen over the next decades, since large amounts of P have been accumulated on land and their transport to water systems is slow and difficult to prevent (C12.ES).
- Sulfur emissions have been progressively reduced in Europe and North America but not yet in the emerging industrial areas of the world: China, India, South Africa, and the southern parts of South America. A global assessment of acid deposition threats suggests that tropical ecosystems are at high risk (C12.ES).
- Human actions at all scales required to feed the current world population have increased the “leakiness” of ecosystems with respect to nutrients. Tillage often damages soil structure, and the loss of biodiversity may increase nutrient leaching. Simplification of the landscape and destruction of riparian forests, wetlands, and estuaries allow unbuffered flows of nutrients between terrestrial and water ecosystems. Specific forms of biodiversity are critical to performing the buffering mechanisms that ensure the efficient use and cycling of nutrients in ecosystems (C12.ES).
- In contrast to these issues associated with nutrient oversupply, there remain large parts of Earth, notably in Africa and Latin America, where harvesting without nutrient replacement has led to a depletion of soil fertility, with serious consequences for human nutrition and the environment (C12.ES).

- Recent scenario studies that include projections of nitrogen fertilizer use indicate an increase of between 10% and 80% (or more) by 2020 (S9.3.7).
- Three out of four MA scenarios project that the global flux of nitrogen to coastal ecosystems will increase by a further 10– 20% by 2030 (medium certainty). River nitrogen will not change in most industrial countries, while a 20–30% increase is projected for developing countries. This is a consequence of increasing nitrogen inputs to surface water associated with urbanization, sanitation, development of sewerage systems, and lagging wastewater treatment, as well as increasing food production and associated inputs of nitrogen fertilizer, animal manure, atmospheric nitrogen deposition, and biological nitrogen fixation in agricultural systems. Growing river nitrogen loads will lead to increased incidence of problems associated with eutrophication in coastal seas (S9.3.7).
Terms of Use
The copyright for material on this page is the property of the World Resources Institute. Click here for the Terms of Use (Ecosystems and Human Well-being Synthesis: Appendix A. Ecosystem Service Reports).
Disclaimer: This chapter is taken wholly from, or contains information that was originally written for the Millennium Ecosystem Assessment as published by the World Resources Institute. The content has not been modified by the Encyclopedia of Earth.
|
|