Permafrost and infrastructure in the Arctic
This is Section 6.2.2 of the Arctic Climate Impact Assessment.
Lead Author: Arne Instanes; Contributing Authors: Oleg Anisimov, Lawson Brigham, Douglas Goering, Lev N. Khrustalev, Branko Ladanyi, Jan Otto Larsen; Consulting Authors: Orson Smith, Amy Stevermer, Betsy Weatherhead, Gunter Weller
Permafrost underlies most of the surfaces in the terrestrial Arctic. Permafrost depths vary from a few to many hundreds of meters[1]. At selected locations in Yakutia with a cold continental climate, permafrost occurs to depths of 1500 m. Most biogeochemical and hydrological processes in permafrost are confined to the active (seasonally thawed) layer, which varies from several tens of centimeters to several meters in depth. Seasonal thaw depth and the temperature of the frozen ground are two important parameters that must be accounted for in the design of infrastructure built on permafrost. These parameters control key cryogenic processes, such as creep, thaw settlement, adfreeze bond (bond between frozen soil and the material embedded in it), frost heave, and frost jacking (annually repeated foundation uplift caused by frost heave; see Andersland and Ladanyi[2] for further discussion of these processes). Seasonal thaw depth and frozen-ground temperature both depend on ground-surface temperature, heat flow from the interior of the earth, snow cover, vegetation, and soil properties.
Owing to their low thermal conductivity, snow cover and vegetation (with the underlying organic layer) attenuate annual variations in air temperature and are important regulators of permafrost temperature and depth of seasonal thaw at the local scale. The temperature of permafrost under a thick layer of snow may be several degrees higher than in nearby permafrost that lacks snow cover. In summer, the thermal conductivity of the vegetation and underlying organic layer is typically much smaller than in winter. This reduces summer heat fluxes and keeps permafrost temperatures lower than they would be in the absence of vegetation. A controlled experiment near Fairbanks, Alaska, produced permafrost degradation to a depth of 6.7 m over a 26-year period, simply by removing the insulating layer of vegetation[3]. Finally, thermal conductivity is typically 20 to 35% lower in thawed mineral soils than in frozen mineral soils. Consequently, the mean annual temperature below the level of seasonal thawing may be 0.5 to 1.5 ºC lower than on the ground surface.
The extreme arctic environment requires unique cold regions engineering and infrastructure solutions that account for severe climate conditions, the presence of permafrost, and various cryogenic processes that may have destructive effects on structures. Since infrastructure is designed to withstand variations in environmental parameters within a prescribed range, information about past changes in arctic climate and environmental conditions is crucial for developing optimum engineering solutions for future infrastructure and safe management of existing structures.
Contents
- 1 Observed changes in permafrost (16.2.2.1.)
- 2 Observed changes in freezing and thawing indices (16.2.2.2)
- 3 Projected changes in permafrost (16.2.2.3)
- 4 Projected changes in freezing and thawing indices (16.2.2.4)
- 5 Engineering concerns (16.2.2.5)
- 6 Areas south of the permafrost border (16.2.2.6)
- 7 Summary (16.2.2.7)
- 8 References
- 9 Citation
Observed changes in permafrost (16.2.2.1.)
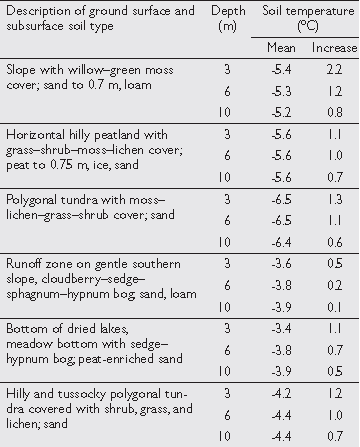
Changes in permafrost temperature due to increasing air temperatures were observed in Russia as early as 1970. Pavlov[5] presented data indicating that the mean annual permafrost temperature increased by 2.0 to 2.5 ºC at a depth of 3 m and by 1.0 ºC at a depth of 10 m between 1979 and 1995. Observations of soil temperature changes at the Marre-Sale geocryological station in the southwestern region of the Yamal Peninsula (Table 16.1) are especially illustrative. Similar changes have been observed in Alaska[6] and elsewhere (section 6.6.1.2). Changes in active-layer thickness have also been observed. The Global Terrestrial Network for Permafrost (GTN-P) and the Circumpolar Active Layer Monitoring (CALM) program were established to monitor such changes.
The GTN-P was initiated by the International Permafrost Association (IPA) to organize and manage a global network of permafrost observatories for detecting, monitoring, and projecting climate change[7].The network, authorized under the Global Climate Observing System and its associated organizations, consists of two observational components: the active layer and the thermal state of the underlying permafrost. CALM, established in 1990, provides the active-layer monitoring component[8], while GTN-P provides monitoring of the thermal state of the permafrost.The European Community project, Permafrost and Climate in Europe, contributes to the GTN-P and monitors nine boreholes in mountain permafrost[9].
Observed changes in freezing and thawing indices (16.2.2.2)
The strength and deformation characteristics of frozen soils are dependent on soil type, temperature, density, ice content, unfrozen water content, salinity, stress state, and strain rate (section 16.2.2.5).Thawing of frozen soil, or even an increase in the temperature of frozen soil, may lead to deteriorating strength and deformation characteristics, accelerated settlement, and possible foundation failure.
The design of foundations in permafrost regions must, therefore, always include an evaluation of the maximum active-layer thickness and permafrost temperature that may occur in the foundation soils during the lifetime of the structure. The initial and long-term bearing capacity of the foundation can then be determined. Table 16.1. Soil temperatures measured between 1979 and 1995 at the Marre-Sale station, southwestern Yamal Peninsula, Russia[10].
|
Table 16.2. Number of meteorological stations in each ACIA region[11]. | ||
| ACIA region | Number of stations | |
| Iceland | 1 | 1 |
| Svalbard | 1 | 1 |
| Norway and Finland | 1 | 2 |
| Northwest Russia | 1 | 1 |
| Siberia | 2 | 3 |
| Alaska | 3 | 5 |
| Canada | 4 | 3 |
| Greenland | 4 | 2 |
| Region 1:Arctic Europe, East Greenland, European Russian North, North Atlantic Region 2: Central Siberia Region 3: Chukotka, Bering Sea, Alaska, western arctic Canada Region 4: Northeast Canada, Labrador Sea, Davis Strait, West Greenland | ||
Instanes A.[12] presented a review of the use of air freezing and thawing indices for permafrost engineering design. The air thawing index (ATI) is a useful parameter to determine the “magnitude” of the thawing season and can be used to calculate active-layer thickness and maximum permafrost temperatures. The air thawing index is defined as the integral of the sinusoidal variation in mean daily or monthly air temperature (T) during one year for T >0 ºC (the air freezing index, AFI, is defined as the integral of the sinusoidal air temperature variation during one year for T <0 ºC). Ground-surface temperatures differ from air temperatures. If observations of ground-surface temperatures are not available, they can be estimated from air temperatures using an empirically determined n-factor.
Andersland and Ladanyi[13] listed approximate n-factors for different types of surfaces. Variations in snow cover will also affect ground temperatures. Instanes A. and Mjureke[14] carried out an extensive analysis of historic freezing and thawing indices for arctic meteorological stations. Many of these stations have more than 100 years of continuous temperature records. The data used in this analysis were mean monthly air temperatures from Russian datasets provided by O. Anisimov[15].
Twenty-one stations were chosen for this study, using the following criteria:
- the four ACIA regions (section 18.3) should be represented;
- station time series should be of considerable length (>30 years);
- station time series should be continuous;
- priority should be given to meteorological stations located near population concentrations and major infrastructure; and
- stations should be evenly distributed throughout the Arctic.
All the stations are north of 60º N and within the area covered by the Arctic Monitoring and Assessment Programme (AMAP) and the ACIA.
From an engineering point of view, current and past design levels of thawing and freezing indices are of interest mainly in comparison with values projected for the future. The impact of climate change on arctic infrastructure will be very dependent on how future temperature levels relate to past design levels and historic variability at a specific site. However, an analysis of historic records in terms of freezing and thawing indices can provide indications of temperature increases between 1981 and 2000[16].
Table 16.3 presents the percentage of unusually warm summers and unusually warm winters between 1981 and 2000. An unusually warm summer is defined as having an ATI higher than the mean value for the entire station record plus one standard deviation; an unusually warm winter is defined as having an AFI lower than the mean value for the entire station record minus one standard deviation.
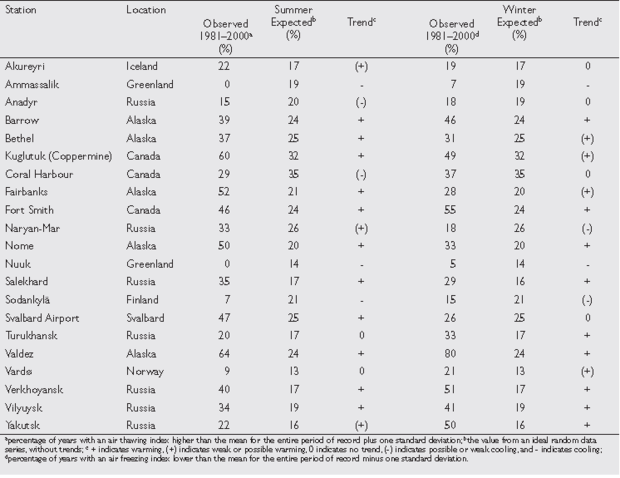
Five stations exhibit both significant winter air temperature increases after 1970 and an unusually high frequency of warm winter events between 1981 and 2000.These stations are Fort Smith (Canada),Valdez (Alaska), and Verkhoyansk,Vilyuysk, and Yakutsk (central Russia). Four additional stations had a significantly high frequency of warm winter seasons between 1981 and 2000: Barrow and Nome (Alaska), and Salekhard and Turukhansk (central Russia).Two Greenland stations, Ammassalik and Nuuk, show clear evidence of a recent decrease in winter air temperatures.
Eight stations show evidence of significant recent summer air temperature increases in combination with a significantly high number of very warm summer seasons between 1981 and 2000 compared to the entire period of record. These are Barrow, Fairbanks, Nome, and Valdez (Alaska); Kuglutuk (Coppermine) and Fort Smith (Canada); Svalbard Airport; and Verkhoyansk (Central Russia). Bethel (Alaska) and Salekhard and Vilyuysk (central Russia) had a significantly high frequency of warm summer seasons between 1981 and 2000.
The two Greenland stations and Sodankylä (Finland) show evidence of recent air temperature decreases in both the mean ATI and the extreme summer values. The results suggest a spatial pattern of recent climate change and are in agreement with results from other studies[18]. According to Table 16.3, temperatures have increased in central Russia, Alaska, and western Canada, while temperatures have decreased in southern Greenland. The trends are less clear in the Nordic countries and northwestern Russia.
Projected changes in permafrost (16.2.2.3)
A constant rate of increase in air temperature is projected to have two related effects on ground temperature:
- an increase in the mean annual temperature at the ground surface, which will slowly propagate to greater depths and, depending on latitude, produce either a thinning or a complete disappearance of the permafrost layer; and
- changes in the annual amplitude of seasonal ground-temperature variation, damped with depth, and affected by related changes in precipitation (snow cover), groundwater hydrology, and vegetation. However, Riseborough[19] pointed out that at temperatures close to 0 ºC, latent heat effects may dominate and result in a smaller amplitude depending on the ice content of the soils.
Climate change is very likely to reduce the area occupied by frozen ground and to cause shifts between the zones of continuous, discontinuous, and sporadic permafrost. These changes can be projected using mathematical models of permafrost driven by scenarios of climate change. Projections of permafrost change in 2030, 2050, and 2080 using output from the five ACIA-designated climate models are presented in section 6.6.1.3.
The potential effects of increasing mean annual ground surface temperature on permafrost will be very different for continuous and discontinuous permafrost zones. In the continuous zones, increasing air temperatures are very likely to increase permafrost temperatures and possibly increase the depth of the active layer[20]. In the discontinuous zone, the effects of a few degrees increase in the mean annual permafrost temperature are very likely to be substantial[21]. Since the temperature of most of this permafrost is presently within a few degrees of the melting point, the permafrost is likely to disappear. Except for the southernmost zone of sporadic permafrost, many centuries will be required for the frozen ground to disappear entirely. However, increases in active-layer depth and thawing of the warmest permafrost from the top have already been observed[22].
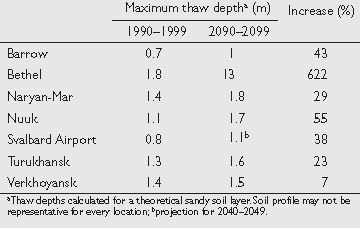
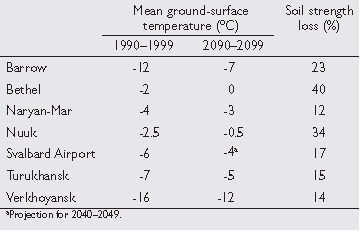
Anisimov et al.[25] used a permafrost model and climate scenarios for 2050 produced by general circulation models (GCMs) to project changes in active layer thickness in the Arctic. The results of this study indicated that changes in active-layer thickness will vary by region, increasing by 10 to 15% to more than 50% between the mid-1990s and 2050. Instanes A. and Mjureke[26] used the ACIA-designated models (section 4.2.7) to project changes in active-layer thickness and maximum permafrost temperature for seven of the sites in Table 16.3: Barrow, Bethel, Naryan-Mar, Nuuk, Svalbard Airport, Turukhansk, and Verkhoyansk. The analysis used an identical soil profile with the same thermal properties for all the locations; therefore, it can only be used as an indication of relative climate differences between sites. The increase in maximum thaw depths between 1990–1999 and 2090–2099 and the changes in mean ground-surface temperature and soil bearing strength between 1990–1999 and 2090–2099 are presented in Tables 16.4 and 16.5, respectively. The response of permafrost to climate change involves an important temperature threshold associated with phase change beyond which future temperature increases will cause thawing of the frozen ground. The time required to reach this temperature threshold depends on the initial permafrost temperature and the rate of temperature increase. Table 16.6 presents projected changes in various types of permafrost soils for different rates of warming.
The projections discussed in this section suggest that a progressive increase in active-layer depth and temperature of the frozen ground is likely to be a relatively short-term reaction to climate change in permafrost regions. Changes in seasonal thaw depth are very likely to change the water-storage capacity of near-surface permafrost at local and regional scales, with substantial effects on vegetation, soil hydrology, and runoff, which will ultimately lead to changes in larger-scale processes such as landslides, erosion, and sedimentation.
With respect to cold-regions engineering and infrastructure in locations affected by permafrost, the temperature of the frozen ground and the depth of seasonal thawing is of critical importance for effective construction planning and the evaluation of potentially hazardous situations at existing facilities. Although the effects of an increase in mean annual air temperature on permafrost can be projected in a general sense, it is more difficult to project these effects for specific locations and regions. Factors such as microclimate, as well as soil type, ice content, and salinity will play a role, and may not necessarily be well known or readily projected[27].
Projected changes in freezing and thawing indices (16.2.2.4)
Freezing and thawing indices were calculated using mean monthly air temperatures projected for 2000 to 2100 by the ACIA-designated climate models for the 21 stations shown in Table 16.3[28]. Output from four of the five ACIA-designated models (CGCM2 – Canadian Centre for Climate Modelling and Analysis, CSM_1.4 – National Center for Atmospheric Research, GFDL-R30_c – Geophysical Fluid Dynamics Laboratory, and HadCM3 – Hadley Centre for Climate Prediction and Research) was used for the analysis, along with a composite four-model mean (MEAN4).

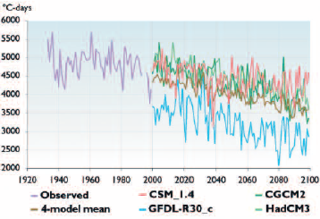
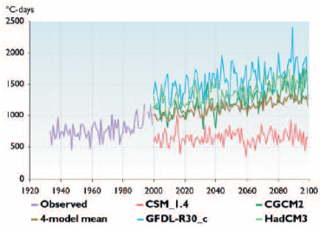
In addition, results from empirical downscaling[32] using the 2 m air temperature field from the ECHAM4/OPYC3 GSDIO integration (see section 4.6.2) were applied to Svalbard Airport. Figures 16.3 and 16.4 show observed and projected freezing and thawing indices for Kugluktuk (Coppermine), Canada, from 1933 to 2100.The indices for 1933 to 2000 were calculated from meteorological observations, while the indices from 2000 to 2100 are based on output from the ACIA-designated models. The figures show that the projections based on output from the different models “fit” the observed record to varying degrees. This is one of the major problems with using GCMs for impact studies. However, indices computed using output from the different models show generally similar trends. This suggests that the raw model output can probably be adjusted so that computed indices start where the observations leave off, providing better projections of future trends in freezing and thawing indices.
Plots similar to Figs. 16.3 and 16.4 showing observed and projected freezing and thawing indices for the 21 stations in Table 16.3 are reported by Instanes A. and Mjureke[33].
Engineering concerns (16.2.2.5)
The physical and mechanical properties of frozen soils are generally temperature-dependent, and these dependencies are most pronounced at temperatures within 1 to 2 ºC of the melting point. Esch and Osterkamp[34] summarize most of the engineering concerns related to permafrost warming as follows.
- Warming of permafrost body at depth.
a. Increase in creep rate of existing piles and footings. b. Increased creep of embankment foundations. c. Eventual loss of adfreeze bond support for pilings.
- Increases in seasonal thaw depth (active layer).
a. Thaw settlement during seasonal thawing. b. Increased frost-heave forces on pilings. c. Increased total and differential frost heave during winter.
- Development of residual thaw zones (taliks).
a. Decrease in effective length of piling located in permafrost. b. Progressive landslide movements. c. Progressive surface settlements.
Frozen-ground behavior
A constant rate of surface temperature increase due to projected climate change is very likely to lead to an increase in active-layer thickness. Woo et al.[35], Kane et al.[36], and Nakayama et al.[37] attempted to simulate numerically the increase in active-layer thickness projected to result from climate change. Comparable simulations have been performed for three locations in the Mackenzie Basin, Canada[38].
In contrast to frozen rocks and dense gravels, whose strength depends mainly on mineral bonds and internal friction, the bulk of the mechanical strength of finegrained frozen soils is due to ice bonding. Rising surface temperatures are likely to increase the unfrozen water content of fine-grained soils and decrease the ice bonding (cohesion) of soil particles, resulting in a gradual loss of strength in these soils.
Soil and rocks can be classified by their sensitivity to climate change, similar to the classification normally used in permafrost engineering. In order of increasing sensitivity (defined by the potential impacts of climate change on strength and thaw settlement), geological materials are classified as follows.
- Rocks
- dense, with ice only in pores; and
- shattered, with ice filling cracks and fissures (an existing rock mass classification system can be used for evaluating the degree of fragmentation and fissures).
- Gravels and sands (according to their density and moisture content).
- Silts (according to their density and moisture content).
- Clays (according to their density and moisture content).
- Organic soils and peat.
- Ground ice.
Andersland and Ladanyi[39] provided a more detailed classification of frozen soils.
Frozen soil will settle to a certain extent when completely thawed. For a given soil type, the amount of thaw settlement can be related to the increase in active-layer thickness, the soil bulk or dry density, and its ice saturation or total water content. Several correlations between the unit thaw settlement and the physical properties of frozen soils have been published[40]. One such correlation relates the percentage of thaw settlement to the frozen bulk density and is the preferred methodology for engineering purposes[41]. In the last 20 years, several such correlations between thaw settlement and frozen bulk density for a wide range of frozen soils have been published[42], and some have also been expressed by empirical equations. “Thaw sensitivity maps” for specific permafrost regions can be created using information from climate models, surficial geology maps, organic soil maps, ground temperature data, and the above-mentioned correlations. Smith S. et al.[43], Smith S. and Burgess[44] and Nelson F. et al.[45] have constructed such maps for Canada and the circumpolar Arctic.
The strength of frozen soil depends not only on temperature, but also on soil density, ice content, and salinity. It is also affected by the degree of confinement and the applied strain rate.
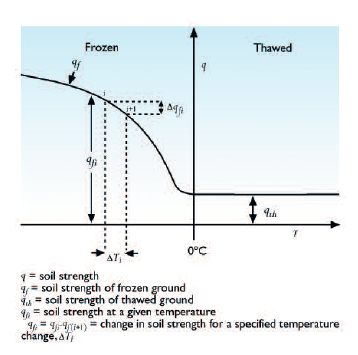
The sensitivity of frozen-soil strength to a temperature increase can be expressed by the ratio:

Equation 16.1
where qfi is the strength at temperature qi=-Ti, and ?qfi is its variation due to a temperature increase ?Ti (see Fig. 16.5). The strength sensitivity index can also be expressed in terms of frozen soil creep parameters[47].
The strength sensitivity index, ST, defined in equation 16.1, may be a useful measure for evaluating the loss of strength in frozen soils in regions where climate change is not projected to cause complete permafrost thawing. The index requires information about the temperature sensitivities of strength and creep in typical arctic soils. Although some information already exists, further laboratory and field tests of permafrost soils are required. By combining information about permafrost occurrence, soil types and characteristics, and projected climate change, it may be possible to construct maps of projected effects on permafrost. Such maps would show not only the projected trends in active-layer depth and permafrost thawing, but also the projected reduction in permafrost strength. Permafrost sensitivity maps of this kind would be useful for projecting the effects of climate change on existing facilities in the Arctic, and for establishing guidelines for the design of new facilities. Vyalov et al.[49] proposed the delineation of permafrost sensitivity zones in the Arctic, based on the mean annual ground temperature of permafrost (often measured at the level of negligible annual temperature amplitude, 10 to 20 m below the surface).
Frost heave is the result of ice lenses developing as soils freeze. Temperatures below 0 ºC and frost-susceptible soils are required for frost heave to occur, while the availability of water and the freezing rate determine the degree of frost heave. The first two conditions generally do not differ much between permafrost and seasonal freezing regions. However, the availability of groundwater for ice accumulation in the active layer is different in the two regions. The active layer is generally thinner in permafrost regions, thus the freezing rate is rapid and there is less time available for ice lens growth. In addition, the presence of nearly impermeable permafrost below the active layer may limit the water available for lens formation in permafrost areas, so that for comparable soil conditions there is less frost heave in permafrost regions than in regions of seasonal freezing. An increase in the mean annual air temperature is very likely to increase the thickness of the layer subjected to freeze-thaw cycles and subsequent frost heave.
Thaw settlement and pile creep
An increase in the mean annual air temperature in permafrost regions is very likely to lead to an increase in the thickness of the active layer, resulting in increased thaw settlement during seasonal thawing; and is very likely to lead to a decrease in frozen ground creep strength (long-term strength of frozen soil), resulting in an increase in the creep settlement rate of existing piles and footings.
Numerical simulations that assume a specific rate of warming have been used to project the degree of settlement effects on existing and future structures in the Arctic. Nixon[50] used a one-dimensional geothermal model and assumed a mean surface temperature increase of 0.1 ºC/yr for 25 years to examine the effects on thaw depth and pile creep settlement. The simulation of thaw depth below insulated surfaces in discontinuous permafrost projects a doubling of thaw depth after 25 years compared to a case with no temperature increase.
Thawing of permafrost soils can result in subsidence of the surface, thermokarst, and activation of freeze–thaw related processes such as solifluction. Parmuzin and Chepurnov[51] projected soil subsidence in sandy loam soils by 2100 given different rates of warming and different soil ice content (Table 16.7). Other studies have projected the thaw settlement potential for Mackenzie Basin soils[52]. Such projections of the possible consequences of climate change may help inform the design of future facilities in permafrost regions.
![Table 16.7. Projected soil subsidence between 2000 and 2100 due to the thawing of frozen deposits in sandy loam soils[9].](../../eoearth_images/7/73/620px-ACIA_Table_16.7.png)
Areas south of the permafrost border (16.2.2.6)
In the Arctic and subarctic, there are large land areas south of the permafrost border that experience frost action during winter. Annual freezing of the top soil layer commonly causes frost heave of foundations and structures. Highway structures and embankments located above the frost-heave zone usually experience increased surface roughness and bumps[53]. During the spring thaw, the bearing capacity of the structure may be considerably reduced, causing breakup of the pavement structure and failure of the embankment. It is possible that projected climate change will reduce the problems associated with winter frost action in these areas.
Summary (16.2.2.7)
It is possible that projected climate change will be a factor in engineering projects if its effects go beyond those anticipated within the existing conservative design approach.Therefore, engineering design should take into account projected climate change where appropriate and where the potential effects represent an important component of the geothermal design.
The sensitivity of permafrost soil strength to projected climate change can be mapped using a simple strength sensitivity index, such as the one proposed in this section. A risk-based procedure for analyzing structures based on their sensitivity to the potential consequences of climate change is a reasonable approach to incorporating climate change concerns into the design process (section 16.4.1). The project-screening tool developed and currently in use in Canada is a very good guideline for such an approach[54].
Chapter 16: Infrastructure: Buildings, Support Systems, and Industrial Facilities
16.1 Introduction (Permafrost and infrastructure in the Arctic)
16.2. Physical environment and processes related to infrastructure
16.2.1. Observed changes in air temperature
16.2.2. Permafrost
16.2.3. Natural hazards
16.2.4. Coastal environment
16.2.5. Arctic Ocean (Arctic ocean, climate and infrastructure)
16.3. Infrastructure in the Arctic
16.4. Engineering design for a changing climate
16.5. Gaps in knowledge and research needs (Gaps in knowledge and research needs for infrastructure in the Arctic)
References
Citation
Committee, I. (2012). Permafrost and infrastructure in the Arctic. Retrieved from http://editors.eol.org/eoearth/wiki/Permafrost_and_infrastructure_in_the_Arctic- ↑ Brown, J., O.J. Ferrians, J.A. Heginbottom and E.S. Melnikov, 1997. International Permafrost Association Circum-Arctic Map of Permafrost and Ground Ice Conditions. Circum-Pacific map series, CP-45. U.S. Geological Survey.
- ↑ Andersland, O.B. and B. Ladanyi, 1994. An Introduction to Frozen Ground Engineering. Chapman & Hall, 352pp.
- ↑ Linell, K.A, 1973. Long-term effects of vegetative cover on permafrost stability in an area of discontinuous permafrost. In: North American contribution, Second International Conference on Permafrost, Yakutsk, USSR, pp. 688–693. National Academy of Sciences.
- ↑ Pavlov, A.V., 1997. Cryological and climatic monitoring of Russia: methodology, observation results, and prediction. Kriosphera Zemli, 1(1):47–58.
- ↑ Pavlov, 1997, Op. cit.
- ↑ Osterkamp,T.E. and V.E. Romanovsky, 1999. Evidence of warming and thawing of discontinuous permafrost in Alaska. Permafrost and Periglacial Processes, 10:17–37.
- ↑ Burgess, M.M., S.L. Smith, J. Brown,V. Romanovsky and K. Hinkel, 2000b. Global terrestrial network for permafrost (GTNet-P): Permafrost monitoring contributing to global climate observations. Geological Survey of Canada, Current Research 2000-E14, 8pp.
- ↑ Brown, J., K.M. Hinkel and F.E. Nelson, 2000.The circumpolar active layer (CALM) program: research designs and initial results. Polar Geography, 24:163–258
- ↑ see also IPCC, 2001. Climate Change 2001:The Scientific Basis. Contribution of Working Group I to the Third Assessment Report of the Intergovernmental Panel on Climate Change. J.T. Houghton,Y. Ding, D.J. Griggs, M. Noguer, P.J. van der Linden, X. Dai, K. Maskell and C.A. Johnson (eds.). Cambridge University Press, 881pp
- ↑ Pavlov, 1997, Op. cit.
- ↑ Instanes and Mjureke, 2002a, Op. cit.
- ↑ Instanes, A. and D. Mjureke, 2002a. Design criteria for infrastructure on permafrost. SV4242-1. Instanes Svalbard AS (Report submitted to the Norwegian ACIA Secretariat, Norwegian Polar Institute, Tromsø).
- ↑ Andersland and Ladanyi, 1994, Op. cit
- ↑ Instanes and Mjureke, 2002a, Op. cit.
- ↑ Anisimov, O.A., State Hydrological Institute, St. Petersburg, Russia, 2001
- ↑ Instanes and Mjureke, 2002a, Op. cit.
- ↑ Instanes, A. and D. Mjureke, 2002a. Design criteria for infrastructure on permafrost. SV4242-1. Instanes Svalbard AS (Report submitted to the Norwegian ACIA Secretariat, Norwegian Polar Institute, Tromsø).
- ↑ e.g., AMAP, 1997. Arctic Pollution Issues: A State of the Arctic Environment. Arctic Monitoring and Assessment Programme, Oslo, 188pp.
- ↑ Riseborough, D.W., 1990. Soil latent heat as a filter of the climate signal in permafrost. Collection Nordicana No. 54, Laval University, Québec, Proceedings of the Fifth Canadian Permafrost Conference, pp. 199–205.
- ↑ Burgess, M.M., D.T. Desrochers and R. Saunders, 2000a. Potential changes in thaw depth and thaw settlement for three locations in the Mackenzie Valley. In: L.D. Dyke and G.R. Brooks (eds.).The Physical Environment of the Mackenzie Valley, Northwest Territories: a Baseline for the Assessment of Environmental Change. Geological Survey of Canada Bulletin, 547:187–195.;-- Esch, D.C. and T.E. Osterkamp, 1990. Cold regions engineering: Climate warming concerns for Alaska. Journal of Cold Regions Engineering, 4(1):6–14.;-- Osterkamp,T.E. and A.H. Lachenbruch, 1990.Thermal regime of permafrost in Alaska and predicted global warming. Journal of Cold Regions Engineering, 4(1):38–42.
- ↑ Harris, S.A., 1986. Permafrost distribution, zonation and stability along the eastern ranges of the Cordillera of North America. Arctic, 39:29–38.
- ↑ Burgess et al., 2000a. Op. cit;-- Esch and Osterkamp, 1990, Op. cit.;-- Harris, 1986, Op. cit.;-- Osterkamp and Lachenbruch, 1990, Op. cit.
- ↑ Instanes, A. and D. Mjureke, 2002b. Design criteria for infrastructure on permafrost based on future climate scenarios. SV4242-2. Instanes Svalbard AS (Report submitted to the Norwegian ACIA Secretariat, Norwegian Polar Institute,Tromsø).
- ↑ Ibid; strength loss calculated after:-- Ladanyi, B., 1996. A strength sensitivity index for assessing climate warming effects on permafrost. In: Proceedings of the Eighth International Conference on Cold Regions Engineering, Fairbanks, Alaska, 12–16 August 1996, pp. 35–45.
- ↑ Anisimov, O.A., N.I. Shiklomanov and F.E. Nelson, 1997. Effects of global warming on permafrost and active-layer thickness: results from transient general circulation models. Global and Planetary Change, 61:61–77.
- ↑ Instanes and Mjureke, 2002b, Op. cit.
- ↑ Riseborough, 1990, Op. cit.;-- Smith, M.W. and D.W. Riseborough, 1983. Permafrost sensitivity to climate change. In: Proceedings of the Fourth International Conference on Permafrost, Fairbanks, Alaska, pp. 1178–1183. National Academy Press.-- Smith, M.W. and D.W. Riseborough, 1985.The sensitivity of thermal predictions to assumptions in soil properties. Proceedings of the Fourth International Conference on Ground Freezing, Sapporo, Japan,Vol. I, pp. 17–23. Balkema.
- ↑ Instanes and Mjureke, 2002b, Op. cit.
- ↑ Parmuzin, S.Yu. and M.B. Chepurnov, 2001. Prediction of permafrost dynamics in the European North of Russia and Western Siberia in the 21st century. Moscow University Geology Bulletin, no. 4. (In Russian)
- ↑ Instanes A. and Mjureke, 2002b, Op. cit.
- ↑ Ibid.
- ↑ Hanssen-Bauer, I. and E.J. Forland, 1998. Long term trends in precipitation and temperature in the Norwegian Arctic: can they be explained by changes in atmospheric circulation patterns? Climate Research, 102:1–14.
- ↑ Instanes and Mjureke, 2002b, Op. cit.
- ↑ Esch and Osterkamp, 1990, Op. cit.
- ↑ Woo, M.K.,W.R. Rouse, A.G. Lewkowicz and K.L.Young, 1992. Adaptation of permafrost in the Canadian North: Present and future. Report No. 93-3. Canadian Climate Center, Environment Canada, Downsview, Ontario.
- ↑ Kane, D.L., L.D. Hinzman and J.P. Zarling, 1991.Thermal response of the active layer to climate warming in permafrost environment. Cold Regions Science and Technology, 19:111–122.
- ↑ Nakayama,T.,T. Sone and M. Fukuda, 1993. Effects of climate warming on the active layer. In: Proceedings of the Sixth International Conference on Permafrost, Beijing, pp. 488–493.
- ↑ Burgess et al., 2000a. Op. cit;
- ↑ Andersland and Ladanyi, 1994, Op. cit
- ↑ Haas,W.M. and A.E. Barker, 1989. Frozen gravel: A study of compaction and thaw settlement behaviour. Cold Regions Engineering. Fifth International Conference, St. Paul, Minnesota, 6–8 February, 1989;-- Johnson,T.C., E. McRoberts and J.F. Nixon, 1984. Design implications of subsoil thawing. In: R.L. Berg and E.A.Wright (eds.). Frost Action and its Control, pp. 45–103. American Society of Civil Engineers.;-- Johnston, G.H. (ed.), 1981. Permafrost, Engineering Design and Construction. J.Wiley & Sons, 352pp.;-- Ladanyi, B., 1994. La conception et la réhabilation des infrastructures de transport en régions nordiques. RTQ-94-07. Ministère destransport du Québec.;-- McRoberts, E.C.,T.C. Law and E. Moniz, 1978.Thaw settlement studies in the discontinuous permafrost zone. Proceedings of the Third International Conference on Permafrost, Edmonton, Alberta, pp. 700–706.;-- Nixon, J.F., 1990a. Effect of climate warming on pile creep in permafrost. Journal of Cold Regions Engineering, ASCE, 4(1):67–73.;-- Speer,T.L., G.H.Watson and R.K. Rowley, 1973. Effects of ground ice variability and resulting thaw settlements on buried warm oil pipelines. In: Proceedings of the Second International Conference on Permafrost,Yakutsk, Russia, pp. 746–752.
- ↑ First published by Speer et al., 1973, Op. cit; and completed by Johnston, G.H. (ed.), 1981. Permafrost, Engineering Design andConstruction. J.Wiley & Sons, 352pp.
- ↑ Haas and Barker, 1989, Op. cit.;-- Leroueil, S., G. Dionne and M. Allard, 1990.Tassement et consolidation au dégel d’un silt argileux à Kangiqsualujjuak. Fifth Canadian Permafrost Conference, Collection Nordicana No. 54, pp. 309–316. Laval University, Quebec.;-- Nelson, R.A., U. Luscher, R.W. Rooney and A.A. Stramler, 1983. Thaw strain data and thaw settlement predictions for Alaskan silts. In: Proceedings of the Fourth International Conference on Permafrost, Fairbanks, Alaska, pp. 912–917. National Academy Press.
- ↑ Smith, S.L., M.M. Burgess and J.A. Heginbottom, 2001. Permafrost in Canada, a challenge to northern development. In: G.R. Brooks (ed.). A Synthesis of Geological Hazards in Canada. Geological Survey of Canada Bulletin 548, pp. 241–264.
- ↑ Smith, S.L. and M.M Burgess, 1998. Mapping the response of permafrost in Canada to climate warming. Current Research 1998-E, Geological Survey of Canada, pp. 163–171.-- Smith, S.L. and M.M. Burgess, 1999.Mapping the sensitivity of Canadian permafrost to climate warming. In: M.Tranter, R. Armstrong, E. Brun, G. Jones, M. Sharp and M.Williams (eds.). Interactions between the Cryosphere, Climate and Greenhouse Gases, pp. 71–80. IAHS Publication No. 256.-- Smith, S.L. and M.M. Burgess, 2004. Sensitivity of Permafrost to Climate Warming in Canada. Geological Survey of Canada Bulletin 579, 24 pp.
- ↑ Nelson, F.E., O.A. Anisimov and N.I. Shiklomanov, 2002. Climate change and hazard zonation in the circum-Arctic permafrost regions. Natural Hazards, 26(3):203–225.
- ↑ Ladanyi, 1996, Op. cit.
- ↑ Ladanyi, B., 1995. Civil engineering concerns of climate warming in the Arctic.Transactions of the Royal Society of Canada, 6:7–20.-- Ladanyi, 1996, Op. cit.-- Ladanyi, B., 1998. Geotechnical microzonation in the Arctic related to climate warming. In: Proceedings of the Eleventh European Conference on Soil Mechanics and Geotechnical Engineering, Porec, Croatia, 25–29 May 1998, pp. 215–221. Balkema Publishers.
- ↑ Parmuzin and Chepurnov, 2001, Op. cit.
- ↑ Vyalov, S.S., A.S. Gerasimov, A.J. Zolotar and S.M. Fotiev, 1988. Ensuring structural stability and durability in permafrost ground areas at global warming of the Earth’s climate. In: Proceedings of the Sixth International Conference on Permafrost, Beijing, pp. 955–960.
- ↑ Nixon, J.F., 1990a. Effect of climate warming on pile creep in permafrost. Journal of Cold Regions Engineering, ASCE, 4(1):67–73.-- Nixon, J.F., 1990b. Seasonal and climate warming effects on pile creep in permafrost. In: Proceedings of the Fifth Canadian Permafrost Conference, Québec, July, 1990, pp. 335–340.-- Nixon, J.F., 1994. Climate Change as an Engineering Design Consideration. Report prepared by Nixon Geotech Ltd. for the Canadian Climate Centre, Environment Canada, Downsview, Ontario, 11 pp.
- ↑ Parmuzin, S.Yu. and M.B. Chepurnov, 2001. Prediction of permafrost dynamics in the European North of Russia and Western Siberia in the 21st century. Moscow University Geology Bulletin, no. 4. (In Russian)
- ↑ Aylsworth, J.M, M.M. Burgess, D.T. Desrochers, A. Duk-Rodkin, T. Robertson and J.A.Traynor, 2000. Surficial geology, subsurface materials, and thaw sensitivity of sediments. In: L.D. Dyke and G.R. Brooks (eds.). The Physical Environment of the Mackenzie Valley, Northwest Territories: a Baseline for the Assessment of Environmental Change. Geological Survey of Canada Bulletin, 547:41–47.;-- Burgess et al., 2000a. Op. cit; ;-- Burgess, M.M. and S.L. Smith, 2003. 17 years of thaw penetration and surface settlement observations in permafrost terrain along the Norman Wells pipeline, Northwest Territories, Canada. In: M. Phillips, S.M. Springman and L.U. Arenson (eds.). Permafrost: Proceedings of the Eighth International Conference on Permafrost, pp. 1073–1078. A.A. Balkema.
- ↑ Andersland and Ladanyi, 1994, Op. cit
- ↑ Bush, E., D.A. Etkin, D. Hayley, E. Hivon, B. Ladanyi, B. Lavender, G. Paoli, D. Riseborough, J. Smith, and M. Smith, 1998. Climate Change Impacts on Permafrost Engineering Design. Environment Canada, Environmental Adaptation Research Group, Downsview, Ontario.