Value of carbon: five definitions
Contents
- 1 Abstract
- 2 Introduction What carbon (Value of carbon: five definitions) value should rightly be adopted? It should be high enough to guide policy decisions, but it should also be ‘reasonable’, i.e. not too high because any Euro spent on protecting the climate will not be spent on something else. This brief article will not provide an answer to the question, but we would point out that the Intergovernmental Panel on Climate Change (IPCC) (Barker, Bashmakov et al., 2007) provides a fairly broad definition: An effective carbon-price signal could realise significant mitigation potential in all sectors. Modelling studies show that global carbon prices rising to US$20-80/tCO2-eq by 2030 are consistent with stabilisation at around 550ppm CO2-eq by 2100. For the same stabilisation level, studies since the TAR that take into account induced technological change may lower these price ranges to US$5-65/tCO2-eq in 2030.24 {WGIII 3.3, 11.4, 11.5, SPM}
- 3 Marginal damage of climate change
- 4 The cost of reducing emissions
- 5 The social value of carbon: SVC
- 6 Politically negotiated value: the “shadow price”
- 7 CO2 market prices
- 8 Conclusion
- 9 References
Abstract
What is the value of a tonne of carbon dioxide (CO2) that has not been emitted into the atmosphere? It all depends on what you mean by value. The purpose of this article is to elucidate and illustrate five frequently used definitions: 1) The expected mitigation of climate change damage, 2) The cost of reducing CO2 emissions, 3) The optimal social value, 4) The politically negotiated value, and 5) The market value.
Introduction What carbon (Value of carbon: five definitions) value should rightly be adopted? It should be high enough to guide policy decisions, but it should also be ‘reasonable’, i.e. not too high because any Euro spent on protecting the climate will not be spent on something else. This brief article will not provide an answer to the question, but we would point out that the Intergovernmental Panel on Climate Change (IPCC) (Barker, Bashmakov et al., 2007) provides a fairly broad definition: An effective carbon-price signal could realise significant mitigation potential in all sectors. Modelling studies show that global carbon prices rising to US$20-80/tCO2-eq by 2030 are consistent with stabilisation at around 550ppm CO2-eq by 2100. For the same stabilisation level, studies since the TAR that take into account induced technological change may lower these price ranges to US$5-65/tCO2-eq in 2030.24 {WGIII 3.3, 11.4, 11.5, SPM}
The scope of this range—from 5 to 80—gives reasonable cause for skepticism, or even a touch of sarcasm regarding the claims of models that they can provide insight into a future fraught with controversy. In fact, since information in this domain is in a state of considerable confusion, we feel that it would be more informative to clarify what is meant exactly by cost, price or value of carbon. Five interpretations can be given: 1. The expected mitigation of climate change damage, 2. The cost of reducing CO2 emissions, 3. The optimal social value, 4. The politically negotiated value and 5. The market value.
Marginal damage of climate change
The reason why the question of carbon value is of concern is that CO2 is the main greenhouse gas whose accumulation in the atmosphere is changing the earth’s climate.
Each tonne of CO2 which is not released into the atmosphere means a small gain, that is a little less climate change.
The present level of pollution is worrying as it is. The foreseeable and inevitable consequences of climate change include: massive extinction of species, accelerated displacement of ecosystems, an increase in heat waves, a rise in sea-levels, ocean acidification, etc. But an evaluation in monetary terms of the effects of climate change and even more so, of potential impacts that are avoided, are problems that remain to be solved.
This raises the question of the valuation of ecosystems—how much is the Great Barrier Reef worth? And what of human life—what is the price of 15,000 premature deaths avoided? And what if the people who die are old? Such an analysis also raises problems of equity within and between countries and even between generations. How do you include the very long term in the equation: the thawing of Greenland’s ice will probably raise sea levels by several meters, but we are unlikely to be still around in person to suffer the consequences. Finally, we should mention that economists do not always agree on a formal definition of the precautionary principle, which is a problem in this context since, in the present state of scientific and technical knowledge, we are far from being able to calculate the dynamics of the Earth system.
For this reason, attempts to allocate an economic value to avoided impacts, even the soundest and best informed of them, such as those in the Stern Report (2007) are open to criticism. Fundamentally, they are prone to insoluble controversy since they would need to use parameters beyond the economic sphere (Halsnæs, Shukla et al. 2007).
As anyone does, we have our own opinions as to what collective preferences should be, but to present and defend them would entail entering into a fascinating quasi philosophical discussion far beyond the scope of this document. For these reasons, while each tonne of CO2 which is not emitted into the atmosphere does help to avoid an exacerbation of climate change, we will not be attempting here to allocate a monetary value to this contribution.
The cost of reducing emissions
An essential part of the work of economists is to line up the costs and benefits of everything they study. Since, as we have seen, quantifying the benefits of reducing CO2 emissions is no easy task, most of our ideas on the value of carbon are arrived at through an analysis of the cost of these reductions, called abatement costs.
Studies of abatement costs naturally vary depending on the scope of investigation, in particular on the following dimensions:
- Scale: facilities, establishment, firm, sector, country, group of countries, world
- The extent of costs and potentials included in the study: purely technical, economic (taking into account financial aspects), macroeconomic (taking into account economic cascade effects, in particular on employment), or even social (taking into account joint benefits such as the effect on local pollution, or even international security, etc.). In this respect, are to be noted in particular bottom:up models, based on an explicit representation of technologies and the top-down models, based on more general economic relations.
- Are we only concerned with CO2 reductions or with the reduction of all [[greenhouse gas]es]? In the latter case, we are dealing with reductions in tonnes of CO2-equivalent and other gases, such as methane or HFC-23, weighted according to their warming effect as compared to CO2.
- Are we observing the past or using modeling results to predict the future? In the latter case, the reference scenario and assumptions regarding the economic situation become critical. They concern, for example, the degree of market efficiency, the impact of Government action and the advancement of technical progress.
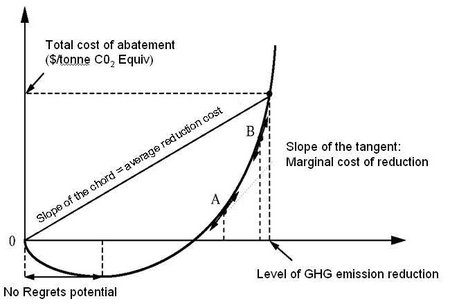
Once all these parameters are in place and the question of costs is approached, three concepts must be clearly differentiated: average cost, total cost and marginal cost. If an entity (a factory or a country, etc.) has spent D Euros to reduce its emission by T CO2 tonnes, the total abatement cost is D Euros and its average cost is D/T Euros per tonne. The marginal cost is what would need to be spent to reduce its emission by one extra tonne. Figure 1 illustrates these theoretical cost notions and shows a typical abatement cost curve. It shows that not only are there three theoretical cost concepts, but also that these costs vary according to the achieved or planned level of reduction.
Most studies show that, beyond a certain amount of greenhouse gas emissions reduction, marginal abatement costs increase very steeply, as is illustrated by the section from point A to point B on this diagram. However, in point of fact, the object is not to reduce emissions by 30-40% instantaneously, but to achieve this by a gradual effort over time. Moving the cost curve over time thanks to technical progress is a crucial issue on which studies are less convergent.
The other interesting characteristic of this curve is the range of negative initial costs. From a technical point of view, this means that there is a potential of “no regrets” energy savings which would be beneficial to undertake even without any CO2 constraint. From a macro-economic point of view, such negative costs could be described as having a “double dividend” effect.
A typical example of results obtained through a technical approach is a study by DG XII, the European Commission’s General Directorate for Research, arrived at in the late nineties, using the Primes model. The average abatement cost given in this model, an item of information which was frequently referred to at the time, varies between 12 and 48/€ tC from one scenario to another, with a marginal cost of around €297/tC. From the point of view of economics, the marginal and total costs of policies are more important parameters than the average cost. It is the marginal cost which dictates the effective taxation level or the level of emission permit prices and therefore the radical changes in relative price structures. Remembering that 1 g C = 3.664 g CO2, these values must be divided by 3.66 to obtain costs per tonne of CO2. The order of magnitude of $275/tC therefore corresponds to a marginal cost of $75/tCO2 for a reduction approximating 20%.
Results obtained by other approaches taking into consideration the macro-economic feedback effects also show a high degree of disparity in abatement costs. Barker, Basshmakov et al. (2007, Figure 11.8) for example compare model results in terms of the marginal cost of CO2 reduction for a CO2 emission path compatible with a stabilization scenario at 550 ppm of CO2 in the atmosphere. Results for 2050 range from approximately $25/tCO2 to approximately $90/tCO2 depending on the model used.
One specific difficulty in comparing abatement costs is due to currency parity variations, since for example the EUR/USD exchange rate was at its lowest point in 2000 at 1€ to $0,8252 and peaked at $1.5973 in 2008. To sum up, abatement costs are the aspect of carbon value which have come under the greatest degree of scrutiny. Costs should only be compared for identical areas of investigation, over the same period and for the same level of reduction relative to the same baseline scenario.
The social value of carbon: SVC
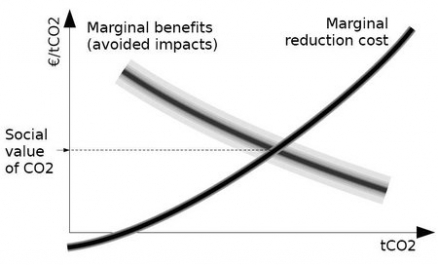
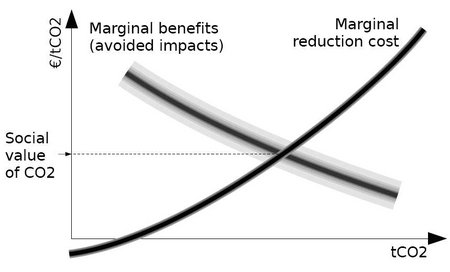
As we said above, an essential part of the work of economists is to line up the costs and benefits of everything they study. Figure 2 represents the intersection between the marginal abatement cost discussed in section 2 and a curve for marginal benefit discussed in section 1.
In theory, it is worth reducing CO2 emissions up to the point where the marginal benefits of reduction are equal to their marginal cost. This is a simple guide for investment decisions: make all the emission reductions which are less costly than the SVC, but go no further.
The two curves in Figure 2 are blurred because the theoretical SVC is difficult to define empirically. As we saw above, the determination of costs (cf. 2.), and even more so of benefits (cf. 1.) are subject to deep-seated scientific uncertainty (e.g.: abrupt [[climate change]s]), to controversy (e.g.: double dividends) and to value selection (e.g.: discounting, risk aversion, equity).
Even if it cannot be measured in the same way, as for instance, sea levels, stating that carbon does have a strictly positive social value is, in itself, an important step forward. It means that there is agreement on the fact that climate change is a real problem and that greenhouse gas emissions must be curbed. Stating that SVC exists also expresses a wish to see emissions reduction made efficient: it is clearly undesirable that one economic sector should implement measures at €120/tCO2 when elsewhere there is still an area of reductions at €20/tCO2.
The theory is not restricted to this static equilibrium. The value of carbon plays a major role as a signal to guide choices and technical progress in the long term. From this angle, it is not only its current value which matters, but also the expectations of investors regarding its future changes. Here again, predictions can only be made tentatively since we have only a few points of measurement regarding the impact of anticipations on the dynamics of innovation and technical progress in the long term.
Accepting that we know very little about the benefits curve, apart from the fact that it is positive, some approximation of the SVC can be made on the basis of the orders of magnitude of the following cost curve. Assuming 400 kg of CO2 per barrel of oil at $100, a tonne of CO2 would add up to $250. At the pump, 1 liter of petrol costs around €1.40 in Europe (taxes included) and produces some 2.3 kg of CO2, if it is pure octane. Emitting a tonne of CO2 therefore costs about €609.
Given such data, it becomes clear that below €1 per tonne of CO2, any visible effects in terms of energy savings are extremely unlikely: the incentive would be negligible in view of the price fluctuations of energy. Above €1,000 however, there would be an unprecedented and violent shock inflicted on the energy market. The €200/tCO2 threshold can be viewed as the limit to the unknown in terms of technology: beyond that value, the range of potentially profitable technologies is so vast that no prediction regarding the state of the market can reasonably be formulated.
To sum up, in our view, the social value of carbon today is within a bracket of €1-1,000 per tonne of CO2 and more likely somewhere between 5-200 €/tCO2. Scientists cannot be more specific.
Politically negotiated value: the “shadow price”
In view of scientific and technological uncertainties and social value issues beyond market economy issues, the determination of a value for avoided CO2 necessarily becomes a political decision. Negotiations on this subject are ongoing at several levels: in the United Nations and the European Commission as well as in Paris.
So far negotiations on climate change in the United Nations were mainly concerned with determining CO2 emission quotas rather than with settling on a harmonized taxation system for carbon with an agreed international CO2 value. But the national quota approach has its limitations and the Kyoto Protocol will not be complied with. It cannot be ruled out that, after 2012, the wind will blow in a different direction and price-related instruments will be a top item for negotiation. There is nothing to prevent negotiators from changing their minds.
The opposition between quotas and taxes stems from a distinction well-known to environmental economists: the distinction between quantitative and price-related instruments to limit the emission of pollutants. If the starting point is “quantity”, a maximum amount is set beyond which there is a fine to be paid. With the “price” option, emissions of the harmful substances give rise to taxation and as people like to reduce their tax burden, they end up reducing their pollution levels.
In practice, the contradiction is less radical than it might seem at first sight. With regulation by quantity and a tradable quota system, prices can be regulated. For example, regulators are free to reduce the number of quotas allocated if prices seem too low, or vice-versa, like a central bank.
It has been suggested for instance, that a ceiling could be set for the market price of CO2 emission entitlements by stating that the government will make available an unlimited quantity of permits at a set (high) price. Alternatively, if regulators set a proportional fine for exceeding quotas, the amount of the fine is also an upper limit for the market price. There is no such “safety valve” embedded in the European CO2 emission permit system: the fine (€40 per tonne initially, and €100 per tonne after 2008) does not grant exemption from the mandatory purchase of emission permits.
Taxation on the carbon content of products and services is a thorny economic policy option. There are ongoing discussions in several countries and the practicalities (tax base, rate, etc.) of such taxation projects take into consideration a set of political determinants which go beyond the purely economic considerations outlined above. It may seem surprising for example that in many roll-out scenarios, the most carbon intensive industrial sectors are precisely those which are least concerned by such regulation. But in political terms, it could be good strategy to initiate change where it is going to hurt least…
In France, for instance, the Conseil d’Analyse Stratégique proposes a mechanism for including CO2 externalities into public economic computations. To compare, for example, public investments in rail or road transport, in 2001, the Commissariat Général du Plan recommended a figure of €27 for one tonne of CO2 with a 3% increase per year from 2005 onwards. This value was updated in 2008 at €32/tCO2, reaching €100 in 2030 and increasing to €250/tCO2 in 2050 within a bracket ranging from €150 to €350/tCO2 (Centre d’Analyse Stratégique, 2008).
CO2 market prices
There are three CO2 reduction markets: the European Trading Scheme – ETS, the Clean Development Mechanism / Joint Implementation, and the retail market.
In Europe, releasing CO2 into the atmosphere is regulated for large industrial emitters (thermal capacity > 20MW). An EUA (European Union Allowance), is a one-time authorization to emit one tonne of CO2 into the atmosphere. In 2005, Member States allocated a provision of EUAs to their industrial concerns, covering approximately three years of activity. Companies who emitted more CO2 than their allowance had to buy extra EUAs from companies who had kept their emissions below their allotted level.
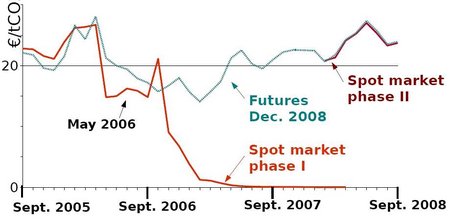
Figure 3 shows that the price of EUAs on the European spot market fluctuated from €15 to €30 in the 2005-2007 time period, which was the system’s pilot phase. The price of permits granted in 2005 is nearing zero in 2008 since these permits are no longer valid for emissions after 2007. A second allocation of emission permits took place in 2008. The forecasted price on the futures market for December 2008 has remained at the level of about €20 per tonne of CO2. The market price peaked at just under €30/t at the end of June 2008, then dropped and rose again to €22/t in August.
Prices in the US tend to be lower. For example, ten north-eastern states set up a system for regulating emissions from electrical power stations with a capacity of 25MW or more (RGGI - The Regional Greenhouse Gas Initiative). Emission permits were auctioned. The closing price at the first auction in September 2008 was $3.07 per tonne of CO2.
The Clean Development Mechanism provides another source of CO2 pricing. It is based on emission reduction projects in a developing country. For example, Scottish and Southern Energy PLC purchased two million Emission Reduction Certificates, over a period of five years beginning in 2008, from the China Guodian Corporation in exchange for which the Chinese company contracted to build four new wind farms, each with a capacity of 50MW. In this way, the electricity they produce need not be obtained from coal-fired power stations. The mechanism has also been used to reduce emissions of another potent greenhouse gas, HFC-23.
Such emission reductions (called CERs for Certified Emission Reduction of Carbon) are assessed by mutual agreement and case by case. There are hundreds of projects. Generally speaking, CERs tend to be valuated with a 30 to 50% discount compared to the price of EUAs, depending on the quality of the project.
On the retail market, numerous websites for the sale of CO2 offsets appeared on line in 2007. In the spring of 2008, private concerns were paying around €15 per tonne of CO2 to reliable sellers and the airlines began to integrate the option into their submissions. Prices vary considerably from one operator to the next and are based on CERs which are not identical in quality.
Conclusion
In conclusion, the concept of the value of carbon can be defined in five different ways and the amount varies considerably with the area of investigation of the system under study. Table 1 recapitulates the five different definitions of the value of carbon discussed above. It is worth noting that while the orders of magnitude are similar, the figures differ in kind and the uncertainties connected to them are also at variance.
In some cases, the costs are negative: energy savings can be profitable. The marginal cost rises with the level of abatement. For a 20% emission reduction, many models arrive at costs of less than €100/tCO2 in Europe. The IPCC reports that a value of $5 to €80/tCO2 eq in 2030 would make it possible to arrive at an atmospheric CO2 concentration of around 550ppmv. But this ceiling may seem risky for the climate and the shadow value in France, i.e. €100/tCO2 in 2030, is above that bracket.
|
Table 1: Carbon values | |
|
Definition |
Value of one tonne of CO2. |
|
Avoided climate damage |
Fuzzy and uncertain value. Measuring it raises unsolved philosophical economic issues. |
|
Cost of reduction |
Values depend on the area of investigation under study. In some cases, costs are negative: energy savings can be profitable. The marginal cost increases in line with the level of abatement. For a 20% emissions reduction, many models arrive at costs of less than €100/tCO2 in Europe. IPCC reports that a global value of $20 to €50/tCO2 -eq in 2020-2030 would make it possible to arrive at around 550ppmv. |
|
Social value of CO2 |
A theoretical notion. Can be calculated with models integrating, at best, deep-seated uncertainties. Between €1 and €1,000. More probably between €5 and €200. |
|
Shadow value |
In France, €32/tCO2 in 2008, increasing to €100/tCO2 in 2030. |
|
Market price |
Between €20-€30 for EUAs (European Union Allowances). Substantial discounts of 30 to 50% less than that range for CERs (Certified Emission Reduction of carbon) in third countries. Significantly lower prices in the U.S. |
References
- Barker, T., I. Bashmakov et al., 2007. Chapter 11: Mitigation from a cross-sectoral perspective. in Metz et al. Climate Change 2007: Mitigation. Contribution of Working Group III to the Fourth Assessment Report of the Intergovernmental Panel on Climate Change Cambridge University Press.
- Centre d'Analyse Stratégique, La valeur tutélaire du carbone, Note de veille n° 101, juin 2008.
- Halsnæs, K., P. Shukla, et al., 2007. Chapter 2: Framing issues. in Metz et al. Climate Change 2007: Mitigation. Contribution of Working Group III to the Fourth Assessment Report of the Intergovernmental Panel on Climate Change Cambridge University Press.
- Metz, B., O. R. Davidson, P. R. Bosch, R. Dave, L. A. Meyer (eds), 2007. Climate Change 2007: Mitigation. Contribution of Working Group III to the Fourth Assessment Report of the Intergovernmental Panel on Climate Change Cambridge University Press.
- Stern, Nicholas, 2007. The Economics of Climate Change: The Stern Review. Cambridge University Press. ISBN: 0521700809


