Global surface temperature distribution
| Topics: |

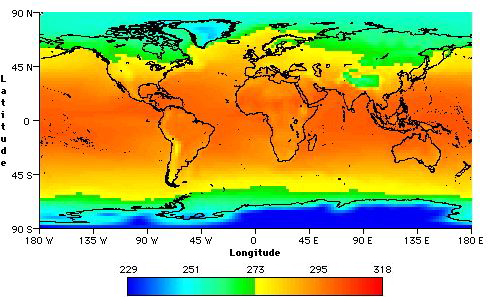
Average annual temperatures for the Earth's surface (1982-94). (Image generated by WorldWatcher software).
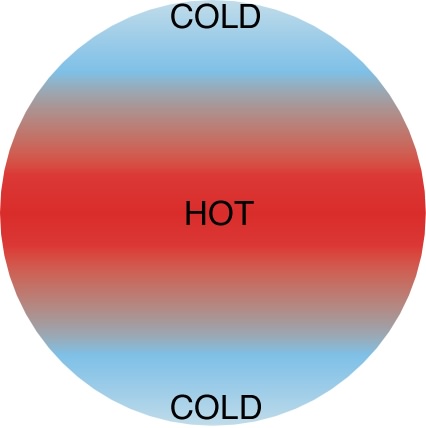 Figure 1: Simple latitudinal zonation of temperature. Source: PhysicalGeography.net If the Earth was a homogeneous body without the present land/ocean distribution, its temperature distribution would be strictly latitudinal (Figure 1). However, the Earth is more complex than this, being composed of a mosaic of land and water. This mosaic causes latitudinal zonation of temperature to be disrupted spatially.
The following two factors are important in influencing the distribution of temperature on the Earth's surface:
- The latitude of the location determines how much solar radiation is received. Latitude influences the angle of incidence and duration of daylength.
- Surface properties - surfaces with high albedo absorb less incident radiation. In general, land absorbs less insolation that water because of its lighter color. Also, even if two surfaces have the same albedo, a surface's specific heat determines the amount of heat energy required for a specific rise in temperature per unit mass. The specific heat of water is some five times greater than that of rock and the land surface (see Table 1). As a result, water requires the input of large amounts of energy to cause a rise in its temperature.
Mainly because of specific heat, land surfaces behave quite differently from water surfaces. In general, the surface of any extensive deep body of water heats more slowly and cools more slowly than the surface of a large land body. Other factors influencing the way land and water surfaces heat and cool include:
- Solar radiation warms an extensive layer in water, on land just the immediate surface is heated.
- Water is easily mixed by the process of convection.
- Evaporation of water removes energy from water's surface.
| Table 1: Specific Heat of Various Substances. | |
|
Substance |
Specific Heat |
|
Water |
1.00 |
|
Air |
0.24 |
|
Granite |
0.19 |
|
Sand |
0.19 |
|
Iron |
0.11 |
Figures 2 and 3 illustrate the Earth's temperature distribution patterns for an average January and July based on 39 years of data. Note that the spatial variations of temperature on these figures is mostly latitudinal. However, the horizontal banding of isotherms is somewhat upset by the fact that water heats up more slowly in the summer and cools down more slowly in the winter when compared to land surfaces. During January, much of the terrestrial areas of the Northern Hemisphere are below freezing (Figure 2). Some notable Northern Hemisphere cold-spots include the area around Baffin Island Canada, Greenland, Siberia, and the Plateau of Tibet. Temperatures over oceans tend to be hotter because of the water's ability to hold heat energy.
In the Southern Hemisphere, [[temperature]s] over the major landmasses are generally greater than 20° Celsius with localized hot-spots in west-central Australia, the Kalahari Desert in Africa, and the plains of Bolivia, Paraguay, and Argentina (Figure 2). Subtropical oceans are often warmer than landmass areas near the equator. At this latitude, land areas receive less incoming solar radiation because of the daily convective development of cumulus and cumulonimbus clouds. In the mid-latitudes, oceans are often cooler than landmass areas at similar latitudes. Terrestrial areas are warmer because of the rapid heating of land surfaces under frequently clear skies. Antarctica remains cold and below zero degrees Celsius due to the presence of permanent glacial ice which reflects much of the received solar radiation back to space.
 Figure 2: Mean January air temperature for the Earth's surface, 1959-1997. (Source of Original Modified Image: Climate Lab Section of the Environmental Change Research Group, Department of Geography, University of Oregon - Global Climate Animations). <
In July, the Northern Hemisphere is experiencing its summer season because the North Pole is now tilted towards the sun (Figure 3). Some conspicuous hot-spots include the south-central United States, Arizona and northwest Mexico, northern Africa, the Middle East, India, Pakistan, and Afghanistan. Temperatures over oceans tend to be relatively cooler because of the land's ability to heat quickly. Two terrestrial areas of cooler temperatures include Greenland and the Plateau of Tibet. In these regions, most of the incoming solar radiation is sent back to space because of the presence of reflective ice and snow.
In the Southern Hemisphere, [[temperature]s] over the major landmasses are generally cooler than ocean surfaces at the same latitude (Figure 3). Antarctica is bitterly cold because it is experiencing total darkness. Note that Antarctica is much colder than the Arctic was during its winter season (Figures 2 and 3). The Arctic consists mainly of ocean. During the summer, this surface is able to absorb considerable quantities of sunlight which is then converted into heat energy. The heat stored in the ocean is carried over into the winter season. Antarctica has a surface composed primarily of snow and ice. This surface absorbs only a small amount of the solar radiation during the summer so it never really heats up. As a result, the amount of heat energy stored into the winter season is minimal.
 Figure 3: Mean July air temperature for the Earth's surface, 1959-1997. (Source of Original Modified Image: Climate Lab Section of the Environmental Change Research Group, Department of Geography, University of Oregon - Global Climate Animations).
Figure 4 describes average annual global temperature data for the Earth for the period 1982-1994. The patterns of temperature distribution on this figure are once again mostly latitudinal. However, the latitudinal banding is partially upset by the fact that water bodies are generally warmer than land surfaces. The image also shows the effect of altitude (e.g., Himalayas and Andes mountains) and albedo (e.g., Greenland and Antarctica) on surface air temperature.
 Mainly because of specific heat, land surfaces behave quite differently from water surfaces. In general, the surface of any extensive deep body of water heats more slowly and cools more slowly than the surface of a large land body. Other factors influencing the way land and water surfaces heat and cool include: Solar radiation warms an extensive layer in water, on land just the immediate surface is heated. Water is easily mixed by the process of convection. Evaporation of water removes energy from water's surface.
Sea surface temperatures have a large influence on climate and weather. For example, every 3 to 7 years a wide swath of the Pacific Ocean along the equator warms by 2 to 3 degrees Celsius. This warming is a hallmark of the climate pattern El Niño, which changes rainfall patterns around the globe, causing heavy rainfall in the southern United States and severe drought in Australia, Indonesia, and southern Asia. On a smaller scale, ocean temperatures influence the development of tropical cyclones (hurricanes and typhoons), which draw energy from warm ocean waters to form and intensify.
These sea surface temperature maps are based on observations by the Moderate Resolution Imaging Spectroradiometer (MODIS) on NASAs Aqua satellite. The satellite measures the temperature of the top millimeter of the ocean surface. In this map, the coolest waters appear in blue (approximately 2 degrees Celsius), and the warmest temperatures appear in pink-yellow (45 degrees Celsius). Landmasses and the large area of sea ice around Antarctica appear in shades of gray, indicating no data were collected.
The most obvious pattern shown in the time series is the year-round difference in sea surface temperatures between equatorial regions and the poles. Various warm and cool currents stand out even in monthly averages of sea surface temperature. A band of warm waters snakes up the East Coast of the United States and veers across the North Atlantic—the Gulf Stream.
Although short-lived weather events that influence ocean temperature are often washed out in monthly averages, a few events show up. For example, in December 2003, strong winds blew southwest from the Gulf of Mexico over Central America toward the Pacific Ocean, driving surface waters away from the coast, and allowing cold water from deeper in the ocean to well up to the surface. These winds are a recurring phenomenon in the area in the winter; they are known as Tehuano winds. Source: NASA