Tropical weather and hurricanes

| Topics: |
Contents
Tropical Weather
The tropics can be defined as the area of the Earth found between the Tropic of Cancer (23.5° N) and the Tropic Capricorn (23.5° S). In this region, the Sun will be directly overhead during some part of the year. The temperature of the tropics does not vary much from season to season because considerable solar insolation (Earth-Sun relationships and insolation) is received by locations regardless of the time of the year. Weather in the tropics is dominated by convective storms that develop mainly along the Intertropical Convergence Zone (ITCZ), the Subtropical High-pressure Zone, and oceanic disturbances in the trade winds that sometimes develop into hurricanes.
One of the most important weather features found in the tropics is the ITCZ. The ITCZ is distinguished by a wide band of cumulus and cumulonimbus clouds (Clouds) that are created by dynamic atmospheric lifting due to convergence and convection. In general, the ITCZ delineates the location where the noonday Sun is directly overhead on the globe. Because of the high Sun, the ITCZ receives the greatest quantity of daily solar insolation (Earth-Sun relationships and insolation) in the tropics. At the ITCZ, this energy is used to evaporate large amounts of water and is converted into sensible heat at the ground surface and within the atmosphere. Often, these processes lead to an almost daily development of convective thunderstorms by providing moisture and heat for the development of cumulonimbus clouds. The ITCZ also represents the location of convergence of the northeast and southeast trade winds. The convergence of these wind systems enhances the development of convective rain clouds at the tropics.
The ITCZ moves seasonally with the tilt of the Earth's axis. The convective rains that accompany the passage of the ITCZ are the primary source of precipitation for locations roughly 10 to 23.5° N and S latitude. Figure 1 describes the seasonal movement of the ITCZ and other systems associated with our planet’s global circulation.
The other important weather feature in the tropics is the Subtropical High-pressure Zone. Airflow in the Subtropical High-pressure Zone is primarily descending. This creates clear skies, low humidity, and hot daytime temperatures. Like the ITCZ, the Subtropical High-pressure Zone migrates seasonally (see Figure 1). It generally influences locations 10 to 23.5° N and S during some part of the year.
Easterly Waves
Weather disturbances in the trade winds, known as easterly waves, are another source of cloud development and precipitation in the tropics. Easterly waves develop first as a weak disturbance in the atmosphere usually because of the presence of localized warmer ocean temperatures. On a weather map these weather systems appear as a wave in the isobars (Figure 2). On the eastern side of this wave, convergence occurs forming numerous thunderstorms (divergence occurs on the western side). If the convergence is strong enough the storm system may intensify and organize into a hurricane. On average, about 10% of the weather disturbances associated with easterly waves develop into hurricanes.
Hurricanes
Hurricanes are intense cyclonic storms that develop over the warm oceans of the tropics (Figure 3). These tropical storms go by other names in the various parts of the world: India/Australia - cyclones; western North Pacific - typhoons; and the Philippines - baguio. By international agreement, the term tropical cyclone is used by most nations to describe hurricane-like storms that originated over tropical oceans. Surface atmospheric pressure in the center of a hurricane tends to be extreme low. The lowest pressure reading ever recorded for a hurricane (typhoon Tip, 1979) is 870 mb. However, most storms have an average pressure of 950 mb. To be classified as a hurricane, sustained wind speeds must be greater than 119 kph (74 mph) at the storm's center. Wind speed in a hurricane is directly related to the surface pressure of the storm. The following graph (Figure 4) shows the relationship between surface pressure and sustained wind speed for a number of tropical cyclone systems.
Hurricanes have no fronts associated with them like the mid-latitude cyclones of the polar front. They are also smaller than the mid-latitude cyclone, measuring on average 550 km (340 mi) in diameter. Mature hurricanes usually develop a cloud-free eye at their center (Figure 5). In the eye, air is descending creating clear skies. The eye of the hurricane may be 20 to 50 km (12 to 31 mi) in diameter. Surrounding the eye are bands of organized thunderstorm clouds formed as warm air moves in and up into the storm (Figure 6). The strongest winds and heaviest precipitation are found in the area next to the eye where a vertical wall of thunderstorm clouds develops from the Earth's surface to the top of the troposphere.
Hurricane Development, Movement, and Dissipation
Hurricanes are powered by the latent heat energy released from condensation. To form and develop they must be supplied with a constant supply of warm humid air for this process. Surface air with enough energy to generate a hurricane only exists over oceans with a temperature greater than 26.5° C (80° F). Further, this warm surface water must exist in a layer that is at least 200 m (600 ft) deep. Ocean temperatures this high only occurs in selected regions of our planet and during particular seasons. Hurricane development can also be prevented by the presence of a temperature inversion in the atmosphere. Inversions develop in the tropics when subtropical high-pressure systems produce sinking air.
Hurricanes go through a number of different stages of development. Initially, these powerful storms begin their lives as a group of unorganized thunderstorms that develop over the specific areas of the tropical oceans. However, not all of these types of tropical disturbances become hurricanes. To develop into a hurricane, significant cyclonic circulation must occur around the disturbances. This type of circulation enhances the development of the group of thunderstorms by providing additional moisture and latent heat energy. With more moisture and latent heat energy, the strength and number of the thunderstorms in the tropical disturbance increases causing the disturbance to intensify. The thunderstorms also begin to organize themselves into spiral bands that swirl cyclonically toward the center of the storm. If the sustained wind speed around the disturbance increases to between 37 and 63 kph (23 to 39 mph), the storm becomes classified as a tropical depression. Tropical depressions appear on the weather map as a cyclonic low with several closed isobars circling the storm's center. A tropical depression can continue to intensify and become a tropical storm, the next stage in hurricane development. Tropical storms have a lower central pressure, several more closed isobars on a weather map, and winds that are between 64 and 119 kph (40 to 74 mph). Finally, tropical storms officially become hurricanes when their sustained wind speed exceeds 119 kph (74 mph).
Figure 7 shows the tropical and subtropical ocean areas where hurricanes typically form on our planet. These areas generally extend poleward to a maximum latitude of about 25 to 30° North or South. The exclusion of hurricanes from around the equator is related to the fact that Coriolis force is almost negligible here. A specific threshold quantity of Coriolis force is required to initiate cyclonic flow. Note that hurricanes do not form over the Southeastern Pacific Ocean, South Atlantic Ocean, and off the coast of Northern Africa. In these regions, cool ocean temperatures or the presence of temperature inversions restrict formation.
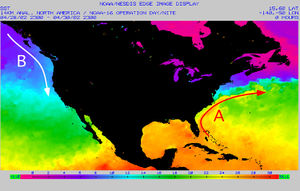
Hurricanes are seldom motionless after their initial formation. Typical directions of movement are displayed on Figure 8 for the various ocean basins that generate hurricanes. The patterns displayed in this map are highly generalized. On average, hurricanes that form in the North Atlantic and North Pacific move in a west or northwestward path. In reality, the track taken by any individual storm is often very chaotic. Hurricanes can suddenly change both their speed and direction of travel.
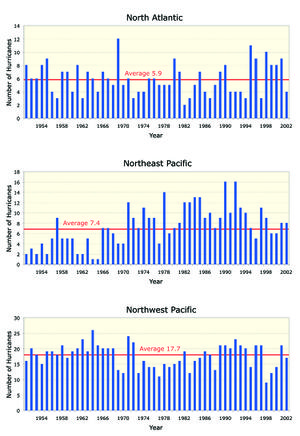
Figure 8.38 describes the annual number of hurricanes that developed in the North Atlantic, Northeast Pacific, and Northwest Pacific ocean basins from 1951 to 2002. Of these three regions, the Northwest Pacific ocean basin produced the most hurricanes for this period, an average of 17.7 storms per year (Figure 9). The mainland of North America is often influenced by storms that form in the North Atlantic and Northeast Pacific which produce a yearly average of 5.9 and 7.4 hurricanes, respectively. Most of the storms that form in the Northeast Pacific travel away from North America out to open ocean (see Figure 8).
Tropical storms and hurricanes also have very specific seasonal patterns. The peak season for these weather events in the Southern Hemisphere is January to March. In the Northern Hemisphere, most tropical storms and hurricanes develop in June to November. Figure 10 describes the month frequency of storm formation in the three ocean basins found in the Northern Hemisphere for the period 1951 to 2002. Each basin has slightly different patterns. Tropical storms and hurricanes rarely form during the months December to April in the North Atlantic and North Pacific basins. The Northwest Pacific basin has a significant number of storms forming in all months.

Hurricanes dissipate when the availability of latent heat energy is substantially reduced. This occurs either with landfall or storm movement into cooler seas. Most hurricanes live for about a week. If a hurricane can remain over warm water its life can be extended. In 1992, hurricane Tina was an active tropical storm for 24 days over the North Pacific.
Hurricane Classification
The most commonly used system to classify the strength of hurricanes is the Saffir-Simpson scale (Table 1). This classification scheme was developed so the public could quickly estimate the potential damage a hurricane’s winds and storm surge could have on a coastal area. The first two categories describe the two stages that occur before a storm becomes a hurricane: TD – tropical depression and TS – tropical storm. Hurricanes are categorized into 5 scales of intensity that ranges from 1 to 5. A major hurricane is considered to be categorized 3 and above.Figure 11 describes the number of category 1 to 5 hurricanes that developed in North Atlantic, Northeast Pacific, and Northwest Pacific ocean basins for the period 1951 to 2002. Note that the Northwest Pacific basin produces proportionally more major storms than the other two basins.

Hurricane Damage and Destruction
Cyclone frequencies have been examined from ancient Chinese records, and demonstrate that typhoon frequencies have declined over the last five centuries (Liu et al, 2001); thus typhoon frequencies are not linked to the Industrial Era, greenhouse gas increases or slight modern warming trend.
Tropical cyclones are the most deadly and destructive type of severe weather event on our planet. One of most destructive cyclones in the last 100 years was the Bhola cyclone (category 3) that made landfall on the Bangladesh coastline on November 12 of 1970. This storm had a minimal pressure reading of 966 millibars and maximum sustained winds of about 185 km/hr. Estimates suggest that over 300,000 people died from this storm. Most of these deaths were caused by flooding due to the storm surge and heavy rains. The high death toll caused by this hurricane was due to lack of preparedness. It is believed that less than 1% of the population took shelter in fortified buildings. One of the deadliest Atlantic storms is hurricane Mitch (category 5). Hurricane Mitch encountered populated areas of Central America twice: in late October and early November 1998. Estimates suggest that over 11,000 people died from this storm. Most of these deaths were caused by flooding and mudslides due to heavy rains.The damage that hurricanes inflict is caused by high wind speeds, heavy rainfall, storm surge, and tornadoes. Storm surge is an increase in the height of the ocean's surface in the region beneath and around the eye of the storm. Storm surge occurs when low atmospheric pressure causes the ocean surface to expand and because the hurricane's cyclonic winds blow seawater towards the eye. Wind speed in a hurricane is usually directly related to atmospheric pressure (see Figure 4). The lower the pressure the faster the winds blow. Wind speed also varies within the storm. As discussed earlier, winds are usually strongest at the edge of the hurricane's eye. High winds inflict damage by flying debris, blowing down objects, creating choppy waves and high seas, and by inundating coastal areas with seawater. Rainfall within a hurricane often exceeds 60 cm (24 in.) in a 24-hour period. If this rainfall occurs on land, flooding often results. Hurricane Camille (1969 – category 5) had a storm surge of more than 7 m (23 ft) with a central pressure of 909 mb. A considerable amount of damage can also occur because of tornadoes. About 25% of the hurricanes that make landfall have associated tornadoes.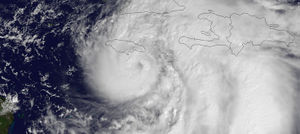

There is evidence to suggest that the thunderstorms that occur near the eye of a hurricane can produce very strong downbursts (vertical downward movements of air).The year 2005 was extremely bad for the development of tropical storms and hurricanes in the Atlantic Ocean. During the late summer and fall of that year, 28 tropical storms developed of which 15 became hurricanes. Table 2 describes some of the characteristics of each of the storms that developed into hurricanes. Seven of the tropical storms and hurricanes made landfall in the United States causing more than 100 billion US dollars worth of damage. Katrina was the most destructive storm of the 2005 season causing over 81 billion dollars of damage. This hurricane made landfall at the mouth of the Mississippi River on August 29th and flooded 80% of New Orleans. The strongest hurricane of the 2005 season was hurricane Wilma with a minimum storm pressure of 882 mb. This is the lowest pressure reading ever recorded for the Atlantic Ocean in modern times.
References
- Aguado, E. and James E. Burt. 2010. Understanding Weather and Climate. Fifth Edition. Prentice Hall, Upper Saddle River, New Jersey.
- Ahrens, C. D. 2006. Meteorology Today. An Introduction to Weather, Climate, and the Environment. Eighth Edition. Thompson, Brooks/Cole. USA.
- K. R. Briffa, P. D. Jones, T. S. Bartholin, D. Eckstein, F. H. Schweingruber, W. Karlén, P. Zetterberg, M. Eronen, Fennoscandian summers from A.D. 500: Temperature changes on short and long timescales. Clim. Dyn. 7, 111–119 (1992).
- Kam-biu Liu, Caiming Shen and Kin-sheun Louie (2001) A 1,000-Year History of Typhoon Landfalls in Guangdong, Southern China, Reconstructed from Chinese Historical Documentary Records. Annals of the Association of American Geographers. Vol. 91, No. 3 (Sep., 2001), pp. 453-464 (12 pages). Published By: Taylor & Francis, Ltd.
- Lutgens, F.K. and E.J. Tarbuck. 2004. The Atmosphere: An Introduction to Meteorology. NinthEdition. Prentice Hall, Upper Saddle River, New Jersey.
- Oliver, J.E. and J.J. Hidore. 2002. Climatology: An Atmospheric Science. Second Edition. Prentice Hall, Upper Saddle River, New Jersey.