San Francisco Earthquake of 1906
The California earthquake of April 18, 1906 ranks as one of the most significant earthquakes of all time. Today, its importance comes more from the wealth of scientific knowledge derived from it than from its sheer size. Rupturing the northernmost 296 miles (477 kilometers) of the San Andreas fault from northwest of San Juan Bautista to the triple junction at Cape Mendocino, the earthquake confounded contemporary geologists with its large, horizontal displacements and great rupture length. Indeed, the significance of the fault and recognition of its large cumulative offset would not be fully appreciated until the advent of the theory of plate tectonics more than half a century later. Analysis of the 1906 displacements and strain in the surrounding crust led Reid (1910) to formulate his elastic-rebound theory of the earthquake source, which remains today the principal model of the earthquake cycle.
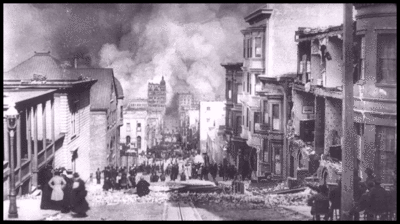 Figure 1. Sacramento Street and approaching fire. (Arnold Genthe/Steinbrugge Collection)
At precisely 5:12 a.m., local time, a foreshock occurred with sufficient force to be felt widely throughout the San Francisco Bay area. The great earthquake broke loose some 20 to 25 seconds later, with an epicenter near San Francisco. Violent shocks punctuated the strong shaking which lasted some 45 to 60 seconds. The earthquake was felt from southern Oregon to south of Los Angeles and inland as far as central Nevada. The highest Modified Mercalli Intensities (MMI's) of VII to IX paralleled the length of the rupture, extending as far as 80 kilometers inland from the fault trace. One important characteristic of the shaking intensity noted in Lawson's (1908) report was the clear correlation of intensity with underlying geologic conditions. Areas situated in sediment-filled valleys sustained stronger shaking than nearby bedrock sites, and the strongest shaking occurred in areas where ground reclaimed from San Francisco Bay failed in the earthquake. Modern seismic-zonation practice accounts for the differences in seismic hazard posed by varying geologic conditions.
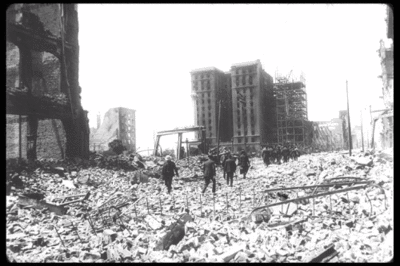
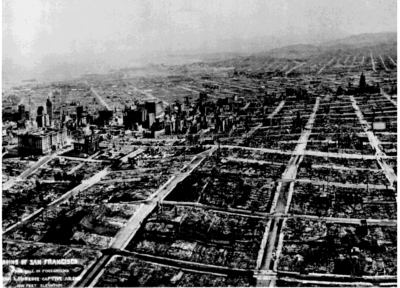 Figure 2. Five weeks after the earthquake. (George Lawrence, photo courtesy of Harry Myers).
As a basic reference about the earthquake and the damage it caused, geologic observations of the fault rupture and shaking effects, and other consequences of the earthquake, the Lawson (1908) report remains the authoritative work, as well as arguably the most important study of a single earthquake. In the public's mind, this earthquake is perhaps remembered most for the fire it spawned in San Francisco, giving it the somewhat misleading appellation of the "San Francisco earthquake". Shaking damage, however, was equally severe in many other places along the fault rupture. The frequently quoted value of 700 deaths caused by the earthquake and fire is now believed to underestimate the total loss of life by a factor of 3 or 4. Most of the fatalities occurred in San Francisco, and 189 were reported elsewhere. (excerpted from Ellsworth, 1990.)
See also: Shock Waves: One Hundred Years After the 1906 Earthquake. This 46-minute film includes dramatic historical footage, colorful animations, and interviews with earthquake experts.
Contents
How Large was the Earthquake?
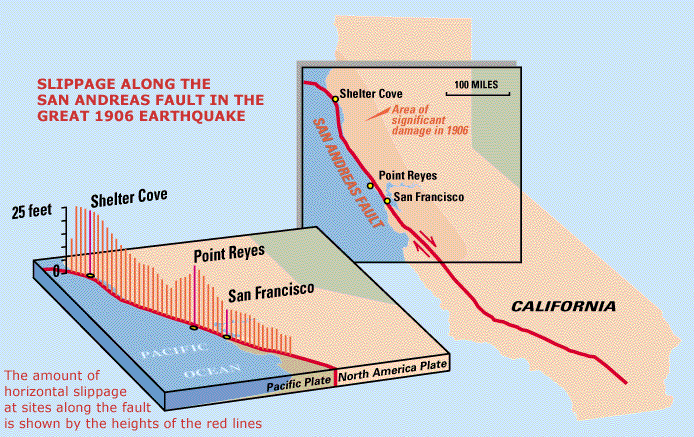 Figure 5. Size of offsets inferred at depth at various locations along the fault.
What was the intensity of the shaking?
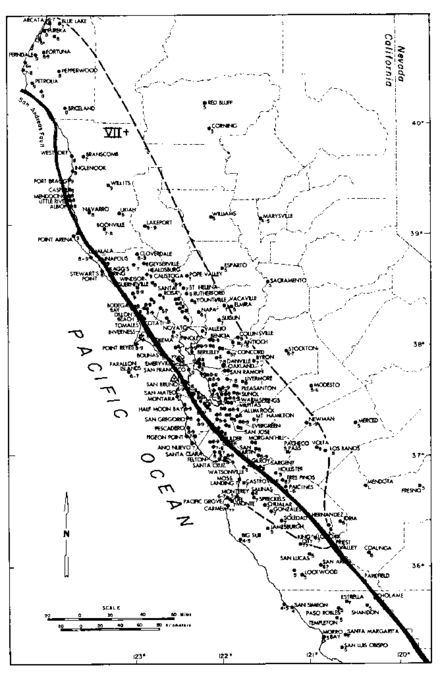 Figure 8. Area of Modified Mercalli Intensity > 7 (Dashed line. Toppozada and Parke)
Intensity today is measured on the Modified Mercalli Intensity scale. Many intensity values of 8 (Moderate Damage) and 9 (Heavy Damage) occurred in a broad band along the rupture and extending as much as 60 miles (97 kilometers) to the east of the San Andreas fault.
Because of the huge losses in San Francisco, we tend to forget the extensive damage done to other cities along the fault, like Santa Rosa.
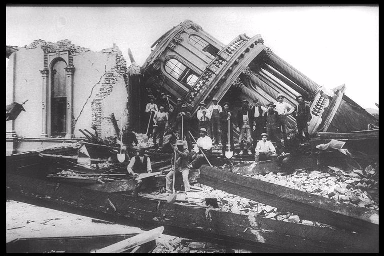 Figure 9. Santa Rosa City Hall. (Steinbrugge Collection)
What was the magnitude?
The magnitude of 1906 has been redetermined in two recent studies that used rather different approaches:
M = 7.7 David Wald, Hiroo Kanamori, Donald Helmberger, and Thomas Heaton (Cal Tech and USGS) studied recordings of the 1906 seismic waves made at 96 observatories around the world. Data from 12 of these observatories were of good enough quality to be digitized and modeled, and suggest a surface wave magnitude (Ms) of 7.7. They also found that most of the shaking energy came from two separate areas on the fault -- one between Point Reyes and Fort Ross to the north and the second on the San Francisco Peninsula to the south.
M = 7.9 Wayne Thatcher, Grant Marshall, and Michael Lisowski (USGS) have re-evaluated the geodetic data from before and after the 1906 earthquake. The offset on the fault plane produces ground deformation over a broad region around the fault. This deformation manifests itself as changes in the angles and distances between benchmarks in geodetic networks. Using the observed changes, these scientists constructed models of the slip distribution on the fault plane in 1906. Based on the amount of slip, these models suggest a moment-magnitude (Mw) of 7.9.
M = 8.3? The traditional magnitude of 8 1/4 or 8.3 comes from Richter (1958). However, the Richter magnitude scale (Richter scale) was developed for local earthquakes recorded on high-frequency seismometers. The preferred descriptor for large earthquakes rich in low frequencies is the moment magnitude as used by Thatcher et al (above). This magnitude is directly proportional to energy release and can be obtained from analysis of broad-spectrum seismograms or from the product of the rupture area and average fault slip. Each unit step in moment magnitude is equivalent to roughly a factor of 32 in energy release, thus it would require roughly 30 1989 Mw=6.9 Loma Prieta earthquakes occurring simultaneously to equal the energy release of 1906.
Why can't scientists agree on magnitudes for earthquakes?
For older earthquakes, the data are often of poor quality or the few stations existing at the time may not have been in the best locations to record the information needed. There are also a number of different ways to measure the "size" of an earthquake, which because of details of the rupture process for an individual earthquake, may not always agree, even for recent earthquake.
A Seismogram of the 1906 Earthquake
 Figure 10. Seismogram recorded in Gottingen, Germany.
Above is a seismogram recorded in Gottingen, Germany, 9100 kilometers away. It shows how the ground moved in Germany as a result of the 1906 San Francisco earthquake. Time advances from left to right. Small wiggles, beginning 1/2 inch (1.3 centimeters) from left end, signal arrival of first compressional (P) waves. Large wiggles half way along represent arrival of slower-traveling shear (S) waves. The part of the record shown here spans about 1600 seconds or 26 minutes. The instrument subsequently went off-scale when surface waves arrived.
Casualties and Damage After the 1906 Earthquake
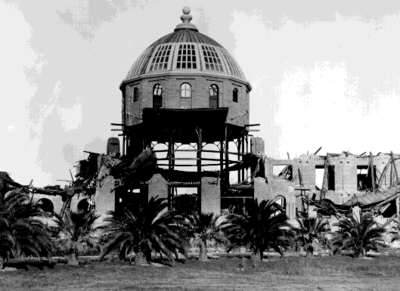 Figure 11. Stanford University 1906 Earthquake damage.
Dead:
- A report of U.S. Army relief operations (Greely, 1906) recorded:
- 498 deaths in San Francisco
- 64 deaths in Santa Rosa
- 102 deaths in and near San Jose
- A 1972 NOAA report suggested that 700-800 was a reasonable figure.
- Gladys Hansen and Emmet Condon, after extensive research, estimated that over 3000 deaths were caused directly or indirectly by the catastrophe. The population of San Francisco at the time was about 400,000.
Homeless - 225,000 - from a population of about 400,000. (photos)
Buildings Destroyed - 28,000
- "The 3-day conflagration following the earthquake caused substantially more damage than did the earthquake. The area of the burned district covered 4.7 square miles (12.1 square kilometers) ..." (NOAA report). By one count:
Monetary Loss - More than $400 million
- Estimated property damage (NOAA report): $400,000,000 in 1906 dollars from earthquake and fire, $80,000,000 from the earthquake alone. (photos)[1]
View official reports from five San Francisco City departments: Fire, Police, Library, Board of Education, and Public Works.
When Will it Happen Again?
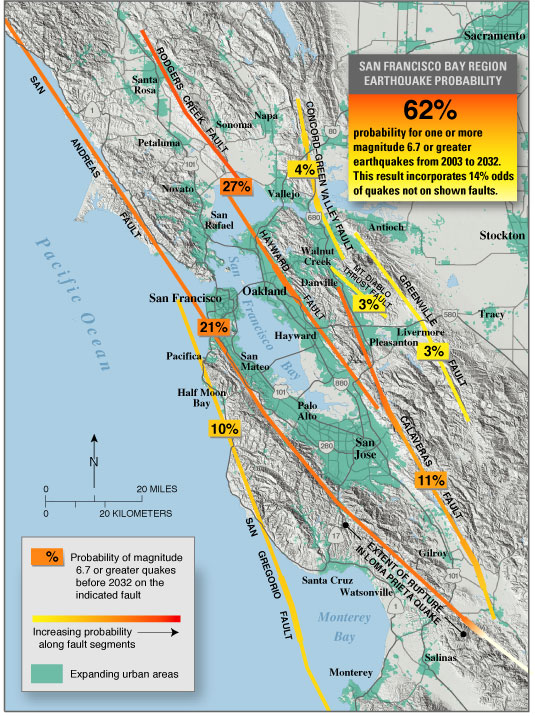 Figure 12. 30 year probabilities for fault segments in the SF Bay Area.
Scientists cannot predict precisely when the next 1906-like earthquake will happen. Unfortunately, earthquakes do not produce known warning signs just before they occur. So estimates of when a large earthquake will occur are imprecise and are based on "models."
A model is a simplified idea of how something works. For the repeat of the 1906 earthquake, the best models consist of two parts:
- the THEORY of plate motion and the accumulation of stress along a locked fault; and,
- OBSERVATIONS of past earthquakes on that fault and the rate the plates are now moving.
These models suggest that it might take 200 years or more (starting in 1906) before enough stress accumulates on the fault to produce another great earthquake. (The long-term rate of motion, averaged over many earthquake cycles, on the 1906-segment of the San Andreas fault is between 0.75 to 1 inch (1.9 to 2.5 centimeters) per year. At this rate, a 20 foot (6 meter) earthquake offset requires 200-240 years to accumulate.)
But this estimate is not precise because earthquakes do not occur "like clockwork", and because other factors not included in our simple model may be involved. So, while the most likely time for a 1906-like earthquake to strike again is perhaps late in the next century, there is a small chance (about 2 percent) that it could happen in the next 30 years.
However, this does not mean that the San Francisco Bay region will not experience damaging earthquakes in the next hundred years.
Models for the Hayward fault, the Rogers Creek fault and the Peninsula section of the San Andreas fault suggest that smaller earthquakes (say, ones with magnitude 7) are also expected, and are now much more likely to cause serious damage than a repeat of the Magnitude 8, 1906 earthquake.
Shaking is just as intense in an M7 as it is in an M8, but it doesn't last as long and isn't as widespread. The main danger now to Bay area is from M7's.
If the 19th century is an example, then we can expect one or more M7 earthquakes on Bay area faults in the decades leading up to the repeat of the 1906 earthquake -- i.e., over the next several decades.
The Working Group on California Earthquake Probabilities estimated after the 1989 Loma Prieta earthquake that the probability of a magnitude 7 earthquake in the next 30 years in the San Francisco Bay region was 67 percent. (U.S.G.S. Circular 1053)
Probabilities (shown in boxes) of one or more major (M>=6.7) earthquakes on faults in the San Francisco Bay Region during the coming 30 years. The threat of earthquakes extends across the entire San Francisco Bay region, and a major quake is likely before 2032. Knowing this will help people make informed decisions as they continue to prepare for future quakes.
See:
- Earthquake Probabilities for the San Francisco Bay Region
- When Will the Next Great Quake Strike Northern California?The Great 1906 San Francisco Earthquake is the most powerful in Northern California's recorded history. New studies of this earthquake are yielding important clues about how and when such events occur. With this improved knowledge we can better prepare for future strong temblors.
Scientific Lessons
Earthquake Science in the U.S. Before 1906
The 1906 earthquake marked the dawn of modern scientific study of the San Andreas fault system in California. Before 1906, earthquake research in the U.S. had advanced slowly compared to efforts in Japan and Europe. The first seismographs in the U.S. were installed in 1887, at the Lick Observatory (Mount Hamilton, California) and at the University of California at Berkeley. Around the turn of the century, a small number of geology professors at U.S. universities and geologists working for the U.S. Geological Survey contributed some of the earliest observations of earthquake-related features and compiled the earliest lists of historic earthquakes in the U.S. Relatively little was understood at the time about earthquakes, how and where they occurred, or the hazard they would present to our westward-bound, expanding nation. The theory of plate tectonics was still more than a half-century away.
The 1906 Earthquake Spawns a Flurry of Scientific Investigation
When the 1906 earthquake struck on April 18, nearly all scientists in California began to assemble observations of the earthquake and its effects. Professor Andrew C. Lawson, chairman of the geology department at the University of California, Berkeley, took the first steps that led to Governor George C. Pardee's order, three days later, to appoint a State Earthquake Investigation Commission to unify the work of scientific investigations then under way. Professor Lawson headed the Commission. Scientists (including professors of geology and astronomy) from Stanford University, the Lick Observatory, the Chabot Observatory in Oakland, University of California, Johns Hopkins University and the U.S. Geological Survey served on the Commission. Thus, the first integrated, government-commissioned scientific investigation into earthquakes in the U.S. was launched. No State funds were available, however, to support the effort; funding was provided by the Carnegie Institution of Washington.
The Commission's final report (published in 1908, and now commonly referred to as the Lawson report) was an exhaustive compilation of detailed reports from more than twenty contributing scientists on the earthquake's damage, the movement on the San Andreas fault, the seismograph records of the earthquake from around the world, and the underlying geology in northern California. The Lawson report includes numerous photographs of damaged buildings, detailed maps of their locations, and data from surveys of the earth's movement in the earthquake along the San Andreas fault. To this day, the report remains a document of the highest regard among seismologists, geologists and engineers -- a benchmark for future, integrated investigations into the effects of earthquakes in the U.S.
The Investigations Pay Off... A Coherent Picture Emerges
The 1906 earthquake and the Lawson report demonstrated the importance of accurate, widespread and repeated observations of earthquakes, their effects, and the faults on which they occur. The report provided the basis for much of what is now known about earthquakes in California. The detailed surveys described in the Lawson report show that the damage to buildings in the earthquake was strongly related to both the design and construction of the structure and the local geology -- the type of soil or rock on which it was built. Maps included in the report of apparent shaking intensity in San Francisco clearly show that some of the strongest shaking in 1906 occurred in the soft sedimentary soils of China Basin and in the present Marina district -- two San Francisco neighborhoods that would, some 83 years later, again (and for the same reason) be shaken hard and damaged in the 1989 Loma Prieta earthquake. Other maps of the shaking effects state-wide show that the soft soils bordering San Francisco Bay from San Mateo to San Jose and around the Bay also experienced especially strong shaking. Geological observations carried out after the earthquake by individuals who walked virtually the entire length of the earthquake rupture (often through poison oak-covered hills) showed where and how much the fault had slipped. Maps of triangulation surveys carried out during 1906-1907 also documented the earth movement. This information plays a key role in our current models of how much (and when) the San Andreas is expected to slip in the next earthquake.
The New Knowledge Leads to an Important Theory...
Among the most significant observations made after the 1906 earthquake were triangulation surveys -- optical measurements that detect changes in the angles between lines connecting monuments fixed in the ground. By repeating previous triangulation measurements, it was found after 1906 that displacements in the earthquake were largest at the fault and decreased with distance from it, so that a previously straight line crossing the fault had become curved. These observations provided the basis for the landmark "theory of elastic rebound", introduced by Professor H.F. Reid of Johns Hopkins University, who served on Lawson's Commission. Reid's theory extended earlier insights into the earthquake process by G.K. Gilbert of the U.S. Geological Survey, who also served on the Lawson Commission. This theory, which forms the basis for our modern understanding of earthquakes, describes how the earth's crust gradually and elastically distorts with accumulating plate motion until it is suddenly returned to its undistorted state by rapid slip along a fault, releasing the years of accumulated strain and, in the process, generating seismic waves that produce shaking. Before 1906 and Reid's theory, this basic mechanical concept of earthquakes -- that the faulting causes the earthquake and that the earthquake does not cause the faulting -- was not well recognized as a universal principle applicable to the San Andreas fault.
From 1906 to the Present -- More Advanced Earthquake Monitoring Leads to Greater Understanding...and Reduction of...Earthquake Hazards
Since 1906, a vigorous earthquake research program has developed in the U.S. Today, seismographs measure the shaking intensity at over 1000 sites in California. Geodetic instruments and repeated surveys track the plate motion and the related stressing and distortion of the Earth's crust (which causes earthquakes) throughout California. Data from these instrument networks are analyzed with the aid of computers. From these observations, scientists have formed a detailed picture of the location and activity of the hundreds of faults that make up the San Andreas fault system. They have achieved a growing understanding of which faults are likely to produce strong earthquakes, what their long-term probabilities for occurrence are, and how intense the shaking from them is likely to be. From this understanding, maps have been created that anticipate where shaking is likely to be strong, and these maps guide regional zoning and land use decisions affecting the location of schools, hospitals, homes and nuclear power plants. Also from this understanding, engineers have developed building codes designed to produce buildings and bridges that can withstand the shaking. Earthquake research also guides insurance companies in their formulation of earthquake insurance policies that help businesses and individuals deal affordably with earthquake risk.
Significant Advances... and Challanges for the Future
Of course, there are still major questions about earthquakes for which we really have no answers at this time. Probably the most asked question is Exactly when will the next damaging earthquake happen? At present we cannot answer this more precisely than by stating the long-term probabilities for large earthquakes. But when one considers how much we have learned about the other important questions --
- Where is a strong quake likely to happen?
- How probable is it?
- How intense will the shaking be?
- How well will our infrastructure fare?
- Where should we avoid building critical structures?
- How do we design and build earthquake-resistant structures?
-- when one considers these questions and what has been learned since 1906, it is clear that tremendous progress has been made. In this very real sense, society today is better off because of the great foresight of Governor Pardee and wisdom and scientific insight of Professors Lawson, Reid and Gilbert, who, in the wake of the 1906 earthquake launched California into the modern age of earthquake science 90 years ago.
Reid's Elastic Rebound Theory
From an examination of the displacement of the ground surface which accompanied the 1906 earthquake, Henry Fielding Reid, Professor of Geology at Johns Hopkins University, concluded that the earthquake must have involved an "elastic rebound" of previously stored elastic stress.
If a stretched rubber band is broken or cut, elastic energy stored in the rubber band during the stretching will suddenly be released. Similarly, the crust of the earth can gradually store elastic stress that is released suddenly during an earthquake.
This gradual accumulation and release of stress and strain is now referred to as the "elastic rebound theory" of earthquakes. Most earthquakes are the result of the sudden elastic rebound of previously stored energy.
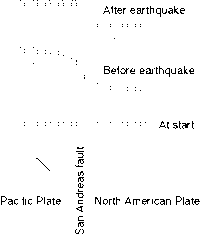
The following diagram illustrates the process. Start at the bottom. A straight fence is built across the San Andreas fault. As the Pacific plate moves northwest, it gradually distorts the fence. Just before an earthquake, the fence has an "S" shape. When the earthquake occurs the distortion is released and the two parts of the fence are again straight; but now there is an offset.
This diagram greatly exaggerates the distortion. Actually, the distortion is spread over many miles and can only be seen with precise instrumentation (e.g. GPS).
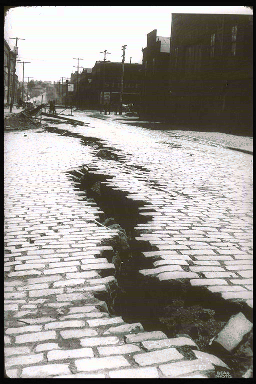 Figure 14. A crack near 18th Street. (from Steinbrugge Collection)
Soil Type Greatly Influences Severity of Damage
Reports showed that damage was greatest on artificially filled ground, marshy ground and areas of incoherent sands. Areas that suffered the least damage were on rock.
Unfortunately, these reports did not have a major effect on redevelopment of the Marina and areas south of Market Street in San Francisco after the earthquake, and the same areas sustained heavy damage during the Loma Prieta earthquake of 1989.
Although miles from the fault, many San Francisco's streets were rippled and torn. Shown right is a crack near 18th Street looking east to Folsom Street in San Francisco.
Big Quakes can be Followed by Decades of Inactivity
The 1906 earthquake essentially turned off earthquakes of magnitude about 6 and larger for the next 73 years (with one exception in 1911). In the 70 years before, there had been at least 16 earthquakes of this magnitude, as shown below:
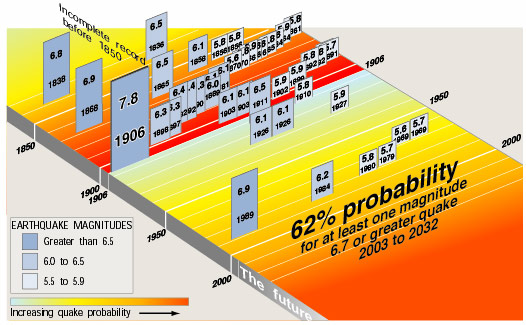 Figure 15. Earthquakes with magnitude about 6 and larger in the Bay Region since 1836.
Earthquakes with magnitude about 6 and larger in the Bay Region since 1836.
The likely explanation for this period of seismic quiet is that slip on the 1906 fault plane redistributed stress on other San Francisco Bay area faults.
Because most major faults in the area are nearly parallel to the San Andreas fault, the change in stress tended to be in a sense to relax these faults. (If one of two side-by-side faults fails, the other will generally be relaxed; if the two faults are end-to-end, the second will become more stressed by the failure of the first.)
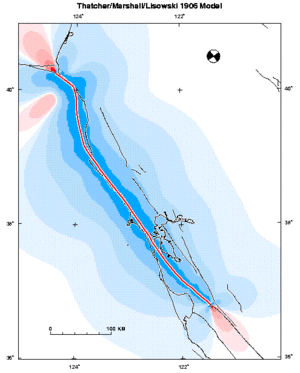 Figure 16. Stress changes after 1906 for faults parallel to the San Andreas.
Stress changes after 1906 for faults parallel to the San Andreas. In blue regions, parallel faults are less stressed; in red regions, more stressed. Nearly all major faults were relaxed after 1906.
The important lesson here is that for most of this century, central California has been experiencing a seismically quiet period caused by stress relaxation after 1906. The region may slowly be recovering from this "stress shadow" to a more normal state of seismicity as the tectonic plates continue to move, and the stresses on the major faults recover to the values that they had in 1905.
New information about the San Andreas Fault
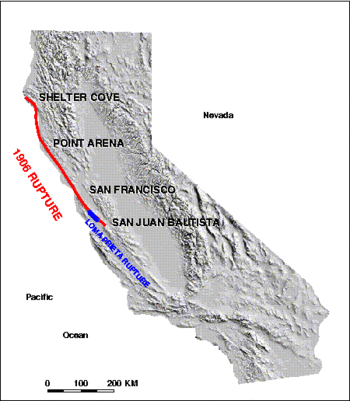
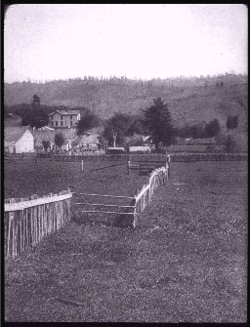
The 1906 earthquake was accompanied by nearly 300 miles of surface rupture along the San Andreas Fault between San Juan Bautista and Shelter Cove. On the surface, the maximum measured displacement was about 21 feet (6.4 meters), near Olema. The fault moved in a fashion that geologists of the time did not expect: it moved horizontally, the southwestern side slipping to the northwest, relative to the southeastern side. The offsets measured across the fault in other locations were smaller than the offset near Olema. Near Point Arena it was about 15 feet (4.6 meters). South of San Francisco, it was about 9 feet (2.7 meters), and dropped off to the southeast.
Paleoseismology has helped geologists to learn more about the behavior of the fault in 1906 and in prehistoric earthquakes. Paleoseismology involves the geologic study of the past behavior of active faults. Typical methods include excavating trenches across active faults to study and date the sediments that have been disrupted by prehistoric earthquakes. Results of these studies include constraints on the timing of prehistoric earthquakes, the amount of offset, and how fast the fault is moving, on the average, over geologic time (slip rate). More information about the geologically recent past behavior of active faults allows better forecasts of their future behavior. 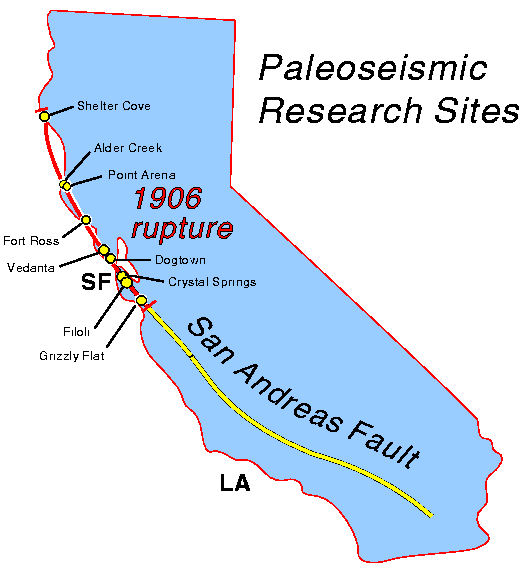 Figure 17. Map showing the 1906 rupture of the San Andreas fault. See Table 1 for measured slippage rates at paleoseismic research sites shown in figure.
| Site | Slip Rate | Events | Researchers |
|---|---|---|---|
| Shelter Cove | evidence that reported ground ruptures in 1906 were due to fault slip (1906 reports have been controversial) | Prentice, Merritts, Bodin and Beutner | |
| Alder Creek | 17 +/- 4 mm/yr (min) | Baldwin and Prentice | |
| Point Arena | 23 +/- 2 mm/y (max) | > 5 in 2 ka penultimate event after AD 1635 | Prentice and Sieh |
| Ft Ross | 19-22 mm/y | 6 in 2.5 -3.0 ka | Noller et al. |
| Olema | 24 +/- 3 mm/y (min) | Niemi and Hall | |
| Crystal Springs | Old estimate: 12 +/- 3 (min) Revised: highest minimum 8 mm/y | Hall | |
| Filoli | 15 +/- 3 mm/y | evidence for 1838 earthquake | Clahan, Hall and Wright |
| Grizzly Flat | penultimate event pre AD 1650 | Shwartz et al. |
Further Reading
- Bolt, B.A.,1968, The focus of the 1906 California earthquake: Seismological Society of America Bulletin, v. 58., no. 1, p. 457-471.
- Boore, D.M., 1977, Strong-motion recordings of the California earthquake of April 18, 1906: Seismological Society of America Bulletin, v. 67, no. 3, p. 561-577.
- Ellsworth, W.L., 1990, Earthquake history, 1769-1989, chap. 6 of Wallace, R.E., ed., The San Andreas Fault System, California: U.S. Geological Survey Professional Paper 1515, p. 152-187.
- Ellsworth, W.L., Lindh, A.G., Prescott, W.H., and Herd, D.G., 1981, The 1906 San Francisco earthquake and the seismic cycle, in Simpson, D.W., and Richards, P.G., eds., Earthquake Prediction: An international review (Maurice Ewing Series 4): Washington, American Geophysical Union, p. 126-140.
- Greely, A.W., 1906, "Special Report of Maj. Gen. Adolphus W. Greely, U.S.A., Commanding the Pacific Division, on the Relief Operations Conducted by the Military Authorities of the United States at San Francisco and other Points"
- Hansen, Gladys, and Condon, Emmet, 1989, Denial of Disaster: Cameron and Co., San Francisco, 160 p.
- Lawson, A.C., chairman,, 1908, The California Earthquake of April 18, 1906: Report of the State Earthquake Investigation Commission: Carnegie Institution of Washington Publication 87, 2 vols.(Volume I, Part 1 ; Volume I, Part 2; Volume II)
- NOAA, 1972, A study of earthquake losses in the San Francisco Bay Area - Data and Analysis, A report prepared for the Office of Emergency Preparedness: U.S. Department of Commerce, 220 p.
- Reid, H.F., 1910, The mechanics of the earthquake, v. 2 of The California Earthquake of April 18, 1906: Report of the State Earthquake Investigation Commission: Carnegie Institution of Washington Publication 87, C192 p.2 vols.
- Thatcher, Wayne, 1975 Strain accumulation and release mechanism of the 1906 San Francisco earthquake: Journal of Geophysical Research, v. 80, no. 35, p. 4862-4872.
- Thatcher, Wayne, and Lisowski, Michael, 1987, Long-term seismic potential of the San Andreas fault southeast of San Francisco, California: Journal of Geophysical Research, v. 92, no. B6, p. 4771-4784.
- Toppozada, T.R., Real, C.R., and Parke, D.L., 1988, Earthquake history of California, in Lee, W.H.K., Meyers, Herbert, and Shimazaki, Kunihiko, eds., Historical seismograms and earthquakes of the world: San Diego, Calif., Academic Press, p. 267-275.
- Field, E.F., Milner, K.R., and the 2007 Working Group on California Earthquake Probabilities. 2008, Forecasting California’s Earthquakes—What Can We Expect in the Next 30 Years?
- Wald, D.J., Kanamori, Hiroo, Helmberger, D.V., and Heaton,T.H., Source study of the 1906 San Francisco Earthquake: Bulletin of the Seismological Society of America, vol.83, no. 4, p. 981-1019, August 1993.
- Wallace, R.E., editor, 1990, The San Andreas Fault System, California: U.S. Geological Survey Professional Paper 1515, 283 pp.
- Working Group on California Earthquake Probabilities, 1990, Probabilities of Large Earthquakes in the San Francisco Bay Region, California: U.S. Geological Survey Circular 1053, 51 p.

1 Comment
gina castro wrote: 02-23-2013 19:48:07
Speechless..... a piece of history people forget about