Monitoring forest fire danger with remote sensing
Contents
Abstract
This paper presents a review of the use of remote sensing technologies for forest wildfire danger monitoring, with a particular emphasis on its applicability to fuel moisture monitoring. Remote sensing of fuel moisture was first done with NOAA-AVHRR NDVI images, but NDVI is more related to vegetation greenness rather than water stress. NOAA-AVHRR surface temperature images were also used, alone or in association with NDVI images. Both kinds of images have limited image availability due to cloud cover. This is not the case for radar images like those acquired by ERS-1/2, ENVISAT or RADARSAT satellites, but their use in fuel moisture monitoring is still experimental, because of the noisy effects of several factors. Finally, the paper discusses the operational potentials and limitations of the use of each kind of satellite data for fire danger monitoring.
Introduction
Ignition and spread of forest fires depends on fuel moisture and weather conditions as well as on fuel types and topography. The first group of factors is related to the temporal and short-term variation of fire danger, whereas the second group is related to its spatial and long-term variation. Most of the operational fire danger rating systems, such as the Canadian Forest Fire Danger Rating System (CFFDRS), combine weather, wood fuel, topography and ignition parameters to produce numerical ratings of relative fire potential. However, these ratings are made from point data. Therefore they are valid at the points where the observations were taken. It is then necessary to interpolate between these point data to make assumptions about fire danger ratings over large geographical regions. Such interpolation may not consider variations in environmental conditions at finer spatial scales. For example, while the CFFDRS accounts for forest type differences in fire behavior between fuel types through the Fire Behavior Prediction system, another of the CFFDRS subsystems, the Fire Weather Index (FWI) subsystem, does not account for those differences. It computes potential mid-afternoon fire danger from noon-time records of weather stations which are sometimes widely dispersed. Fires along Pacific Coast. Source: NASA. Information derived from satellite systems offers the potential to address these limitations. This rapidly developing technology offers the advantages of consistent, repeatable, large-area coverage, and can easily provide information from remote regions. In addition, remote sensing (Monitoring forest fire danger with remote sensing) data represent the integrated response of the vegetation to the different factors influencing its status as a fuel base for wildfires. Several fire danger parameters can be monitored using remote sensing. The first one is the fuel type, which can be mapped, like classical vegetation mapping, from high spatial resolution optical or radar images. These maps can then be linked, within a wildfire threat analysis system, to other fire danger parameters, such as topography, proximity to roads and to urban areas, etc....
Another fire danger parameter, which can be estimated by remote sensing, is the fuel moisture conditions. Our study presents a critical review of remote sensing studies of fuel moisture conditions. The review will focus on live fuel moisture conditions, which are in current fire prediction systems, either directly measured or broadly estimated. Dead fuel moisture conditions will also be considered, although they can be more easily computed from weather data and fuel characteristics, because dead fuel moisture is in balance with that of the surrounding atmosphere. In most of the reviewed studies, live fuel moisture conditions have been quantified as an absolute measurement of plant water content, through the Fuel Moisture Content (FMC) or the Equivalent Water Thickness (EWT). FMC is defined as the ratio between the quantity of water (fresh weight–dry weight) and either the fresh weight or the dry weight. EWT is the leaf water content per unit leaf area which is defined as the ratio between the quantity of water and the leaf area. Live fuel moisture conditions have been also quantified indirectly, through the degree of water stress which is expressed in terms of evapotranspiration rates. In our study, the term "optical" is used to describe wavelengths between 400 and 2500 nm, in contrast to the thermal infrared bands, which range from 3000 to 15000 nm. Both types of wavelengths are recorded by optical sensors. This study primarily focuses on satellite data, although the theory may also be applied to airborne sensors, which are currently used during fire suppression activities rather than as fire danger prediction tools.
Optical Remote Sensing
The first remote sensing studies on fuel moisture conditions monitoring used optical data, mainly NOAA-AVHRR NDVI images. This supposes that timing and extent of drought can be assessed from vegetation greenness, as retrieved from satellite data. NDVI data were also correlated to simulated forest evapotranspiration, to FWI codes and indices and to fire occurrences. NDVI-based operational systems have been proposed to assess fire potentials (Figure 1) and crop droughts or fire dangers.
These studies listed several problems related to the use of NDVI images in fuel moisture mapping, namely the saturation of relationships, the influence of site wetness on relationships and the difficulty of using NDVI over forests, due to the spectral mixture of the overstory with the understory, both being different in nature and in moisture content. In fact, NDVI and associated vegetation indices are only indirectly related to fuel moisture conditions, because it rather measures the greenness and the chlorophyllous activity of the vegetation. In a study on pre-fire conditions using NOAA-AVHRR over Northwest Territories showed that high FWI areas correspond to high surface temperature areas on the surface temperature NOAA-AVHRR image, indicating water stress, but to high NDVI areas over the NOAA-AVHRR NDVI image, indicating no drought conditions (Figure 2).
Greenness and the chlorophyllous activity of the vegetation explained the positive correlations between ΣNDVI and FWI codes and indices found by Leblon over Canadian northern boreal forests, since both types of variables increase in parallel throughout the fire season (Figure 3), but for two different reasons: FWI codes and indices, because of drought, and ΣNDVI because of vegetation growth. In addition, reduction in NDVI could be induced by factors other than drought, like disease or senescence and shadowing or penumbra. For all these reasons, a better use of NDVI images over forests will be to map timing of deciduous leaf flushing, which is critical in fire management, because of its relationship to fire occurrence in mixed-deciduous forests.
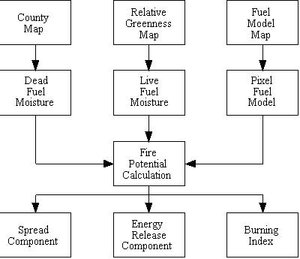 Figure 1. An operational system to compute fire potential maps from NOAA-AVHRR NDVI images Figure 1. An operational system to compute fire potential maps from NOAA-AVHRR NDVI images |
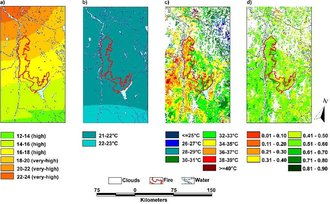 Figure 2. Map of (a) interpolated FWI, (b) interpolated Ta, and corresponding (c) Ts NOAA-AVHRR image and (d) NDVI NOAA-AVHRR image for the area, where the fire “vq0332” starts. The image was acquired 3 days before fire ignition Figure 2. Map of (a) interpolated FWI, (b) interpolated Ta, and corresponding (c) Ts NOAA-AVHRR image and (d) NDVI NOAA-AVHRR image for the area, where the fire “vq0332” starts. The image was acquired 3 days before fire ignition |
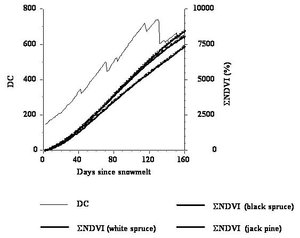 Figure 3. An example of seasonal variation for a slow-drying fuel moisture code (DC) and ΣNDVI for three boreal forest stands of Hay River, Northwest Territories, Canada. Figure 3. An example of seasonal variation for a slow-drying fuel moisture code (DC) and ΣNDVI for three boreal forest stands of Hay River, Northwest Territories, Canada. |
Fuel moisture is theoretically better related to another optical band, the shortwave infrared (1300-2500 nm). Relationships were significant only when the water stress was already well developed. Reflectance variations associated with water changes were smaller than those associated with leaf structure. In addition, shortwave bands are highly disturbed by atmospheric effects. Fuel moisture is also probably estimated better using hyperspectral data. Indeed, hyperspectral data allow derivative analysis which is useful to remove, on reflectance, the effect of leaf structure, of background and of atmosphere as well as to resolve overlapping spectra to better separate components of the global spectrum. Hyperspectral data were related to plant water content through empirical relationships or analytical models. However, from the operational point of view, both hyperspectral data are, up to now, only provided by airborne sensors and shortwave infrared data are acquired by only a few numbers of spaceborne sensors, among others LANDSAT-TM, SPOT-VEGETATION, NOAA-16 and MODIS. While the oldest ones like LANDSAT-TM have a long revisit period, the newest ones, like SPOT-VEGETATION and the new series of the AVHRR sensor, on board NOAA-16, or MODIS, have the advantage to allow daily image acquisition. This temporal scale may be longer on cloudy periods. The performance of these new sensors is still under evaluation. By contrast, for many years, thermal infrared data are provided more often and mostly at the same time as the optical visible and near-infrared ones, by several existing spaceborne sensors, e.g., NOAA-AVHRR, LANDSAT-TM, ATSR-2, RESURS-01, METEOSAT, GOES or MODIS.
Thermal Infrared Remote Sensing
Surface temperatures (Ts) were better correlated than NDVI to FWI codes and indices, to foliar moisture content and to shrub water potentials. They were also useful to detect water-stressed coniferous stands, when extreme differences in canopy water content occurred. In fact, the difference between surface and air temperatures is a better spectral index to monitor plant water status than the surface temperature solely, the last being too sensitive to weather conditions. In addition, according to the energy budget equation, plants respond to water stress by stomata closure, thereby decreasing latent heat transfer from leaf surface to the air and causing an increase in leaf surface temperature. Solving the energy budget equation, in which the sensible heat flux (H) is inferred from the difference between surface and air temperatures (Ts-Ta), as a function of the latent heat flux (LE) leads to an analytical relationship between actual evapotranspiration rate (AET) and Ts-Ta. Cumulative Ts-Ta data were well related to monthly fire start numbers throughout the fire season over Mediterranean forests. For the same ecosystem, Vidal used the energy budget equation to compute the ratio between actual and potential evapotranspirations (AET/PET) from daily NOAA-AVHRR surface temperatures and synoptic air temperatures. The ratio was related to fire occurrences and to two shrub flammability variables. The ratio was used to operationally monitor fire danger over Mediterranean forests in 1994 (Desbois and Vidal, 1995) and was correlated to FWI codes and indices over Canadian northern boreal forests.
However, these studies also showed that estimating AET from Ts-Ta using the energy budget equation is more problematic over forest canopies than over crop canopies. First, canopy height makes forests different from a thin leaf surface, as supposed by the energy budget equation, because of an additional level of radiation absorption and convective heat exchange between the ground and the superior stratum. Second, the measured surface radiative surface temperature is different from the aerodynamic surface temperature (Trad) required by the equation, because of an additional excess resistance (known as the kB-1 factor) to heat transfer from leaves, which increases with the canopy height. Third, the aerodynamic resistance (ra) is lower than the canopy resistance (rc) and Ts-Ta is thus less sensitive to moisture fluctuations. This lower sensitivity is compensated by the sensitivity of satellite signals to ground vegetation patches which are an important fire danger parameter. Also, the clumped nature of canopy elements in tree crowns reduces wind speed near leaves and allows sunlit leaves to have temperatures elevated well above Ta. Wind can affect temporal fluctuations of Ts-Ta, but these fluctuations on the 1 km pixel basis of NOAA-AVHRR may be very small, because eddies near the surface are on a scale of about 10 m and because of the spatial integration over the pixel.
The energy budget equation requires an estimate for Ta. If synoptic Ta measurements are used, they should be corrected for shelter and tree height effects. They can also be estimated as the radiative surface temperature of nearby well-watered canopies, since for not well-watered canopies, a systematical bias has been observed because the difference between surface and air temperatures is an indicator of water stress. Ta was also estimated as the radiative surface temperature corresponding to the extrapolation of the NDVI/Ts relationship to an NDVI of an infinitely thick vegetation canopy. However, such an estimate requires first that the range of variation in NDVI and Ts is enough to accurately define the slope. Second, the images should not be contaminated by clouds, snow or standing water, because the slope can then be positive. Third, the canopy should be well-watered because the NDVI/Ts slope can changed as a function of the moisture of the canopy. Indeed, the slope was related to several moisture-related variables which are listed in Section 4.
The energy budget equation also requires the knowledge of the aerodynamic and canopy resistances which are difficult to estimate and whose estimates are valid only for small areas. Thereby, other analytical models for computing AET from Ts have been proposed. The first one is the Surface Energy Balance Algorithm for Land (SEBAL). It computes LE as a residual quantity of the energy budget equation, but H is derived from the vertical difference in air temperature (dTa) between the surface roughness length to heat transport (zoh) and the reference height (zh), dTa being directly inferred from Ts. SEBAL has been validated on both short and tall vegetation.
The second one does not compute LE as a residual of the energy budget equation. It uses the Penman-Monteith approach, in which the vapour pressure deficit of the air (VPD) is estimated from the saturation vapour pressure at the mean daily surface temperature (VP*Ts). Indeed, according to the feedback theory, feedback links between the surface and the overlying air are such that the observed surface temperature is a good indicator of the air humidity over the surface. It is applicable to both short and tall canopies, because the VPD-VP*Ts relationship does not depend on the cover type. However, it does not distinguish between vegetated and non vegetated surfaces having the same surface roughness, temperature and air humidity, unless they have a different albedo leading to a different Rn. Its operational use thereby requires a careful land use mapping. There are other more sophisticated approaches to estimate AET from Ts, like soil-vegetation-atmosphere transfer (SVAT) models. SVAT models usually require a high number of input variables and thereby have little operational potentials in fire management.
Synergisms between Optical and Thermal Infrared Remote Sensing
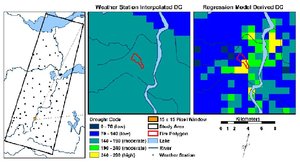 Figure 4. Comparison between a slow-drying fuel moisture code (DC) mapped by weather station interpolation and the one computed by stepwise multiple regression models from NOAA-AVHRR images for the June 1- June 10 1995 compositing period. The fire polygon corresponds to a 62 ha area burned between 2 and 17 June 1995
 Several empirical studies already showed that inclusion of thermal infrared data improved correlations between NDVI-related indices and drought-related variables. Oldford showed that for slow-drying fuel moisture code (DC) mapping, compared with weather station data interpolation, improved spatial resolution can be achieved at the pixel level when DC is computed using a regression model which has surface temperature and NDVI NOAA-AVHRR images sensing data as independent variables (Figure 4). The fire shown in the center of the 15x15 pixel area was classified by the Sustainable Resource Development Department of Alberta as a surface fire, caused by lightning. It is interesting to observe that the fire burned in a closed coniferous forest cover type which was classified as having a high DC danger rating, when the NOAA-AVHRR image was used, but it was classified as having a moderate DC danger rating in the weather station-based map.
Combining optical vegetation indices with surface temperature data helps account for the influence on the ground cover rate over the composite surface temperature measured by the sensor. This led to defining several NOAA-AVHRR-based drought indices, like the Vegetation and Temperature Condition Index (VT) of Kogan, an empirical index in Chuvieco, and the Water Deficit Index (WDI). WDI was related to the number of fires and the area burned in the case of Mediterranean forests. The inverse relationship between NDVI and Ts was related to fire occurrences in Mediterranean forests and to moisture-related variables, such as canopy resistance, sensible and latent heat flux, leaf water potential, accumulated rainfall, FWI codes and indices, and foliar moisture content.
Other synergisms between optical and thermal infrared data can also be considered when estimating AET using the energy budget equation. Indeed, the required net radiation flux (Rn) can be computed from the solar irradiance at the surface or from the surface albedo, both variables being inferred from optical data. Also, the ratio between the soil heat flux (G) and Rn can be analytically derived from optical vegetation indices.
Using both thermal infrared and NDVI images improve the correlation with fuel moisture variables, but these images have the same operational inconvenience of limited image availability during cloudy days. As reviewed in Leblon, many strategies can be applied to overcome the problem of cloudy days, like the interpolation of evaporation fractions for the cloudy days, or the use of images acquired by passive or active microwave sensors, which are able to penetrate cloud cover. Currently, only the SSM/I sensor provides images acquired in passive microwaves, but at a coarser spatial resolution than NOAA-AVHRR images. For all these reasons, this paper has no further discussion of the use of passive microwaves in fuel moisture monitoring. By contrast, active microwave (or radar) images can be acquired by many existing satellites, i.e., ERS-1/2, ENVISAT, and RADARSAT-1. In addition to acquiring images under all illumination and weather conditions, these satellites provide data at a finer spatial resolution than NOAA-AVHRR.
Radar Remote Sensing
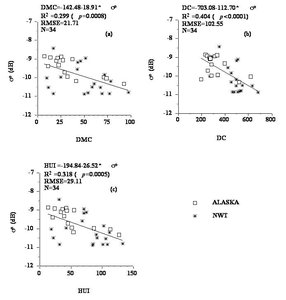 Figure 5. Relationship between ERS-1 SAR radar backscatters (so) and slow-drying fuel moisture codes and indices acquired over black spruce stands located in Alaska and in Northwest Territories. Figure 5. Relationship between ERS-1 SAR radar backscatters (so) and slow-drying fuel moisture codes and indices acquired over black spruce stands located in Alaska and in Northwest Territories. |
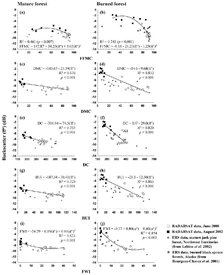 Figure 6. Relationship between RADARSAT-1 C-HH SAR radar backscatters and fuel moisture codes and indices over a boreal forest site, Northwest Territories, Canada Figure 6. Relationship between RADARSAT-1 C-HH SAR radar backscatters and fuel moisture codes and indices over a boreal forest site, Northwest Territories, Canada |
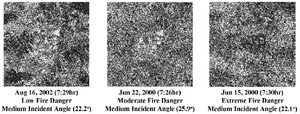 Figure 7. RADARSAT-1 C-HH images acquired under similar incidence angles (between 22.1o and 25.9o), but under three fire danger conditions: (a) low fire danger (FWI = 0.8), (b) medium fire danger (FWI = 6.8) and (c) extreme fire danger (FWI = 29.3) Figure 7. RADARSAT-1 C-HH images acquired under similar incidence angles (between 22.1o and 25.9o), but under three fire danger conditions: (a) low fire danger (FWI = 0.8), (b) medium fire danger (FWI = 6.8) and (c) extreme fire danger (FWI = 29.3) |
Studies reviewed in Leblon and in Abbott have shown that radar backscatter (so) measurements over forested areas depend on (i) vegetation type, species, and structure, (ii) vegetation biomass, (iii) topography and surface roughness and canopy height; (iv) flooding and the presence/absence of standing water, and (iv) moisture. Three sources of moisture variation may contribute to the forest radar backscatter: the forest floor, the canopy (including its woody elements) and the environmental conditions (rain events). Similarly to Bourgeau-Chavez, Leblon found positive relationships between ERS-1 C-VV radar backscatters and rainfall amounts. Similar relationships were obtained with RADARSAT-1 C-HH radar backscatters. The good correlation between so and weather variables, which are used to compute the various FWI codes and indices, may expect that these indices and codes are also well related to so. Indeed, FWI codes and indices were correlated to so derived from ERS-1 and RADARSAT-1 SAR images acquired over burned and unburned boreal forests in Alaska. Good correlations were obtained with fuel moisture codes using ERS-1 SAR images (Figure 5) and RADARSAT-1 SAR images (Figure 6) acquired over Northwest Territories boreal forests.
The influence of fire danger conditions was apparent on the RADARSAT-1 C-HH SAR images (Figure 7), where image tones (particularly for the burned areas) was darker under extreme fire danger conditions than under low fire danger conditions, because dry conditions decrease radar backscatter. Although radar images are theoretically available independently of the weather conditions, their availability could be limited because of the longer repeat cycle of the satellites. For example, ERS-1 has a repeat cycle of 35 days, and sometimes even longer, because often the satellite acquires images during night. Fortunately the revisit period is shorter for the Canadian radar satellite (RADARSAT-1), which has a possible quasi-daily coverage thanks its moving sensor. In addition, often the radar images have a finer spatial resolution than optical or thermal infrared images, while covering a smaller area. Thus, radar data represent a data source that is complementary to optical or thermal infrared data. Consequently, synergisms between optical or thermal infrared bands and radar bands should be investigated. Empirical studies and theoretical simulations over rangeland or crop canopies have shown that the relationship between optical or thermal infrared data and radar backscatters acquired over plant canopies is sensitive to soil moisture. To minimize soil moisture interferences, it is necessary either to use high-frequency (Ku-VV) radar backscatters acquired at midday under large incidence angles or cross-polarization C-band ratios. There are very few studies on such an optical or thermal infrared/radar synergism over forest canopies.
Conclusions
We reviewed studies using optical, thermal infrared and radar images for fire danger monitoring, with a particular emphasis on those using satellite data to monitor fuel moisture. Remote sensing of fuel moisture was first done with NOAA-AVHRR NDVI images, based on the assumption that the greenness of the scene is a good indicator of fuel moisture and fire danger. NDVI images are used operationally to map fire potentials, but the reviewed studies have shown that NDVI is sensitive to the chlorophyll activity of the vegetation rather than to its changes in moisture content. By contrast, NOAA-AVHRR thermal infrared images allow the computation of surface temperatures which are analytically related to surface moisture-related variables, like evapotranspiration, through the energy budget equation. This analytical approach was used to compute the ratio between actual and potential evapotranspiration (AET/PET) from daily NOAA-AVHRR surface temperatures and synoptic air temperatures. The ratio was used in an operational fire danger monitoring system over Mediterranean forests. The same ratio was computed from NOAA-AVHRR images acquired over Canadian northern boreal forests and related to FWI codes and indices. In the AET/PET computation, NDVI images were also used, in the calculation of soil heat flux and aerodynamic resistances. More recent studies on the use of remote sensing in fuel moisture monitoring use both NDVI and surface temperature NOAA-AVHRR images. This is done at no additional cost of data acquisition, since both kinds of images are provided in the same time by numerous existing satellites, like NOAA-AVHRR, LANDSAT-TM, ATSR-2, RESURS-01, METEOSAT, and GOES. Estimation accuracy should improve in the near future thanks to the availability of satellites, like the new LANDSAT-TM, EOS-ASTER, and EOS-MODIS, providing optical and thermal infrared images at a finer spatial resolution than NOAA-AVHRR. An important operational limitation of using optical and thermal infrared data is image availability, which still depends on weather and illumination conditions. For this reason, an operational system to monitor fuel moisture using satellite images should probably also include radar images, which can be acquired during cloudy days. These images have also the advantage of having a finer spatial resolution. Good relationships have been found between ERS-1 and RADARSAT-1 radar backscatters and FWI codes and indices over northern boreal forests, but the operational use of SAR images in fire danger monitoring is limited for two reasons. First, radar backscatters are affected by numerous factors other than those related to moisture. Second, image availability is limited by the long revisit periods of most existing radar satellites and by the commercial operating mode of the new satellites, like RADARSAT-1. For this reason, the most promising use of satellite images for fire danger monitoring is through the combination of optical and thermal infrared images to radar images. Relationships that combine optical or thermal infrared data with radar backscatters acquired over plant canopies have been shown to be sensitive to soil moisture, but the minimization of this factor can be done with cross-polarization C-band ratios. Multipolarized SAR images are provided by the SIR-C prototype on board on Shuttle missions, by ENVISAT ASAR and in the near future by the planned RADARSAT-2 satellite. This new satellite will have the additional advantage of providing images at a fine spatial resolution (pixel of 3 m). It will also provide fully polarimetric SAR images which have even more information than multipolarized SAR images, because they retain the phase information. NASA also plans to launch a spaceborne platform having optical, thermal infrared and multi-frequency/multipolarization SAR sensors. Further studies are needed to test the applicability of a combined use of these images in forest fuel monitoring. Finally, most of the reviewed remote sensing studies on fire danger are based on the estimation of fuel moisture, which is one of the canopy factors which influences fire danger. However, further research is needed to evaluate whether current fire danger rating systems can account for canopy variables, like evapotranspiration or moisture content, which are more closely related to spectral variables. On the other hand, all required input variables of an operational fire danger system, like wind parameters, will surely not be derived from remote sensing data and additional ground-based and weather information will always be required to effectively monitor fire danger. In this regard, in situ sensing systems, as described in Teillet, will be useful. (Monitoring forest fire danger with remote sensing)
Acknowledgments
This study is a compendium of the works from the following students: Lisa Gallant, Shannon White, Mark Doyle, Melissa Abbott, Guy Strickland, Keith Abbott, Steven Oldford and P.A Fernandez-Garcia. The whole study was funded by CIFFC, RADARSAT International Inc. and by NSERC. NOAA-AVHRR images were provided under the EODS program, thanks to J. Cihlar and J. Chen, Canada Centre of Remote Sensing, Ottawa. ERS-1 SAR images were provided by E.S. Kasischke. RADARSAT-1 images were acquired under the ADRO-2 program of the Canadian Space Agency. Weather data were obtained from Marty Alexander, Canadian Forest Service, Edmonton and Rick Lanoville, Government of Northwest Territories, Fort Smith. ERS-1 and RADARSAT-1 SAR image processing were helped by N. French, L. Bourgeau-Chavez and Gordon Staples.
See Also
Further Reading
- Abbott, K., Leblon, B., Staples, G., Alexander, M.E., and MacLean, D.: 2007. Fire danger monitoring in a northern boreal forest region using RADARSAT-1 imagery, Int. J. Remote Sens. 28 (5-6): 1317-1338.
- Aguado, I., Chuvieco, E., and Salas, J.: 2003, Assessment of forest fire danger conditions in southern Spain from NOAA images and meteorological indices. Int. J. Remote Sens. 24(8), 1653-1668.
- Bastiaanssen, W.G.M., Menenti, M., Fedded, R.A., and Holtslag, A.A.M.: 1998, A remote sensing surface energy balance algorithm for land (SEBAL). 1. Formulation. J. Hydrol. 212-213, 198-212.
- Bourgeau-Chavez, L.L., Kasischke, E.S., and Rutherford, M.D.: 1999, Evaluation of ERS SAR data for prediction of fire danger in a boreal region, Int. J. Wildland Fire 9(3), 183-194.
- Bourgeau-Chavez, L. L., Brunzell,S., Nolan, M., and Hyer, Ed.: 2001, Analysis of SAR data for fire danger prediction in boreal Alaska, Final Report, ASF-IARC Grant NAS-98-129, 59 pages.
- Burgan, R.E., Klaver, R. W., and Klaver, J.M.: 1998, Fuel models and fire potential from satellite and surface observations, Int. J. Wildland Fire 8(3), 159-170.
- Camia, A., Bovio, G., Aguado, I. and Stach, N.: 1999, Meteorological fire danger indices and remote sensing, In: Remote Sensing of Large Wildfires in the European Mediterranean Basin (E. Chuvieco Ed.), Berlin: Springer-Verlag, pp. 39-59.
- Canadian Forest Service: 1992, Development and Structure of the Canadian Forest Fire Behaviour Prediction System, Canadian Forest Service, Information Report ST-X-3, Ottawa, ONT., 63 p.
- Ceccato, P., Flasse, S., Tarntola, S., Jacquemoud, S., and Grégoire, J.M.: 2001, Detecting vegetation leaf water content using reflectance in the optical domain, Remote Sen. Env. 77, 22-33.
- Chuvieco, E., and Martin, M. P.: 1994, Global fire mapping and fire danger estimation using AVHRR images, Photogram. Eng. Remote Sens. 60(5), 563-570.
- Chuvieco, E., Salas, F.J., Carvacho, L., and Rodirguez-Silva, F.: 1999a, Integrated fire risk mapping, In: Remote Sensing of Large Wildfires in the EuropeanMediterranean Basin (E. Chuvieco Ed.), Berlin: Springer-Verlag, pp. 61-84.
- Chuvieco, E., Deshayes, M., Stach, N., Cocero, D., and Riaño, D.: 1999b, Short-term fire risk: foliage moisture content estimation from satellite data. In: Remote Sensing of Large Wildfires in the European Mediterranean Basin (E. Chuvieco Ed.), Berlin: Springer-Verlag, pp. 17-38.
- Chuvieco, E., Aguado, I., Cocero, D. And Riaño, D.: 2003, Design of an empirical index to estimate fuel moisture content from NOAA-AVHRR analysis in forest fire danger studies, . Int. J. Remote Sens. 24(8), 1621-1637.
- Deblonde, G., and Cihlar, J.: 1993, A multiyear analysis of the relatonsip between surface environmental variables and NDVI over the Canadian landmass, Remote Sens. Rev. 7: 151-177.
- Desbois, N., and Vidal, A.: 1995, La télédétection dans la prévision des incendies de forêt, Ingénieries- EAT 1, 21-29.
- Desbois, N., and Vidal, A.: 1996, Real-time monitoring of vegetation flammability using NOAA-AVHRR thermal infrared data, EARSeL Adv. Remote Sens. 4(4), 25-32.
- Dominguez, L., Lee, B.S., Chuvieco, E., and Cihlar, J.: 1994, Fire danger estimation using AVHRR images in the Prairie provinces of Canada. In: Proc. 2nd Int. Conf. on Forest Fire Research, Coimbra, Portugal, 2(17), 679-690.
- Duchemin, B., Guyon, D., and Lagouarde, J. P.: 1999, Potential and limits of NOAA-AVHRR temporal composite data for phenology and water stress monitoring of temperate forest ecosystems, Int. J. Remote. Sens. 20(5), 895-917.
- Gouyet, J.F., King, C., Le Gleau, H., Malon, J.F., Phulpin, T., and Valette, J.C.: 1991, Apport des données satellitaires NOAA-AVHRR dans le suivi de la végétation forestière, In: Proc. 5th Int. Coll. on Physical Measurements and Signatures in Remote Sensing, Courchevel, France, pp. 625-629.
- Goward, S.N., Waring, R.H., Dye, D.G., and Yang, J.: 1994, Ecological remote sensing of OTTER satellite macroscale observations, Ecol. Appl. 4(2), 322-343.
- Granger, R.J.: 1997, Comparison of surface and satellite-derived estimates of evapotranspiration using a feedback algorithm, In: Proc. 3rd Int. Workshop on Application of Remote Sensing in Hydrology, Greenbelt, Maryland, pp. 71-81.
- Hardy, C.C., and Burgan, R.E.: 1999, Evaluation of NDVI for monitoring live moisture in three vegetation types of the Western U.S., Photogram. Eng. Remote Sens. 65, 603-610.
- Illera, P., Fernandez, A. and Delgado, J.A.: 1996, Temporal evolution of the NDVI as an indicator of forest fire danger, Int. J. Remote. Sens. 17(6), 1093-1105.
- Kogan, F.N.: 2001, Operational space technology for global vegetation assessment, Bull. Am. Meteo. Soc. 82(9), 1949-1964.
- Leblon, B.: 2005. Using remote sensing for fire danger monitoring, Natural Hazards, 35: 343-359.
- Leblon, B.: 2007. Radar polarimetry, On-line course, 7 chapters, http://webct.unb.ca.
- Leblon, B., Chen, J., Alexander, M.E., White, S.: 2001. Fire danger monitoring using NOAA-AVHRR NDVI images in the case of northern boreal forests, Int. J. Remote Sens. 22(14), 2839-2846.
- Leblon, B., Kaschike, E.S., Alexander, M.E., Doyle, M, and Abbott M.: 2002, Fire danger monitoring using ERS-1 SAR images over northern boreal forests, Natural Hazards 27, 231-255
- Leblon, B., Fernandez-Garcia, P.A., Oldford, S. MacLean, D., and Flannigan, M.: 2007. Using NOAA-AVHRR cumulative indices for estimating fire danger codes in northern boreal forests, Int. J. Appl. Earth Obs. and Geoinformation, 9: 335-342.
- Lopez, S., Gonzalez, F., Llop, R., and Cuevas, J.M.: 1991, An evaluation of the utility of NOAA-AVHRR images for monitoring forest fire risk in Spain, Int. J. Remote. Sens. 12(9), 1841-1851.
- Moran, M.S., Vidal, A., Troufleau, D., Qi, J., Clarke, T.R., Pinter, P.J., Jr., Mitchell, T.A., Inoue, Y., and Neale, C.M.U.: 1997, Combining multifrequency microwave and optical data for crop management Remote Sens. Environ., 61, 96-109.
- Nemani, R.R., and Running, S.W.: 1989, Estimation of regional surface resistance to evapotranspiration from NDVI and thermal-IR AVHRR data, J. Appl. Meteo. 28(4), 276-284.
- Oldford, S., Leblon, B., Gallant, L., et Alexander, M., 2003. Mapping pre-fire conditions in the Northwest Territories, Canada, using NOAA-AVHRR images, Géocarto Int. 18(4): 21-32.
- Oldford, S., Leblon, B., MacLean, D., and Flannigan, M.: 2006. Predicting slow drying fuel moisture codes using NOAA-AVHRR images, Int. J. Remote Sens. 27(18): 3881-3902.
- Olioso, A., Chauki, H., Courault, D., Wigneron, J.P.: 1999,. Estimation of evapotranspiration and photosynthesis by assimilation of remote sensing data into SVAT models, Remote Sens. Environ. 68, 341-356.
- Paltridge, G.W., and Barber, J.: 1988, Monitoring grassland dryness and fire potential in Australia with NOAA-AVHRR data, Remote Sens. Environ. 25, 381-394.
- Pierce, L.L., Running, S. W., and Riggs, G.A.: 1990, Remote detection of canopy water stress in coniferous forests using the NS001 Thematic Mapper Simulator and the Thermal Infrared Multispectral Scanner, Photogram. Eng. Remote Sens., 56(5), 579-586.
- Pinol, J., Filella, I., Ogaya, R., and Penuelas, J.: 1998, Ground-based spectroradiometric estimation of live fine fuel moisture of Mediterranean plants, Agri. For. Meteo. 90, 173-186.
- Prosper-Laget, V., Douguedroit, A., and Guinot, J.P.: 1994, A satellite index of forest fire occurence risk in summer in the Mediterranean area, In: Proc. 2nd Int. Conf. on Forest Fire Research, Coimbra, Portugal, vol. 2, pp. 637-646.
- Prosper-Laget, V., Wigneron, J.P., Guinot, J.P., and Seguin, B.: 1995, Utilisation du satellite NOAA pour la détection des risques d'incendies de forêts, La Météorologie 8(10), 28-38.
- Saatchi, S.S., van Zyl, J., and Asrar, G.: 1995, Estimation of canopy water content in Konza Prairie grasslands using synthetic aperture radar measurements during FIFE, J. Geophys. Res. 100(D12), 25481-25496.
- Strickland, G., Leblon, B., Gallant, L., and Alexander, M.E.: 2001, Monitoring fire danger of northern boreal forests from optical and thermal infrared NOAA-AVHRR images, In: Proc. 23th Can. Remote Sens. Symp., Ste-Foy, Canada, pp. 667-676.
- Teillet, P.M., Dudelzak, A.E., Pultz, T.J., McNairn, H., and Chichagov, A.: 2001, A framework for in-situ sensor measurement assimilation in remote sensing applications, In: Proc. 23th Can. Remote Sens. Symp., Ste-Foy, Canada, pp. 111-118.
- Ustin, S., Roberts, D.A., Pinzon, J., Jacquemoud, S., Gardner, M., Scheer, G., Castaneda, C.M., and Palacios-Orueta, A.: 1998, Estimating canopy water content of chaparral shrubs using optical methods, Remote Sens. Environ. 65, 280-291.
- Vidal, A. and Devaux-Ros, C.: 1995, Evaluating forest fire hazard with a Landsat TM derived water stress index, Agric. For. Meteo. 77, 207-224.
- Vidal, A., Pinglo, F., Durand, H., Devaux-Ros, C. and Maillet, A.: 1994, Evaluation of a temporal fire risk index in Mediterranean forests from NOAA thermal IR, Remote Sens. Environ. 49, 296-303.