Metal stocks in use in the United States
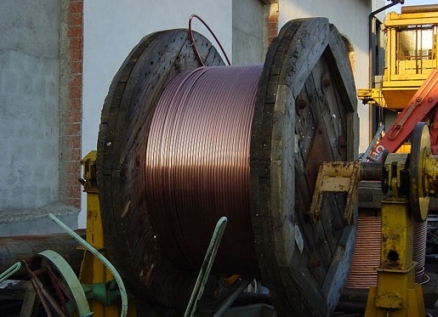
Industrial roll of copper tubing. Source: Giovanni Dall'Orto
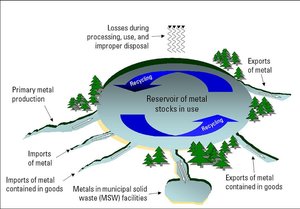 Figure 1: A reservoir with streams flowing into and out of it helps illustrate the concept of stocks in use. Figure not drawn to scale. (Source: USGS)
 Metal stocks in use in the USA involve large quantities of metals over the last century. Most of these metals have remained in use either in their original form or in new products produced from recycled metal. These metals serve important functions and are contained in automobiles, bridges, buildings, machinery, and many other applications. The accumulated quantities of metals in use may be referred to as “resources in place” or, more commonly, as stocks in use.
Stocks in use
Stocks-in-use data are used to examine an aspect of a commodity’s availability and use that is not usually considered in mineral and material analysis. This information can be used by government agencies, international agencies, educational institutions, environmental organizations, private companies, and the general public to assess the current and future availability and disposition of minerals and materials. The U.S. Geological Survey (USGS) has developed estimates of the quantity of aluminum, copper, and steel in use in the United States (table 1). The stocks-in-use concept is analogous to a reservoir of water (fig. 1). Streams feeding the reservoir include domestic primary metal originating from mines, imports of metal, and metal contained in imported goods. Recycled metal remains in the reservoir. Streams flowing out of (and thereby draining) the reservoir include exports of metal, metal contained in exported goods, and metal discarded in a municipal solid waste (MSW) facility. Other losses (or dissipation) from the reservoir, akin to evaporation, occur during metal processing, through wear and tear during use, and through improper disposal.
| Table 1: Distribution of estimated stocks of selected metals in the United States in the year 20021 Units in million metric tons (Mt). MSW, Municipal solid waste | ||
| Commodity |
excluding MSW2 facilities |
Cumulative stocks in MSW facilities |
| Aluminum | 142 | 61.1 |
| Copper | 117 | 14.7 |
| Steel | 4,130 | 835 |
| 1Sources: U.S. Environmental Protection Agency, 2001; Kelly and others, 2002; U.S. Department of Commerce, 2003; Council of Economic Advisors, 2004; and D.E. Sullivan, U.S. Geological Survey unpub. data, 2004. | ||
Recycling perspective
The metal contained in a final product may be recycled at the end of the product’s useful life. When this happens, the metal remains in the reservoir of metals in use. When metal is not recycled, it usually ends up in MSW facilities. Metal in MSW facilities are generally not recovered. If they were to be recovered they would then be part of the reservoir of metals in use. Residing in the MSW facility, they are potentially available for future use.
Recycling reduces the outflow from the reservoir, especially to MSW facilities, by retaining the metal within the reservoir. Once the metals flow into the MSW facilities, they are more difficult and costly to recover. However, with changes in technology and other market characteristics, this metal may one day be returned to the reservoir of metals in use.
Data for these and all other major metals and minerals are also available from the USGS as part of a publicly available report on historical statistics for mineral commodities in the United States. This comprehensive series provides data on the production, trade, and use of minerals and materials as far back as 1900 through 2002. Data from the above USGS report along with data from the U.S. Department of Commerce (2003), the Council of Economic Advisers (2004), and the U.S. Environmental Protection Agency (2001) were used to develop these estimates of stocks of metal in use.
Hypothetical comparisons may help put these data into perspective. If all of the estimated 142 million metric tons (Mt) of aluminum in use (in transportation, packaging, buildings, consumer durables, electrical products, and other products) was converted to typical aluminum 12-ounce soft-drink cans and they were stacked end to end, then they would reach from the Earth to the Sun (150 million kilometers) and back for than four times. The estimated 61.1 Mt of aluminum in MSW facilities would make the same trip almost two times.
Size comparisons
If all the estimated 117 Mt of copper in use (in buildings, electric and electronic products, transportation equipment, industrial machinery and equipment, and other products) was converted to a common household electrical wire, such as size American Wire Gauge 14, and then wrapped around the Equator (40,000 kilometers), then the wire would circle the Earth almost 158,000 times. If the same were done to all estimated 14.7 Mt of copper in MSW facilities, then the wire would circle the Earth almost 20,000 times.
The estimated 4.13 billion metric tons of steel in use (transportation, construction, cans and containers, and other goods) is roughly equivalent to 55,000 times the amount of steel found in the Golden Gate Bridge in California. The estimated 835 Mt of steel in MSW facilities is roughly equivalent to 11,000 times the amount in the bridge.
Further reading
- Aluminum Association, Inc., 2002. Packaging can news: Aluminum beverage can continues to be the most recycled consumer beverage package (Washington, D.C., Aluminum Association, Inc.,) available only online. (Accessed November 29, 2004.)
- Council of Economic Advisers, 2004, Economic report of the President: Washington D.C., Council of Economic Advisers, 417 p.
- Kelly, T.D., Buckingham, D.A., DiFrancesco, C.A., Porter, K.P., Goonan, T.G., Sznopek, J.L., Berry, C., and Crane, M., 2002. Historical statistics for mineral commodities in the United States: U.S. Geological Survey Open-File Report 01-006, available only online. (Accessed December 2, 2004.)
- Kuphaldt, T.R., 2004. All about circuits: Available only online. (Accessed December 2, 2004.)
- Malloy, Betsy, 2004. Western U.S. for visitors, Golden Gate Bridge facts: Francisco, Calif., About.com, available only online. (Accessed November 29, 2004.)
- U.S. Department of Commerce, Bureau of Economic Analysis, 2003. gov/bea/dn/2003benchmark/cr2003content.htm National Economic Accounts: U.S. Department of Commerce, Bureau of Economic Analysis Web site. (Accessed January 14, 2005.)
- U.S. Environmental Protection Agency, 2001. Municipal solid waste in the United States; 2001 facts and figures: U.S. Environmental Protection Agency Web site. (Accessed December 15, 2004.)