Mauna Loa curve

Contents
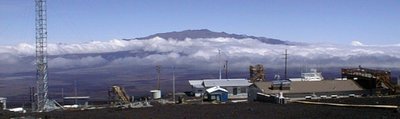
Introduction World map indicating the location of Mauna Loa. (Source: NOAA (Mauna Loa curve) )
Since 1958, the concentration of carbon dioxide (CO2) in the atmosphere has been measured daily at Mauna Loa Observatory, Hawaii (19°32' N, 155°35' W). Mauna Loa Observatory is located on the Island of Hawaii at an elevation of 3,397 meters above mean sea level) on the northern flank of Mauna Loa volcano. Established in 1957, Mauna Lao Observatory has grown to become the premier long-term atmospheric monitoring facility on Earth and is the site where the ever-increasing concentrations of global atmospheric CO2 were determined. The observatory consists of 10 buildings from which up to 250 different atmospheric parameters are measured by scientists and engineers.
This air is relatively free from local pollutants, and so is thought to be representative of air in the northern hemisphere. CO2 measurements at Mauna Loa show two movements. Since 1958, there has been a general increase in the atmospheric concentration of CO2 due to the combustion of fossil fuels and deforestation. The data also show an annual cycle. Each year, the concentration of CO2 rises and falls. The curve is also known as the "Keeling curve", named for Charles D. Keeling (1928-2005), an American pioneer in the monitoring of carbon dioxide concentrations in the atmosphere.
Methods
 The Mauna Loa Observatory. (Source: NOAA)
 Air samples at Mauna Loa are collected continuously from air intakes at the top of four 7-meter towers and one 27-m tower. Four air samples are collected each hour for the purpose of determining the CO2 concentration. Determinations of carbon dioxide (CO2) are made by using a Siemens Ultramat 3 nondispersive infrared gas analyzer with a water vapor freeze trap. This analyzer registers the concentration of CO2 in a stream of air flowing at ~0.5 L/min. Every 30 minutes, the flow is replaced by a stream of calibrating gas or "working reference gas". In December 1983, CO2-in-N2 calibration gases were replaced with the currently used CO2-in-air calibration gases. These calibration gases and other reference gases are compared periodically to determine the instrument sensitivity and to check for possible contamination in the air-handling system. These reference gases are themselves calibrated against specific standard gases whose CO2 concentrations are determined manometrically.
Hourly averages of atmospheric CO2 concentration, wind speed, and wind direction are plotted as a basis for selecting data for further processing. Data are selected for periods of steady hourly data to within ~0.5 parts per million by volume (ppmv); at least six consecutive hours of steady data are required to form a daily average.
Long-run trend in atmospheric CO2
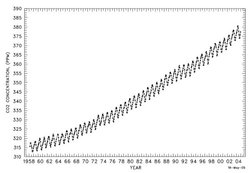 The Mauna Loa curve. (Source: Keeling, C.D. and T.P. Whorf. 2005. Atmospheric CO2 records from sites in the SIO air sampling network. In Trends: A Compendium of Data on Global Change. Carbon Dioxide Information Analysis Center, Oak Ridge National Laboratory, U.S. Department of Energy, Oak Ridge, Tenn., U.S.A.)
 The Mauna Loa atmospheric CO2 measurements constitute the longest continuous record of atmospheric CO2 concentrations available in the world. The Mauna Loa site is considered one of the most favorable locations for measuring undisturbed air because possible local influences of vegetation or human activities on atmospheric CO2 concentrations are minimal and any influences from volcanic vents may be excluded from the records. The methods and equipment used to obtain these measurements have remained essentially unchanged during the 47-year monitoring program.
Because of the favorable site location, continuous monitoring, and careful selection and scrutiny of the data, the Mauna Loa record is considered to be a precise record and a reliable indicator of the regional trend in the concentrations of atmospheric CO2 in the middle layers of the troposphere. The Mauna Loa record shows a 19.4% increase in the mean annual concentration, from 315.98 parts per million by volume (ppmv) of dry air in 1959 to 377.38 ppmv in 2004. The 1997-1998 increase in the annual growth rate of 2.87 ppmv represents the largest single yearly jump since the Mauna Loa record began in 1958. This represents an average annual increase of 1.4 ppmv per year. This is smaller than the average annual increase at the other stations because of the longer record and inclusion of earlier (smaller) annual increases.
Seasonal trends in atmospheric CO2
The "wiggles" in the Mauna Loa curve reflect seasonal differences in carbon flows between the atmosphere and the biota. Two flows connect the atmosphere and biota. Photosynthesis moves carbon from the atmosphere to the biota. Respiration moves carbon from the biota to the atmosphere. To generate an annual cycle, photosynthesis must vary relative to respiration in a regular pattern. For some portion of the year, photosynthesis must be greater than respiration. During this period, there is a net flow of carbon from the atmosphere to the biota and the atmospheric concentration of carbon dioxide declines. At other times of the year, respiration must be greater than photosynthesis. During this period, there is a net flow of carbon from the biota to the atmosphere and the atmospheric concentration of carbon dioxide increases. What causes these regular changes in photosynthesis and respiration?
Many plants in temperate latitudes are either annuals or deciduous. Deciduous trees drop their leaves in the fall or during the dry season. Similarly, annual plants die during the fall and winter. The dead leaves and plants decay. As they decay, their carbon is returned back to the atmosphere. The flow of carbon to the atmosphere via respiration is larger than photosynthesis, and as a result, the atmospheric concentration of carbon dioxide increases through the fall, winter and into early spring.
In late spring and summer, this process is reversed. The seeds of annuals grow, deciduous trees regenerate their leaves, and photosynthetic rates in evergreens increase. Under these conditions, photosynthesis increases relative to respiration, and there is a net flow of carbon from the atmosphere to the biota. As a result, the atmospheric concentration of carbon dioxide decreases during the late spring and summer.
But this still does not explain the cycle. The seasons in the northern and southern hemisphere are out of phase. That is, when it is spring in the northern hemisphere it is fall in the southern hemisphere and vice-versa. Because there is some exchange of atmospheric CO2 between hemispheres, why doesn’t the spring-summer increase in photosynthesis in one hemisphere cancel the fall-winter increase in respiration in the other hemisphere? Equally important, does the peak in the annual cycle of atmospheric concentration of carbon dioxide occur in the early spring of the northern hemisphere or in the early spring of the southern hemisphere?
To answer these questions, one needs to remember the Mauna Loa is in the northern hemisphere and hence largely reflects conditions in the northern hemisphere. In addition, there are important differences between hemispheres regarding the ratio of land to water. The ratio of land to water is much greater in the northern hemisphere, which implies that the northern hemisphere has more land than the southern hemisphere. This difference is even greater in the temperate latitudes—most of the land in the southern hemisphere is in the tropics.
The difference in land area implies that the trough (the low point) in the annual cycle of atmospheric CO2 is determined by the growing season in the northern hemisphere. Because of the differences in land area, the rate of net primary production during the northern hemisphere growing season is greater than the amount of carbon returned to the atmosphere via the decay of biota in the southern hemisphere. Even if there were a complete exchange of CO2 between hemispheres (but there isn’t), the trough in the annual cycle of atmospheric carbon dioxide occurs during September.
Scientists use the annual cycle in an attempt to measure changes in biota in temperate latitudes. Scientists cannot balance the carbon cycle. Some scientists postulate that the increased concentration of carbon dioxide and/or higher temperatures stimulates photosynthesis, and this increase accounts for some of the “missing carbon.” If increased concentrations of atmospheric CO2 increase the biota in the temperate latitudes, the amplitude (the change from peak to trough) of the cycle may also increase. That is, there may be more biota regrowing each spring and decaying each fall. Several scientists have looked for a change in the amplitude of the cycle, but these analyses do not provide conclusive evidence for an increase in northern hemisphere biota.
Further reading
- Mauna Loa Observatory web site at NOAA.
- The Influence of Mauna Loa Observatory on the Development of Atmospheric C02 Research, C. D. Keeling, Scripps Institution of Oceanography, University of California at San Diego
1 Comment
Suzie Dsouza wrote: 02-28-2011 22:26:12
Mauna Loa's surface is is covered by lavas less than 4000 years old, while about 50% of its surface is covered by lavas no older than about 1500 years old, while about 25% are covered by lava flows younger than about 750 years, i.,e. em-placed after the formation of the Mokuaweoweo summit caldera. http://www.whatisguide.net/0214-famous-volcanoes.html