Long-term change and variability in ozone levels in the Arctic
This is Section 5.3 of the Arctic Climate Impact Assessment.
Lead Authors: Vladimir M. Kattsov, Erland Källén; Contributing Authors: Howard Cattle, Jens Christensen, Helge Drange, Inger Hanssen-Bauer,Tómas Jóhannesen, Igor Karol, Jouni Räisänen, Gunilla Svensson, Stanislav Vavulin; Consulting Authors: Deliang Chen, Igor Polyakov, Annette Rinke
In the early 1970s, scientists began projecting that anthropogenic emissions of CFCs and other halocarbons would lead to stratospheric ozone depletion[1]. These projections were confirmed when the Antarctic ozone hole was discovered in 1985[2], and subsequent work[3] identified and refined the chemical mechanisms that are responsible for ozone depletion. Since that time, decreases in stratospheric and total column ozone have been reported over both poles and in the mid-latitudes in both hemispheres.
Contents
Monitoring Stratospheric Ozone Over the Arctic (5.3.1)
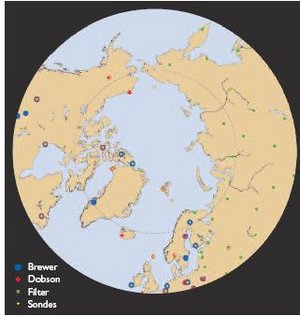
 Fig. 5.3. Regularly reporting total column ozone and ozonesonde stations in and near the Arctic. (Source: ACIA)
 Ground-based and satellite-borne instruments are used to monitor the concentrations and vertical distributions of stratospheric ozone. Ground-based Dobson spectroradiometers have been used since the 1920s, and Brewer spectroradiometers have been introduced more recently to provide both ozone and UV radiation monitoring. Currently, more than 30 Dobson and Brewer instruments are operated in or near the Arctic. In Russia, total ozone is monitored using filter radiometers. In addition to these measurements of total column ozone, the vertical ozone distribution or ozone profile can be measured using ozonesondes (balloon-borne measuring devices). Figure 5.3 shows the current network of regularly reporting total ozone and ozonesonde stations in or near the Arctic. The ground-based monitoring network provides the longest and most accurate record of stratospheric ozone levels. In addition to ground-based monitoring, various satellite-borne instruments have been in orbit since the 1970s and are able to provide global spatial coverage not available from ground-based networks. Because the ground-based monitoring network does not cover all parts of the Arctic, monitoring arctic ozone levels relies on a combination of ground-based and satellite-borne instruments.
Total Column Ozone on a Global Scale (5.3.2)
Total column ozone is a measure of the total number of ozone molecules in a column of atmosphere above a particular location. Total column ozone is important because of its direct, measurable effect on the amount of UV radiation reaching the surface. The variability in total column ozone at a single location is strongly influenced by the movement of air from one region to another. Thus, total column ozone averages over the entire globe, or over large regions, often show less variability than total column ozone at a specific location[4]. Although ozone measurements have been made by satellite-borne instruments since the late 1970s, orbits and instrument capabilities have not always ensured year-round monitoring of conditions in the arctic stratosphere.
Instrument drift, problems with calibration, and other issues influencing data continuity can all affect estimates of ozone levels derived from satellite data. Careful comparison with well-calibrated ground-based instruments has helped resolve many of these difficulties, and the satellite data have been used in many analyses of ozone depletion[5]. The results indicate strong downward trends in stratospheric ozone amounts, particularly during the late winter and spring. The data show strong latitudinal variability as well as observable longitudinal variations.
Several datasets of zonal total column ozone values were compared and used to estimate long-term changes in total column ozone. The datasets were prepared by different groups and are based on TOMS, Solar Backscatter Ultraviolet (SBUV, SBUV/2), Global Ozone Monitoring Experiment, and ground-based measurements[6]. To avoid problems of missing data at high latitudes, and to estimate global total ozone, it was assumed that deviations from the long-term mean over [[region]s] with no data (such as over the poles) were the same as the deviations in the surrounding latitude belts. The results suggest that global average total column ozone in the late 1990s was 3% lower than in the late 1970s.
Total Column Ozone Trends (5.3.3)
The decline in total column ozone is a function of the solar cycle, atmospheric dynamics, chemistry, and temperatures. In general, the agreement between the long-term trends in total column ozone obtained from satellite and ground-based data is very good: both indicate a latitudinal variation in the trends, with values close to zero over the equator and substantial declines outside the 35º S to 35º N zone.
Satellite data indicate that variations in the total column ozone trends are predominantly latitudinal, with some smaller longitudinal differences. The greatest decrease in total column ozone over the Northern Hemisphere high latitudes (7% per decade) occurred in the spring (March–May) over the subpolar [[region]s] of Siberia, northern Europe, and the Canadian Arctic. These longitudinal differences correspond at least partially to large relative decreases during the winter and spring, which occur when air masses with relatively low ozone concentrations typical of the polar vortex are transported over regions with high climatological ozone values. In these situations, the decrease in total column ozone is not limited to the polar vortex area alone[7]. Unlike the winter and spring depletion, the summer and autumn decrease in total column ozone over the Northern Hemisphere has been smaller and more uniform with longitude.
Variations in Arctic Total Column Ozone (5.3.4)
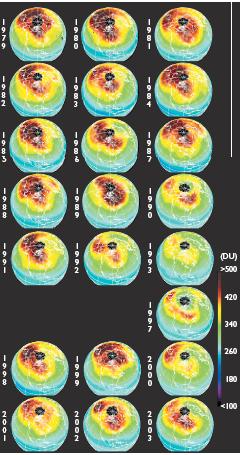
 Fig. 5.4. March total column ozone (monthly mean) from 1979 to 2003, from the merged TOMS+SBUV dataset (NASA Goddard Space Flight Center, 2004). (Source: ACIA)
 Variations and trends in total column ozone over the Arctic are similar to those over mid-latitudes. However, a strong polar vortex in late winter and early spring leads to an additional decrease in total column ozone. Extremely large decreases in total column ozone over the Arctic were observed in certain years, for example, in 1993 and 1997 (Fig. 5.4), which have been partly attributed to a strong polar vortex during those years. Because of the large interannual variability in the strength of the vortex, ozone decreases in the late 1990s and early 2000s were not as large. Decreases in total column ozone associated with the polar vortex can be as large as 45% over vast areas and can last longer than two weeks[8]. These traits make vortex-related decreases different from local anomalies or mini-holes, which are caused by advections of tropical and polar air into the mid-latitudes. Mini-holes can be as deep as 35 to 40%, but last only a few days[9].
The trend in mean annual total column ozone over the Arctic was approximately -3% per decade for the period from 1979 to 2000 (a total decrease of about 7%). Trends depend on season; the trend in mean spring total column ozone was approximately -5% per decade for the period from 1979 to 2000 (a total decrease of 11%). Large mean monthly decreases in total column ozone (30–35% below pre-depletion levels) were reported in March 1996 and 1997. Some of the daily total column ozone values during these months were below 270 Dobson units (DU), or 40 to 45% below pre-depletion levels.
Ozone Profiles (5.3.5)
The vertical distribution of ozone within the column plays a lesser role than the total column ozone in determining surface UV radiation levels. At the present time, approximately 20 stations measure vertical ozone profiles during the winter and spring. Measurements of the vertical profile of ozone concentration using ozonesondes have been made weekly since 1980 at several sites in Canada (Edmonton, Goose Bay, Churchill, and Resolute), since 1987 at Alert, and since 1992 at Eureka. Ozone soundings are also performed regularly at Sodankylä, Finland; Ny Ålesund, Norway; Scoresbysund and Thule, Greenland; and Yakutsk, Russia; and occasionally at Bear Island, Norway. In 1988, Europe, Canada, and Russia coordinated an ozonesonde network to measure ozone amounts within the polar vortex.The network consists of 19 stations and has provided assessments of chemical ozone loss for almost every winter since 1988–1989[10]. Preliminary analysis of the profiles suggests that trends in ozone concentrations as a function of altitude are most significant in the lower and middle stratosphere, at pressure altitudes of approximately 100 to 25 hectopascals (hPa).
Chapter 5: Ozone and Ultraviolet Radiation
5.1. Introduction (Long-term change and variability in ozone levels in the Arctic)
5.2. Factors affecting arctic ozone variability
5.3. Long-term change and variability in ozone levels
5.4. Factors affecting surface ultraviolet radiation levels in the Arctic
5.5. Long-term change and variability in surface UV irradiance
5.6. Future changes in ozone
5.7. Future changes in ultraviolet radiation
5.8. Ozone and Ultraviolet Radiation in the Arctic: Gaps in knowledge, future research, and observational needs
References
Citation
Cleveland, C., & Committee, I. (2012). Long-term change and variability in ozone levels in the Arctic. Retrieved from http://editors.eol.org/eoearth/wiki/Long-term_change_and_variability_in_ozone_levels_in_the_Arctic- ↑ Molina, M.J. and F.S. Rowland, 1974. Stratospheric sink for chlorofluoromethanes: chlorine atom-catalysed destruction of ozone. Nature, 249(5460):810–812.
- ↑ Farman, J.C., B.G. Gardiner and J.D. Shanklin, 1985. Large losses of total ozone in Antarctica reveal seasonal ClOx/NOx Interaction. Nature, 315:207–210.
- ↑ Anderson, J.G., W.H. Brune and M.H. Proffitt, 1989. Ozone destruction by chlorine radicals within the Antarctic vortex – the spatial and temporal evolution of ClO-O3 anticorrelation based on in situ ER-2 data. Journal of Geophysical Research, 94(D9):11465–11479.
- ↑ Bodeker, G.E., J.C. Scott, K. Kreher and R.L. McKenzie, 2001. Global ozone trends in potential vorticity coordinates using TOMS and GOME intercompared against the Dobson network. Journal of Geophysical Research, 106(D19):23029–23042.
- ↑ Herman, J.R. and D. Larko, 1994. Low ozone amounts during 1992 and 1993 from Nimbus 7 and Meteor 3 total ozone mapping spectrometers. Journal of Geophysical Research, 99:3483–3496.-- McPeters, R.D., P.K. Bhartia, A.J. Krueger, J.R. Herman, B.M. Schlesinger, C.G. Wellemeyer, C.J. Seftor, G. Jaross, S.L. Taylor, T. Swissler, O. Torres, G. Labow, W. Byerly and R.P. Cebula, 1996. Total Ozone Mapping Spectrometer (TOMS) Data Products User’s Guide. NASA Ref. Publ. No 1384.-- Newman, P., J. Gleason, R. McPeters and R. Stolarski, 1997. Anomalously low ozone over the Arctic, Geophysical Research Letters, 24:2689–2692.-- Reinsel, G.C., G.C. Tiao, D.J. Wuebbles, J.B. Kerr, A.J. Miller, R.M. Nagatani, L. Bishop and L.H. Ying, 1994. Seasonal trend analysis of published ground-based and TOMS total ozone data through 1991. Journal of Geophysical Research, 99:5449–5464.-- Staehelin, J., J. Mader, A.K. Weiss and C. Appenzeller, 2002. Longterm trends in Northern mid-latitudes with special emphasis on the contribution of changes in dynamics. Physics and Chemistry of the Earth, 27(6–8):461–469-- Weatherhead, E.C., G.C. Reinsel, G.C. Tiao, C.H. Jackman, L. Bishop, S.M. Hollandsworth Frith, J. DeLuisi, T. Keller, S.J. Oltmans, E.L. Fleming, D.J. Wuebbles, J.B. Kerr, A.J. Miller, J. Herman, R. McPeters, R.M. Nagatani and J.E. Frederick, 2000. Detecting the recovery of total column ozone. Journal of Geophysical Research, 105:22201–22210.
- ↑ Fioletov, V.E., J.B. Kerr, D.I. Wardle, N. Krotkov and J.R. Herman, 2002. Comparison of Brewer UV irradiance measurements with TOMS satellite retrievals. Optical Engineering, 41(12):3051–3061.
- ↑ WMO, 1999. Scientific Assessment of Ozone Depletion: 1998. WMO Ozone Report 44, World Meteorological Organization.-- WMO, 2003. Scientific Assessment of Ozone Depletion: 2002. Global Ozone Research and Monitoring Project – Report No. 47. World Meteorological Organization Geneva, 498pp.
- ↑ Weatherhead, E.C. (Ed.), 1998. Climate change, ozone, and ultraviolet radiation. In: AMAP Assessment Report: Arctic Pollution Issues, pp. 717–774. Arctic Monitoring and Assessment Programme, Oslo.
- ↑ Weatherhead, E.C. (Ed.), 1998. Climate change, ozone, and ultraviolet radiation. In: AMAP Assessment Report: Arctic Pollution Issues, pp. 717–774. Arctic Monitoring and Assessment Programme, Oslo.
- ↑ Rex, M., R.J. Salawitch, N.R.P. Harris (plus 61 others), 2002. Chemical loss of Arctic ozone. Journal of Geophysical Research, 107(D20): doi:10.1029/2001JD000533.