Impact of ozone on health and vegetation
Contents
Increasing Ozone Concentrations Cause Environmental Problems
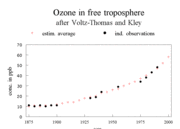 Figure 1. Ozone concentrations in Europe since 1870
 Everywhere where economic development has led to the increased use of fossil fuel for industry, electricity generation, or transport, ambient concentration of ozone has risen. This is due to the increased emissions of nitrogen oxides and volatile organic compounds (VOCs) leading to the formation of ozone.
This process started in the U.S. around 1960 and was observed in Europe a decade later. Ozone pollution is now becoming a pressing dilemma in rapidly developing countries, such as China, and in mega-cities such as Mexico City, Bombay, and Beijing. The history of ozone concentrations in Europe is given in Figure 1.
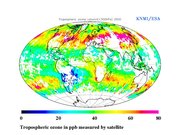 Figure 2. Ozone measured by satellites in summer 2005
 Some materials are very sensitive to ozone. Natural rubber is a good example. Ozone attacks the carbon double bonds in the polymers, which make up natural rubber. The sensitivity of rubber to ozone, and the high cost of natural rubber in the nineteenth and early twentieth centuries, prompted the monitoring of ozone concentrations, as reported in the historic development of ozone concentrations. For more information, see Impacts of air pollution on local to global scale. If it is kept in mind that problems with vegetation start at 40 parts per billion (ppb), it is clear that troubles were starting after 1970.
Currently (2006), satellites measure the concentration of ozone, and some results are given in Figure 2. High ozone levels are observed over Europe and the U.S. and intercontinental transport due to prevailing western winds can be seen.
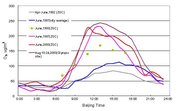 Figure 3. Daily ozone levels in Beijing from 1982 to 2003
 The elevated ozone concentrations in the developed countries are mainly due to emissions of nitrogen oxide and volatile organics from the transportation sector (responsible for 60 to 70% of the NOx emissions in Europe).
In the period 1982 to 2003, the ozone concentrations in Beijing, China increased from a daily maximum of about 80 ?g*m-3 to about 250 ?g*m-3. At this level, serious effects on human health as well as on vegetation, including agricultural crops, can be observed.
In Beijing, both stationary sources (industry and electricity generation plants) and transportation emit comparable amounts of NOx, but the immense increase of NOx indicates larger contributions from transportation, as happened in the U.S. and Europe.
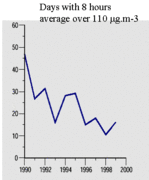 Figure 4. Effect of NOx abatement measures on transgression of European air quality standards in the Netherlands
 With a lifetime of weeks in the free troposphere, (the troposphere outside the planetary boundary layer or mixing layer), ozone can be transported over rather large distances. There are indications that about 5% of the ozone in Europe was originally produced in the U.S., and that a small fraction of the ozone in the U.S. was formed in China. One factor that favors long-range transport of ozone is the fact that ozone is not very soluble in water, so deposition over the oceans is quite low.
Measures like the large-scale application of automobile exhaust catalysts, and low-NOx burners in industry and in electricity plants, and, in the Netherlands, even in household central heating burners, have had a clear effect on reducing ozone concentrations in Europe. The reduction in number of days with more than 110 ?g*m-3 (that is, days exceeding the human health air quality standard) can be seen in Figure 4. Even though the number of vehicles and the distance traveled per vehicle per year have grown considerably, NOx concentrations have gone down and, correspondingly, so have ambient ozone concentrations.
The effect of better engine designs, reformulations of fuels, and the application of catalysts and low-NOx burners has been clearly demonstrated. The cost of these measures is, however, considerable. For a small country like the Netherlands, it is in the order of one billion U.S. dollars per year.
Effects of Ozone on Human Health
Studies in the laboratory as well as investigations under ambient conditions have clearly indicated that ozone negatively impacts human health. Children, elderly people, and those with chronic respiratory diseases are more sensitive to ozone than the general population.
Epidemiological research indicates that the effects of ozone on human health vary from respiratory system complications (complaints regarding increased resistance in the respiratory system, and bronchitis and related diseases) to increased mortality at exposure to higher doses of ozone.
The exact mechanism of the impact of ozone on human health is not known. A possible mechanism could be that ozone is deposited on the water layer on the cells inside the lungs. In this film, it decomposes, releasing O2 and a number of free radicals and ions (e.g., HO2?, HO+, OH?, and O2?). These radicals may, in turn, affect enzymes in the cell or components of cell membranes, such as SH groups, amino acids, and fatty acids.
These effects of ozone are connected with chronic exposure to elevated concentrations as well as to high peak values. In the U.S. and Europe, ozone is perceived as a significant threat to human health, probably second only to fine particulate matter. As a result, specific air quality standards have been established to regulate this environmental hazard (see Table 1 for the E.U. standards).
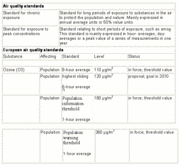 Table 1. European Union ozone standards for human health protection
 The standards are clearly focused on peak concentrations. The alarm threshold at 180 ?g*m-3 means that the general population must be warned and that especially sensitive groups, such as children, should be outdoors as little as possible when concentrations of ozone are at or above this level.
At levels above 360 ?g*m-3, acute danger exists for the general population. It should be noted that concentrations over 360 ?g*m-3 are quite regularly observed in mega-cities in developing countries. Chronic exposure to ozone most likely poses health risks as well, but these effects are more uncertain than the impact of peak values on acute illness.
Estimates for the Netherlands (16 million inhabitants; not very high ozone concentrations) indicate that 1,000 to 2,000 deaths per year can be attributed to ambient ozone. Furthermore, 1,200 Disability Adjusted Life Years, that is, years that a patient is severely hindered by the effects of ozone, are observed per year. The number of diseased people and the increased mortality are much higher in areas with very high ozone concentrations, such as mega-cities.
Remarkably enough, the highest ozone concentrations are not observed in the centers of these cities, because nitrogen oxide emitted by traffic rapidly reacts with ozone and reduces the peak ozone concentrations. The highest concentrations are observed in the suburbs with less traffic.
Effects of Ozone on Vegetation
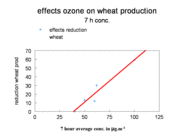 Figure 5. Reduction of wheat production by ambient ozone
  Figure 6. Discolorations on leaves due to ozone
 Ozone at elevated concentrations can cause damage to agricultural crops. The mechanism is probably as follows: ozone penetrates the leaves and needles of vegetation by way of the stomata (openings in the leaves, which allow the exchange of carbon dioxide and water vapor between the inside of the leaves and the outside ambient atmosphere); ozone is then deposited on the water layer on the cells inside the leaves and forms free radicals and ions (e.g., HO2?, HO+, OH?, and O2?), which affect the cells. Some agricultural crops, such as tobacco and spinach, are very sensitive to damage by ozone, while others are more resistant. Ecosystems, such as forests, are damaged by the same mechanism. As an example, the reduction of wheat production as a function of seven hours average daytime ozone concentration is given in Figure 5.
An averaging period of seven hours in the middle of the day is chosen because the stomata are generally open during this period. The reduction is more or less a linear function of ozone concentration, but a threshold is seen at a concentration of about 40 ppb (parts per billion). Ozone damage to vegetation is often in the form of brown discolorations on leaves.
Air quality standards to protect crops are in place in many parts of the world. European legislation is given in Table 2.
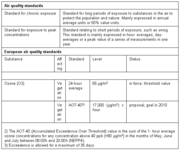 Table 2. European air quality standards for ozone
 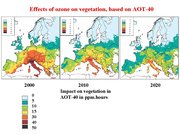 Figure 7. Present damage to forests by ozone in Europe and predictions of future developments
 The no-effect threshold has been incorporated in the newly-developed AOT-40 (exposure at concentrations over 40 ppb) standard for ozone. Estimates suggest that crop damage can be quite extensive in Europe, leading to losses of 10 to 30% of sensitive crops, such as tobacco and flowers. This has also been observed in the U.S. and in developing countries.
Measures such as reducing transportation emissions and low-NOx burners, as already mentioned, have lowered the transgression of air quality standards for vegetation in the U.S. and Europe. Figure 7 gives an overview of the transgressions of ozone standards in Europe at the present and the future. The number of areas exceeding standards will go down further, due to abatement measures of the European Commission, but some regions will have problems nonetheless.
However, it should be noted that elsewhere, particularly in rapidly developing countries, already-high ozone concentrations continue to increase.
2 Comments
Mark McGinley wrote: 10-18-2012 12:27:43
Alexis, Thank you for your comments. We are working to review articles and catch visuals that are difficult to read.
Alexis Merlaud wrote: 10-07-2012 14:03:38
Something quite bad in the whole website is the figure size: it is very hard even to read the axes