Global fossil fuel reserves and demand
| Topics: |
Contents
Introduction and Units
Fossil fuels is the term given to energy sources that formed in the geologic past and have a high hydrocarbon content which can be burned to release energy. Petroleum, coal and natural gas are prime examples. In essence, fossil fuels are stored solar energy from the past since they originated from living matter. Although nuclear energy sources are also derived from naturally occurring mined materials (uranium ore), they are not generally considered fossil fuels in that they did not originate from living matter.
While some of what we call fossil fuels may be in the formation process today, the time periods required are measured in the millions of years and thus for all practical purposes we can consider fossil fuels to be finite and non-renewable. This article discusses energy use and availability in the form of society's primary energy source, fossil fuels, while other articles cover the topics of renewable and nuclear energy sources.
Units
In order to directly compare world energy resources and consumption of energy, this article uses SI units and prefixes and measures the rate of energy production or use (power) in watts (W) and amounts of energy in joules (J). The watt (symbol: W) is the SI unit of power defined as one joule of energy transferred or dissipated in one second (J/s). Its expression in terms of SI base units is m2·kg·s3.
| Table 1. SI multiples of watt | ||
| Multiple |
Name |
Symbol |
| 100 | watt | W |
| 103 | kilowatt | kW |
| 106 | megawatt | MW |
| 109 | gigawatt | GW |
| 1012 | terawatt | TW |
| 1015 | petawatt | PW |
| 1018 | exawatt | EW |
| 1024 | yottawatt | YW |
Fossil Fuel Demand
In order to get a good perspective on the amount of fossil fuel reserves, it is best to first look at the demand side of the equation.
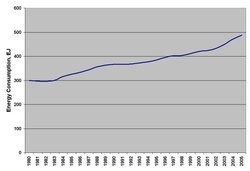
In 2005, total worldwide energy consumption was 488 exajoules, EJ (= 5 x 10²⁰ J) (or 135,600 TWh) with 86.5% derived from the combustion of fossil fuels, although there is at least 10% uncertainty in that value.[1] This is equivalent to an average energy consumption rate of 15.5 TW (= 1.55 x 10¹³ W). Not all of the world's economies track their energy consumption with the same rigor, and the exact energy content of a barrel of oil or a ton of coal will vary with quality.
The rate of energy consumption has increased over the past decade as new emerging market countries develop.
History of Demand
The following is a brief history of how this rate of energy consumption that we now see came to be.
Since the advent of the Industrial Revolution, worldwide energy consumption has grown steadily. In 1890 the consumption of fossil fuels roughly equaled the amount of biomass fuel burned by households and industry. Coal fueled the Industrial Revolution in the eighteenth and nineteenth century. With the advent of the automobile, airplanes and the spreading use of electricity, oil became the dominant fuel during the twentieth century. The twentieth century saw a rapid twenty-fold increase in the use of fossil fuels. The growth of oil as the largest fossil fuel was further enabled by steadily dropping prices from 1920 until 1973. After the oil shocks of 1973 and 1979, during which the price of oil increased from 5 to 45 US dollars per barrel, there was a shift away from oil.[2] Between 1980 and 2004, the worldwide annual growth rate was 2%, as shown in Figure 1
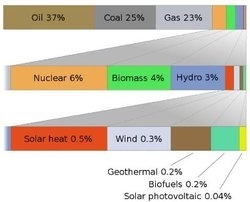
According to the U.S. Energy Information Administration's estimates,[3] the estimated 15.5 TW total power consumption of 2005 was divided as follows, with fossil fuels supplying 86% of the world's energy, as shown in Table 2. Note that this does not include biomass energy used for sustenance heating and cooking.
| Table 2 | |
| Fuel Type |
% of World's Total |
| Oil | 36.6% |
| Natural gas | 23.3% |
| Coal | 26.5% |
| Hydropower | 6.3% |
| Nuclear | 5.9% |
| Geothermal, solar, wind and wood electric power |
0.9% |
| Geothermal, solar, wind and wood not used for electric power |
0.5% |
The use of coal and natural gas has increased in proportion during the past decade, primarily for the production of electricity.
By Country
Energy consumption is loosely correlated with gross national product, but there is a large difference even between the most highly developed countries, such as Japan and Germany with 6 kW per person and United States with 11.4 kW per person. In developing countries such as India the per-person energy use is closer to 0.7 kW. Bangladesh has the lowest consumption with 0.2 kW per person.
The U.S. consumes 25% of the world's energy (with a share of global productivity at 22% and a share of the world population at 5%). The most significant growth of energy consumption is currently taking place in China, which has been growing at 5.5% per year over the last 25 years. Its population of 1.3 billion people is consuming energy at a rate of 1.6 kW per person.
Over the past four years, electricity consumption per capita in the U.S. has decreased about 1% per year between 2004 and 2008, with the decrease due mostly to efficiency increases. (For example, with the replacement of incandescent lighting with compact fluorescent lights.) Power consumption is projected to hit 4,333,631 million kilowatt-hours by 2013, an annual growth rate of 1.93% for the next five years. Consumption increased from 3,715,949 in 2004 to an expected 3,937,879 million kilowatt-hours per year in 2008, an increase of about 0.36% per year. U.S. population has been increasing recently about 1.3% per year, although the future growth rate is expected to decline.[4]
One metric of efficiency is energy intensity. This is a measure of the amount of energy it takes a country to produce a value of gross domestic product equal to one U.S. dollar. Although differences exist due to factors such as local climate conditions, Figure 3 shows some interesting trends for selected countries. For example, other highly developed countries such as Germany, Japan and the UK all have energy use intensity levels 20 to 30% lower than the U.S.
Fossil Fuel Reserves
Oil
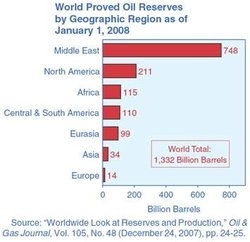
The primary fossil fuel used is oil, and the estimated total worldwide proven oil reserves, as of January 1, 2008, as reported by the Oil & Gas Journal were estimated at 1,332 billion barrels—14 billion barrels (about 1 percent) higher than the estimate for 2007.[5] According to the Oil & Gas Journal, 56 percent of the world’s proved oil reserves are located in the Middle East (See Figure 4). Among the top 20 reserve holders in 2008, 11 are OPEC member countries that, together, account for 69 percent of the world’s total reserves.
At the current rate of global oil consumption, approximately 85 million barrels per day, this represents about 43 years of proven reserves left. The actual amount of recoverable oil reserves could vary as technology changes or new discoveries are made. The rate of consumption is also projected to increase, particularly due to developing nations increasing their demand.
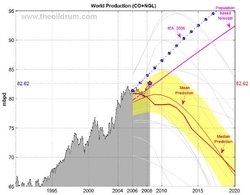
One of the more controversial topics now concerning energy is the concept of peak oil. A number of predictions have been made as to the amount of recoverable oil that will actually exist, with different models predicting vastly different results, as seen in Figure 5.[6] Some models actually say that the point of peak production is right about now, while others place that much further into the future. The determination of when the peak of oil production will occur also tends to get muddied in politics and different interest try to put their own spin on the data and influence public policy. Regardless of that, it is certain that eventually there will be a peak in production and ultimate decline as we are dealing with a finite resource. When that point occurs, classical economic theory predicts rapid escalation in oil prices. The resulting economic shock and impact, particularly on poorer nations, will be severe.
Natural Gas
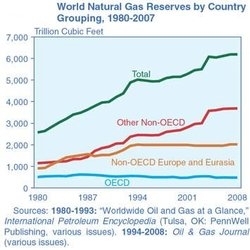
Proven reserves of natural gas steadily rose during the 20th century, although the recent trend has been for a much slower growth, as seen in Figure 6. The estimated reserves of natural gas is 6,186 trillion cubic feet.[7] At the current rate of global consumption, approximately 105 trillion cubic feet per year, this represents about 60 years of proven reserves left. As with oil, the actual amount of reserves could vary in the future, but the rate of consumption is also projected to increase to about 150 trillion cubic feet per year by 2030.
Coal
Coal is the most abundant fossil fuel. According to the International Energy Agency the proven reserves of coal are around 909 billion tonnes, which could sustain at the current production rate for 155 years.[8] This was the fuel that launched the Industrial Revolution and has continued to grow in use. China was in 2007 building about two coal fired power plants every week.[9] Coal is the fastest growing fossil fuel and its large reserves would make it a popular candidate to meet the energy demand of the global community, short of global warming concerns and other pollutants. In the United States, 49% of electricity generation comes from burning coal.[10]
Ramifications for the Future
Political considerations over the security of supplies, and environmental concerns related to global warming and sustainability will move the world's energy consumption away from fossil fuels. The concept of peak oil shows that we have used about half of the available petroleum resources, and predicts a decrease of production.
A government-led move away from fossil fuels would most likely create economic pressure through carbon emissions trading and green taxation. Some countries are taking action as a result of the Kyoto Protocol, and further steps in this direction have been proposed. For example, the European Commission has proposed that the energy policy of the European Union should set a binding target of increasing the level of renewable energy in the EU's overall mix from less than 7% today to 20% by 2020.[11]
References
Further Reading
- International Energy Agency. (2006) World Energy Outlook 2006. ISBN: 9264109897.
- Smil, Vaclav. (2003) Energy at the crossroads: Global Perspectives and Uncertainties. MIT Press. ISBN: 0262194929.
- Tester, Jefferson W. et al. (2005) Sustainable Energy: Choosing Among Options. The MIT Press. ISBN: 0262201534.
- Yergin, Daniel (1993). The Prize: The Epic Quest for Oil, Money & Power. Simon & Schuster: New York. ISBN: 0671799320.
Citation
(2010). Global fossil fuel reserves and demand. Retrieved from http://editors.eol.org/eoearth/wiki/Global_fossil_fuel_reserves_and_demand- ↑ "<a title="http://www.eia.doe.gov/pub/international/iealf/tablee1.xls" rel="nofollow" href="http://www.eia.doe.gov/pub/international/iealf/tablee1.xls">World Total Primary Energy Consumption</a>". Energy Information Administration, U.S. Department of Energy (September 12, 2007). Retrieved on 2008-11-26.
- ↑ Yergin, Daniel (1993). The Prize: The Epic Quest for Oil, Money & Power. Simon & Schuster: New York, p. 792.
- ↑ "<a title="http://www.eia.doe.gov/pub/international/iealf/table18.xls" rel="nofollow" href="http://www.eia.doe.gov/pub/international/iealf/table18.xls">Primary Energy Consumption by Source</a>". Energy Information Administration, U.S. Department of Energy (October 2, 2007). Retrieved on 2008-11-26.
- ↑ "<a title="http://www.census.gov/population/www/pop-profile/natproj.html" rel="nofollow" href="http://www.census.gov/population/www/pop-profile/natproj.html">Population Profile of the United States</a>", Jennifer Cheeseman Day, U.S. Census Bureau. Retrieved on 2008-11-26.
- ↑ <a title="http://www.eia.doe.gov/oiaf/ieo/liquid_fuels.html" rel="nofollow" href="http://www.eia.doe.gov/oiaf/ieo/liquid_fuels.html">International Energy Outlook 2008, Chapter 2</a>, Energy Information Administration, U.S. Department of Energy (June 2008). Retrieved on 2008-11-26
- ↑ "<a title="http://www.theoildrum.com/tag/update" rel="nofollow" href="http://www.theoildrum.com/tag/update">Peak Oil Update</a>", The Oil Drum, Posted 2008-09-13, Retrieved on 2008-11-26.
- ↑ <a title="http://www.eia.doe.gov/oiaf/ieo/nat_gas.html" rel="nofollow" href="http://www.eia.doe.gov/oiaf/ieo/nat_gas.html">International Energy Outlook 2008, Chapter 3</a>, Energy Information Administration, U.S. Department of Energy (June 2008). Retrieved on 2008-11-26.
- ↑ International Energy Agency. (2006) World Energy Outlook 2006, pg. 127.
- ↑ "<a title="http://news.bbc.co.uk/2/hi/asia-pacific/6769743.stm" rel="nofollow" href="http://news.bbc.co.uk/2/hi/asia-pacific/6769743.stm">China building more power plants</a>", BBC News, Last Updated: Tuesday, 19 June 2007, Retrieved on 2008-11-2.
- ↑ "<a title="http://www.eia.doe.gov/cneaf/electricity/epa/epat1p1.html" rel="nofollow" href="http://www.eia.doe.gov/cneaf/electricity/epa/epat1p1.html">Net Generation by Energy Source by Type of Producer</a>", Energy Information Administration, U.S. Department of Energy (October 22, 2007). Retrieved on 2008-11-26.
- ↑ "<a title="http://ec.europa.eu/energy/energy_policy/doc/03_renewable_energy_roadmap_en.pdf" rel="nofollow" href="http://ec.europa.eu/energy/energy_policy/doc/03_renewable_energy_roadmap_en.pdf">Communication from the Commission to the European Parliament - Renewable Energy Roadmap</a>". Retrieved on 2008-11-26.
